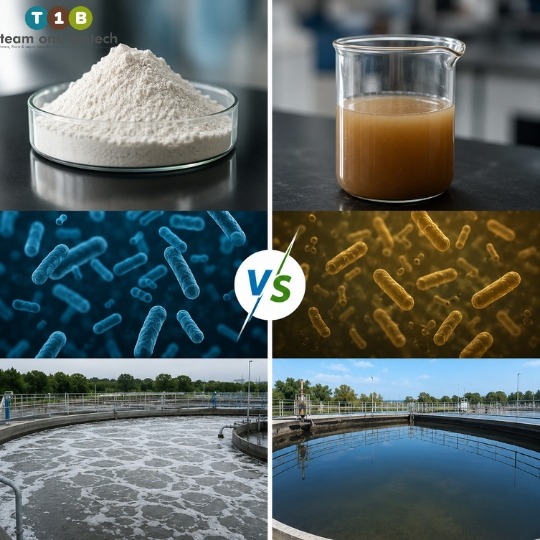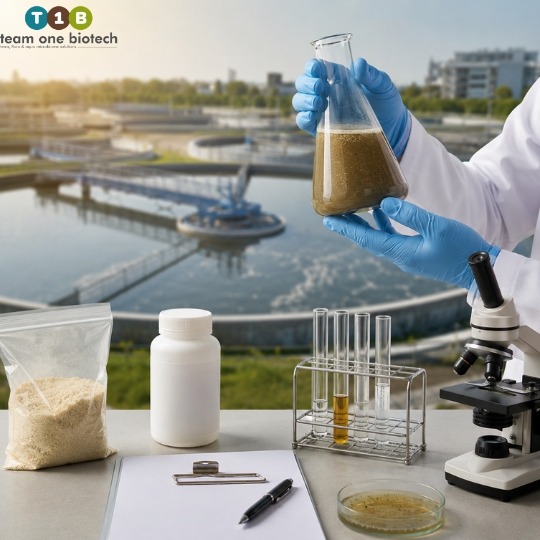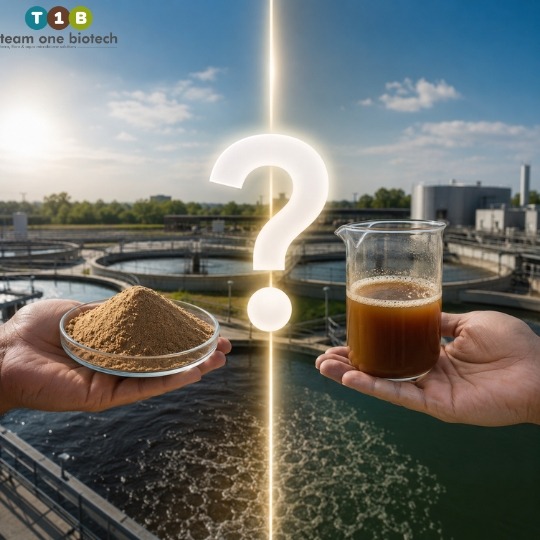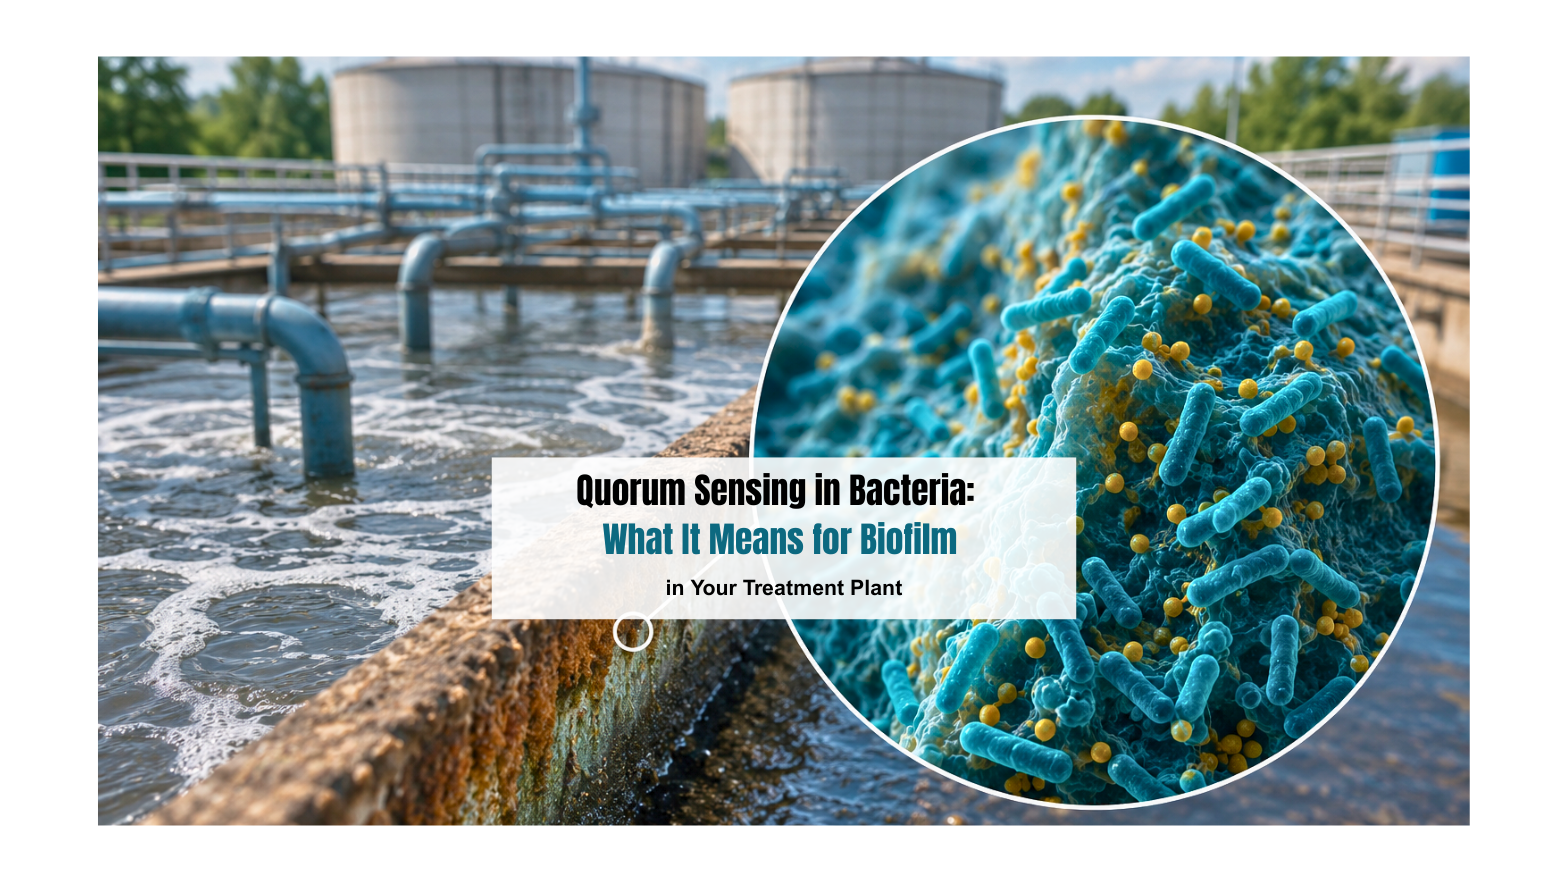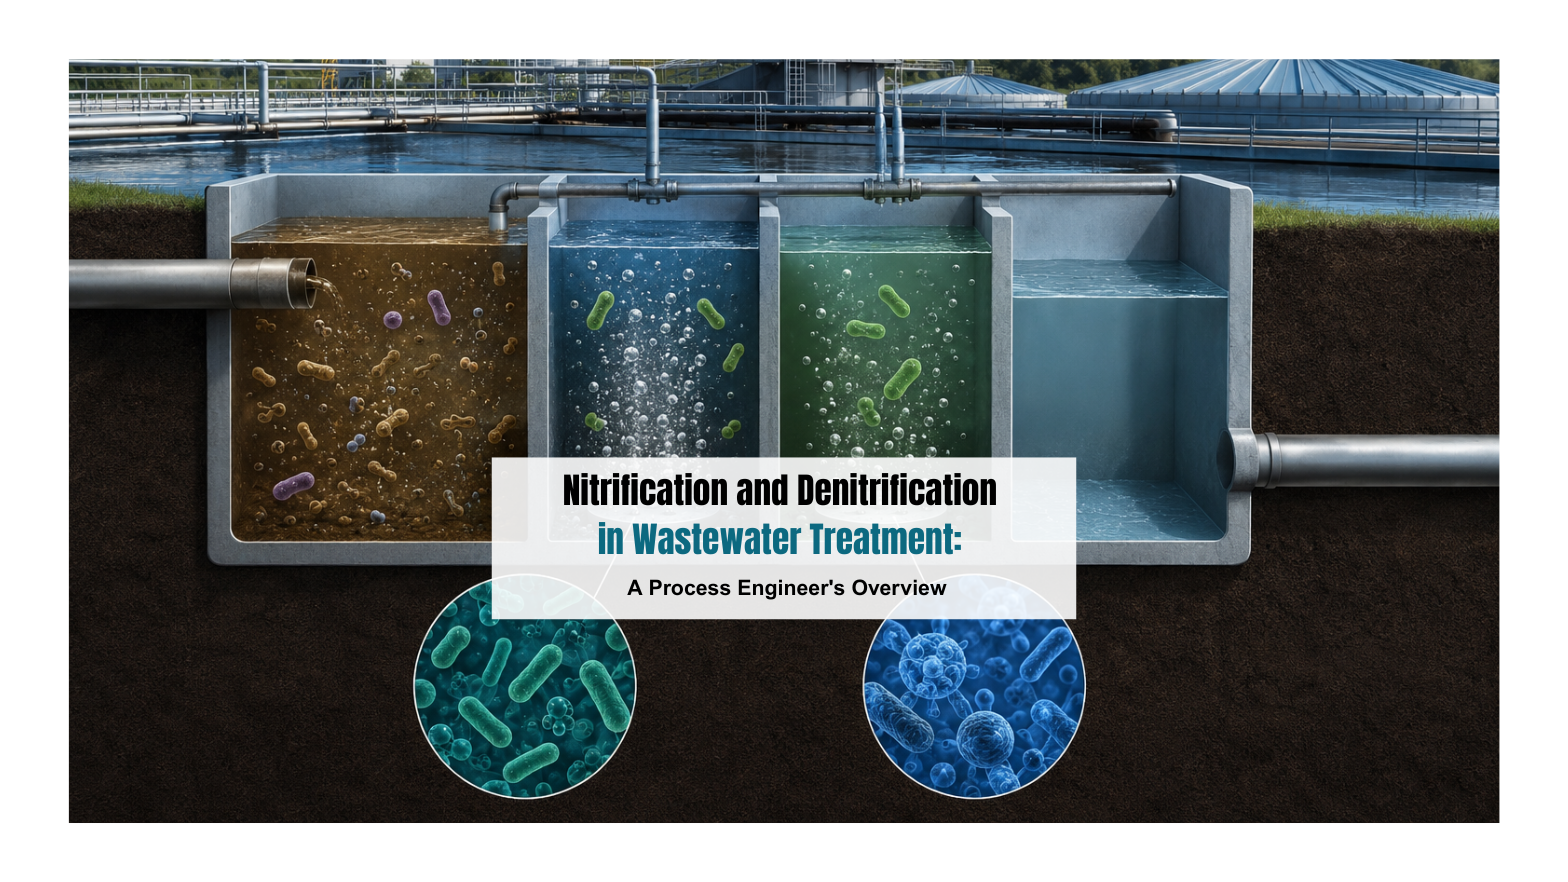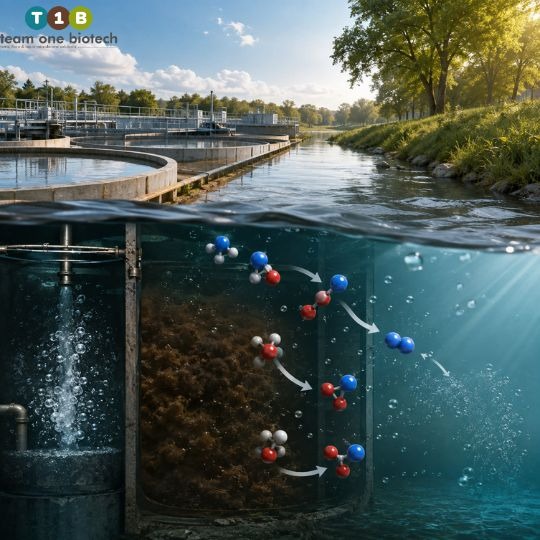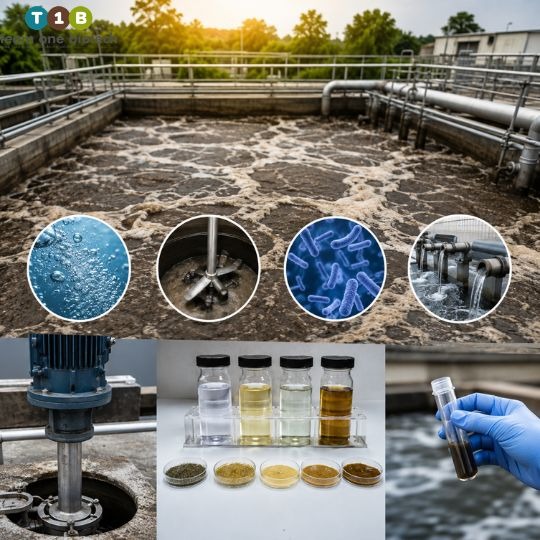
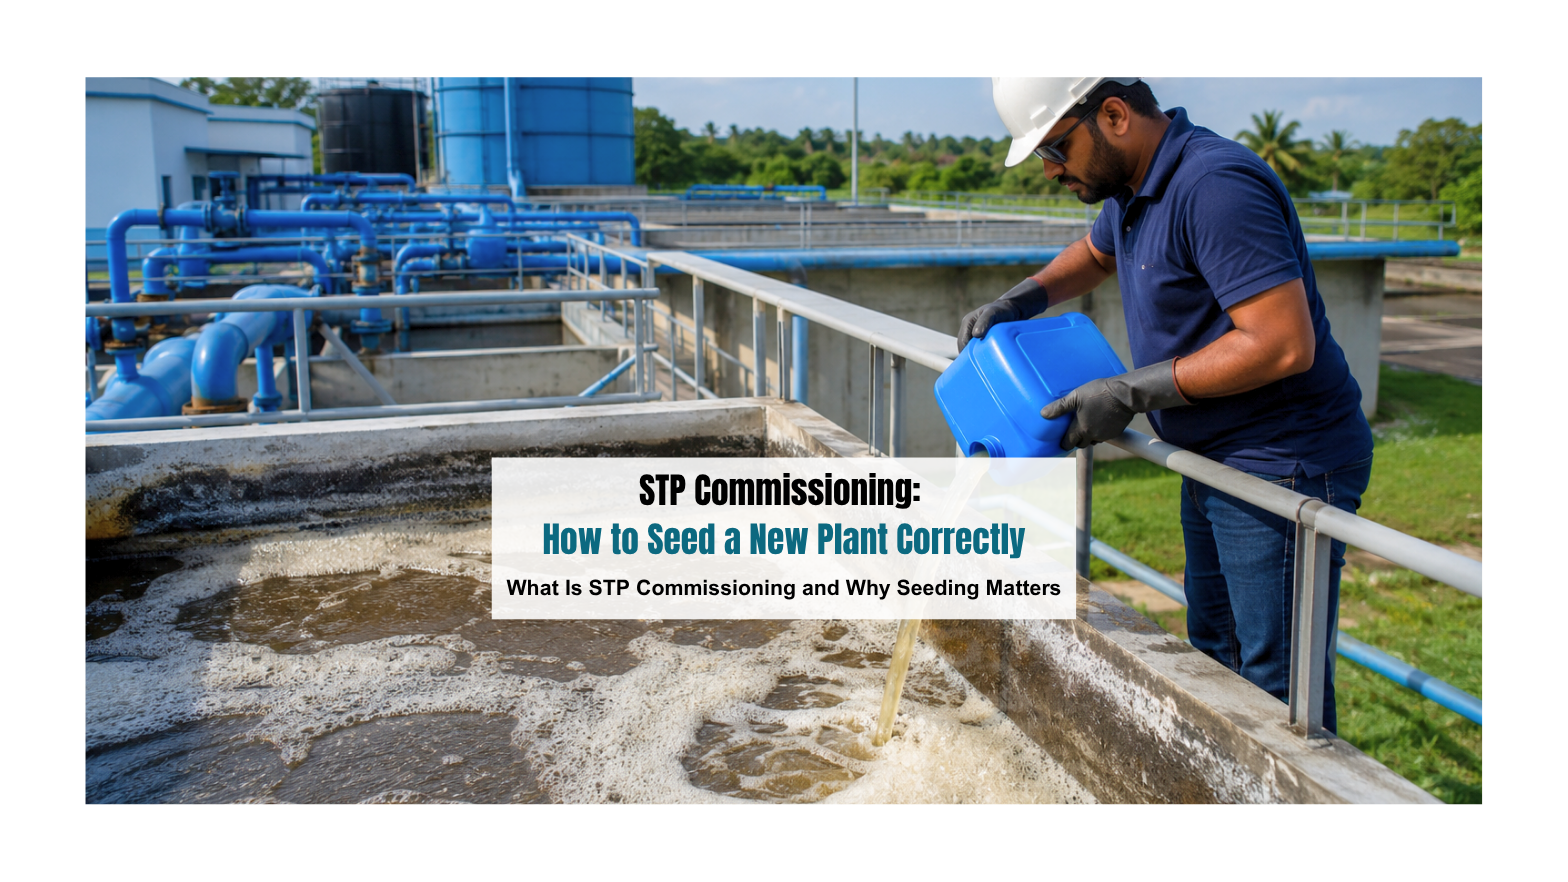
STP Commissioning: How to Seed a New Plant Correctly

You have been on-site for months. The civil work is done, the blowers are running, the tanks are full of water, and the client is standing next to you with a handover checklist. Somewhere in the background, the regulatory clock is already ticking. The consent to operate has been issued. The first self-monitoring report is due in weeks.

And biology? Biology is nowhere near ready.

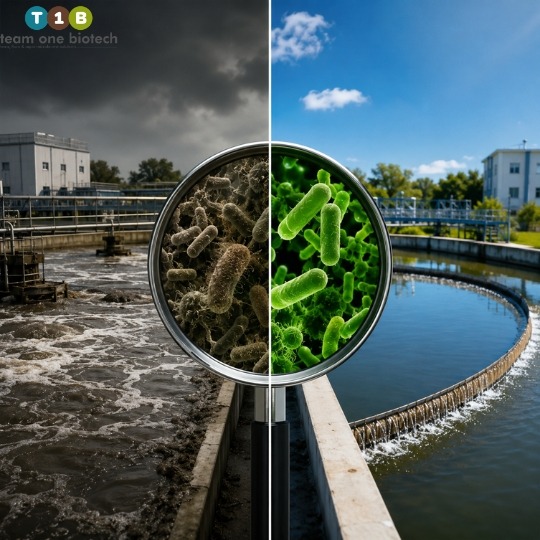
This is the moment that separates engineers who understand STP commissioning from those who are about to learn a very expensive lesson. A newly constructed plant is nothing more than an empty vessel until a functioning microbial community has been established inside it. The tanks are clean, the equipment works, but the treatment capacity is essentially zero. Raw sewage entering an un-seeded system will pass through with BOD and COD levels barely changed, TSS readings that would alarm any inspector, and effluent that is nowhere close to CPCB discharge norms.

The mistake we see repeatedly on-site is simple: teams under pressure introduce full sewage load into an un-seeded system, wait two weeks, check the effluent quality, and cannot understand why the numbers are still dangerously off. The biology of an STP does not self-assemble overnight. It has to be deliberately established, carefully managed, and given time to stabilize.

This guide covers exactly how to do that, the right way.

What Is STP Commissioning and Why Seeding Matters
What Is STP Commissioning and Why Seeding Matters

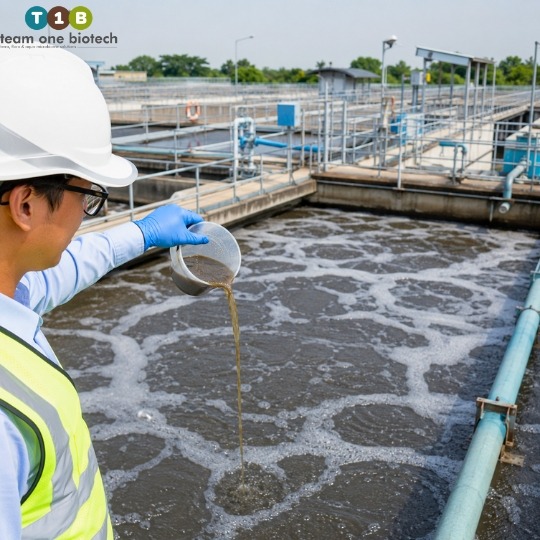
STP commissioning is the process of transitioning a newly constructed plant from mechanical readiness to stable biological operation. It is not the same as dry testing. Dry testing checks whether your blowers are rotating, your pumps are delivering the right flow rates, your instrumentation is calibrated, and your civil structures are watertight. Dry testing is necessary. But it tells you nothing about whether your plant can actually treat sewage.

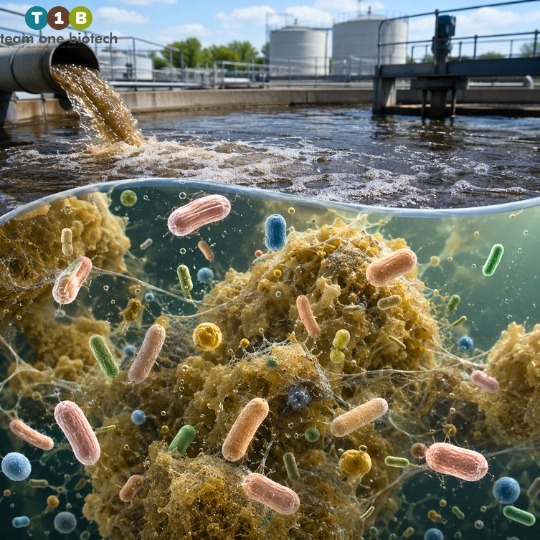
Biological startup is a different discipline entirely. It is the process of establishing a living, functioning microbial ecosystem inside your aeration tanks, biofilm carriers, or membrane chambers, an ecosystem capable of breaking down organic pollutants, reducing ammonia, and delivering treated effluent that meets regulatory standards.

Seeding new STP systems with the right microbial consortia is not an optional step that some engineers choose to take. It is the critical foundation on which everything else depends. It determines how quickly your plant reaches stable effluent quality. It determines whether you can meet CPCB and SPCB discharge norms from your very first regulated sample collection. It determines how resilient your system is during the vulnerable startup phase, when the microbial population is still thin and susceptible to washout or souring under hydraulic or organic shock.

Our team at Team One Biotech has spent years formulating specialized STP commissioning bacteria products specifically for rapid biofilm establishment and high BOD/COD reduction performance in new plants across India. We have seen what happens when seeding is done correctly, and we have seen the consequences when it is skipped or done poorly.

Need the right biological culture for your plant startup? Contact Team One Biotech’s technical team for a site-specific seeding recommendation.

Understanding the Microbial Ecosystem You Are Building
Understanding the Microbial Ecosystem You Are Building

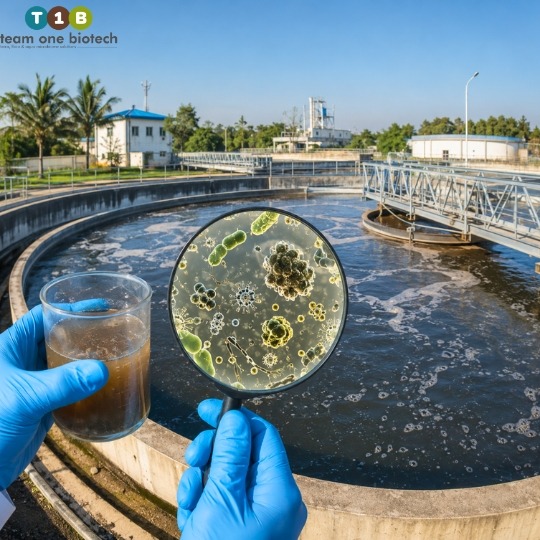
Before you can manage a startup effectively, you need to understand what you are actually building. A functioning STP bioreactor is not a single species, it is a diverse, interdependent community of microorganisms, each playing a specific functional role in the treatment process.

Heterotrophic bacteria are your workhorses. They consume soluble organic matter and are directly responsible for BOD and COD reduction. They are relatively fast-growing, relatively tolerant of variable conditions, and typically the first population to establish itself during STP startup.

Nitrifying bacteria are the slow-movers. These organisms, primarily Nitrosomonas and Nitrobacter, convert ammonia to nitrite and nitrate respectively. They are far more sensitive than heterotrophs. They are inhibited by low dissolved oxygen, by low pH, by sudden temperature changes, and by a wide range of industrial compounds. Their generation times are measured in days rather than hours. Getting nitrification established is often the longest and most technically demanding part of biological treatment startup.

Denitrifying bacteria handle total nitrogen reduction. In extended aeration systems and designs with anoxic zones, these organisms convert nitrate to nitrogen gas, completing the nitrogen removal cycle. Their establishment depends on proper anoxic zone management and substrate availability.

Facultative and anaerobic organisms play important roles in sludge digestion, fermentation zones, and pre-treatment stages. Their community composition will vary significantly depending on your plant design.

The reason this taxonomy matters during plant commissioning is simple. If your seeding strategy does not account for the diversity of organisms you need, or if your early operating conditions suppress the growth of slow-establishing populations like nitrifiers, you will have a plant that partially works, that reduces BOD adequately but cannot control ammonia, or that performs well on low loads but collapses under normal flow.

Understanding what you are building allows you to protect the populations that are most at risk during the startup phase.

Step-by-Step Guide to Seeding a New STP Correctly
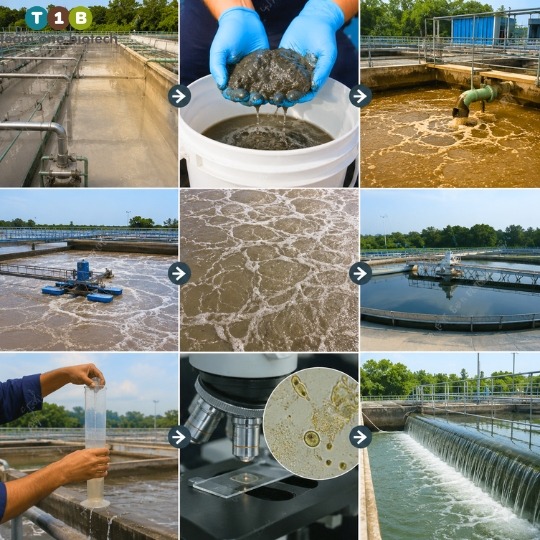
Step-by-Step Guide to Seeding a New STP Correctly

This is the section that matters. The steps below represent a commissioning sequence that our application engineers have refined across dozens of STP startup projects in municipal, residential, and commercial settings.

Step 1: Complete Dry Testing Before Any Biological Work Begins

Before a single microorganism enters your system, every piece of mechanical and electrical equipment must be tested and verified. Blowers, aerators, return activated sludge (RAS) pumps, mixers, sludge transfer equipment, and instrumentation must all be functioning correctly and consistently.

Introducing a microbial seed into a system with faulty aeration, erratic pump behavior, or malfunctioning DO sensors is not just ineffective, it will kill the culture before it has any chance to establish. Biological startup amplifies problems in your mechanical systems. Fix them first.

Step 2: Fill the Bioreactor and Stabilize Operating Conditions

Fill the aeration tank with clean water or appropriately diluted sewage before introducing any biological seed. Allow the system to run and stabilize before you introduce any culture. Key parameters to confirm at this stage include dissolved oxygen levels, pH, and temperature, all of which need to be within appropriate operating ranges before seeding begins.

Typical indicative ranges for biological activity are dissolved oxygen between approximately 1.5 to 3.0 mg/L, pH in the range of approximately 6.5 to 8.5, and temperature in ranges broadly consistent with mesophilic bacterial activity.

Disclaimer: These are general indicative values. Actual parameters vary based on plant design, influent characteristics, and applicable regulatory norms. Always refer to your specific CPCB/SPCB consent conditions.

Do not rush this stabilization phase. Seeding into an unstable system is a waste of product and time.

Step 3: Introduce the Microbial Seed

This is the most consequential step in the entire STP startup sequence. The quality, concentration, and composition of the seed culture you introduce will directly determine how quickly your plant reaches biological stability.

Using a high-density, broad-spectrum STP commissioning bacteria product, formulated specifically for new plant startup, significantly shortens the acclimatization period compared to relying solely on naturally occurring microorganisms or opportunistic colonization from raw sewage. Commercial bioaugmentation products from manufacturers like Team One Biotech are formulated to contain the full range of organisms your plant needs: fast-establishing heterotrophs to begin BOD reduction immediately, and robust nitrifier populations to begin building the ammonia-oxidizing community as conditions stabilize.

Seed sludge from an existing operating STP is sometimes used to supplement or partially replace a commercial seed. There is value in this approach when the donor plant is well-run, treats a similar quality of sewage, and is free of disease outbreak-related conditions. However, there are real risks: importing pathogenic organisms adapted to another facility, introducing populations poorly suited to your plant’s specific design loading, or bringing in organisms that perform well at the donor plant’s conditions but poorly in your new system. Use donor sludge as a supplement, not as your primary seeding strategy.

Step 4: Begin Nutrient Dosing

A freshly seeded system often lacks the nutritional balance required for rapid microbial growth. In biological treatment, the critical nutrient ratio is the relationship between carbon (approximated by BOD), nitrogen, and phosphorus. If incoming sewage is nutrient-deficient, as is sometimes the case with certain industrial or mixed-use streams, supplemental nitrogen and phosphorus dosing is required to fuel microbial growth during the early startup phase.

Indicative nutrient ratios for aerobic biological treatment are broadly in the range of approximately 100:5:1 for BOD:N:P.

Disclaimer: These are general indicative values. Actual parameters vary based on plant design, influent characteristics, and applicable regulatory norms. Always refer to your specific CPCB/SPCB consent conditions.

Under-dosing nutrients during seeding new STP systems is one of the most overlooked mistakes in early-stage commissioning. Do not assume the incoming sewage is nutritionally balanced.

Step 5: Monitor and Maintain Alkalinity

Nitrification, the biological conversion of ammonia to nitrate, is an acid-generating process. Each unit of ammonia oxidized consumes alkalinity from the system. In plants with significant nitrification demand, alkalinity depletion can cause pH to drop sharply during the STP startup phase. A falling pH inhibits the very nitrifying bacteria you are trying to establish, creating a feedback loop that is difficult to break once it begins.

Monitor alkalinity regularly throughout the commissioning period. Maintain it within ranges that provide adequate buffering capacity, typically in the region of approximately 100 to 200 mg/L as CaCO₃ or higher depending on ammonia loading.

Disclaimer: These are general indicative values. Actual parameters vary based on plant design, influent characteristics, and applicable regulatory norms. Always refer to your specific CPCB/SPCB consent conditions.

Sodium bicarbonate is the most commonly used alkalinity supplement in STP commissioning. Have it available and dose proactively, not reactively.

Step 6: Ramp Up Organic and Hydraulic Loading Gradually

This is the step most often compromised under project timeline pressure, and it is the step most responsible for startup failures. Do not introduce full design flow or full organic load immediately after seeding. Begin at a fraction of design loading, typically somewhere in the range of approximately 20 to 30 percent, and increase incrementally over several weeks as the microbial population grows, the biofilm establishes, and effluent quality trends improve.

Disclaimer: These are general indicative values. Actual parameters vary based on plant design, influent characteristics, and applicable regulatory norms. Always refer to your specific CPCB/SPCB consent conditions.

The biological community in a newly seeded plant is fragile. Hydraulic washout, caused by introducing flows that exceed the settling or retention capacity of a still-thin sludge blanket, is one of the fastest ways to undo weeks of careful startup work. Organic overloading can suppress dissolved oxygen, shift the microbial community toward fermentative pathways, and produce the foul odors and poor effluent quality that are the hallmarks of a troubled plant commissioning.

Patience at this stage pays dividends for the operational life of the plant.

Step 7: Monitor Key Parameters Daily

During the commissioning period, monitoring is not a weekly task. It is a daily discipline. The parameters that matter during biological startup include BOD, COD, TSS, dissolved oxygen, pH, MLSS (mixed liquor suspended solids), and where relevant, ammonia nitrogen and alkalinity.

What you are looking for is not a single passing reading. You are tracking trends. A stable or improving trend across multiple days in BOD reduction, increasing MLSS, and rising sludge volume index (SVI) is a sign that your biological community is growing and stabilizing. A sudden drop in DO despite consistent aeration, or rising COD on a flat organic load, tells you something is wrong and needs immediate investigation.

Step 8: Evaluate Effluent Against Discharge Norms as Loading Ramps Up

As the plant approaches design loading and effluent quality begins to stabilize, begin formal evaluation of treated effluent against your applicable CPCB or SPCB discharge norms. Begin documenting results from the earliest possible stage. Establishing a positive regulatory record, even before formal monitoring is mandated, is an asset that demonstrates competence and builds goodwill with the regulatory authority.

Common STP Commissioning Mistakes That Set Plants Back
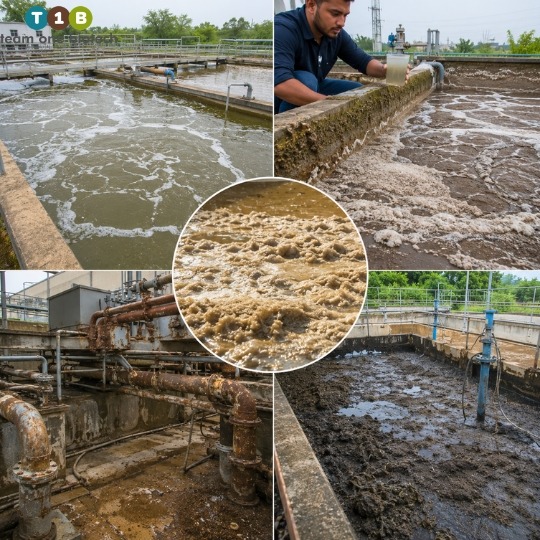
Common STP Commissioning Mistakes That Set Plants Back

These are not theoretical errors. They are patterns our engineers have observed repeatedly during plant commissioning across India.

  • Flooding the system with full sewage load before the microbial population has established, the single most common mistake, usually driven by project timeline pressure.
  • Skipping or under-dosing nutrient supplementation during the first weeks of startup, starving the microbial population when it should be growing fastest.
  • Ignoring alkalinity until the pH crashes and nitrification collapses, then spending weeks trying to rebuild a suppressed nitrifier population.
  • Using seed sludge from an industrial ETP to start a domestic sewage plant, the microbial communities are shaped by very different substrates and will not perform optimally in a mismatched environment.
  • Failing to calibrate and verify DO sensors before startup, then operating blind on aeration management during the most sensitive phase of biological treatment startup.
  • Treating the commissioning period as a bureaucratic formality rather than a critical biological engineering phase, with insufficient qualified staff on-site and no daily monitoring protocol in place.
  • Introducing seed and then reducing aeration to save power, a false economy that starves the aerobic population exactly when it needs oxygen most.

Getting the seeding phase wrong is not just an operational problem. It is a compliance risk that can delay commercial operation, attract regulatory attention, and cost far more to remediate than a properly executed startup would have cost from the beginning.

How Team One Biotech Supports STP Startup and Commissioning

Team One Biotech’s role in the commissioning process goes beyond supplying a product and walking away. Our involvement is technical and application-specific.

Our core offering for plant commissioning is a range of specialized STP commissioning bacteria products, high-density, broad-spectrum microbial cultures formulated to establish rapidly in new plants, deliver measurable BOD and COD reduction within the first weeks of operation, and build the resilient nitrifier populations that are critical for long-term ammonia compliance.

Beyond the product, our application engineers work directly with project teams to develop site-specific dosing protocols, loading ramp-up schedules, nutrient management plans, and parameter monitoring frameworks. We understand that no two plants are identical. Influent characteristics, reactor design, ambient temperature, and applicable discharge norms all vary. Our commissioning support is tailored to those specifics, not delivered as a one-size-fits-all recommendation.

We have supported STP startup projects across municipal, large-scale residential, commercial, and hospitality segments across India. Our track record includes plants that have achieved compliance from their first regulated monitoring cycle, not because we were lucky, but because the commissioning process was engineered correctly from the start.

As an Indian manufacturer of bioremediation and STP biological treatment solutions, our products and support are designed around the regulatory framework and operating conditions that Indian engineers actually work within.

Planning a new STP startup? Let Team One Biotech’s application engineers design a commissioning protocol tailored to your plant configuration and discharge norms. Get in touch today.

Frequently Asked Questions on STP Commissioning

Q: How long does it typically take to commission a new STP biologically?

The timeline depends significantly on plant design, organic loading, ambient temperature, and the quality of the seeding strategy. Heterotrophic BOD reduction can begin showing measurable improvement within the first one to two weeks of startup. Full nitrification, and therefore complete compliance with ammonia-based discharge norms, typically requires a longer period, often several weeks to a few months, depending on conditions. Using a quality STP commissioning bacteria product with a strong nitrifier component, and managing the ramp-up carefully, can substantially shorten this timeline compared to relying on natural colonization alone.

Q: Can I use sludge from another STP to seed my new plant?

Yes, with appropriate caution. Donor sludge from a well-operated plant treating similar sewage can provide a useful supplementary seed. However, it introduces risks: potential import of pathogenic or poorly adapted organisms, variability in community composition, and dependence on the operational health of the donor plant. Commercial bioaugmentation products offer a more controlled, consistent, and concentrated alternative. For most plant commissioning scenarios, we recommend using a purpose-formulated commercial seed as the primary inoculant, with donor sludge as an optional supplement.

Q: What happens if I skip the seeding phase entirely and rely on natural colonization?

The plant will eventually develop a microbial community, but the timeline is unpredictable, often significantly longer, and the startup period will be characterized by poor BOD reduction, high COD, and effluent that consistently fails to meet CPCB norms. The risk of regulatory non-compliance during this extended startup window is real. In competitive project environments where clients and regulators expect performance from the first weeks of operation, relying on natural colonization is a risk that is difficult to justify.

Q: What role does aeration play during STP startup?

Dissolved oxygen is the limiting factor for aerobic microbial growth. Without adequate aeration, the biological community cannot establish effectively, heterotrophic BOD reduction is incomplete, and nitrification, which is extremely sensitive to oxygen depletion, will not proceed. During STP startup, aeration management is more nuanced than during normal operation. Too little oxygen starves the culture. Too much can cause excessive turbulence that disrupts floc formation or strips out the biomass before it has settled into a stable sludge blanket. Aeration must be calibrated carefully during the ramp-up phase, and DO should be monitored daily.

Get the Biology Right Before You Open the Gates

Successful STP commissioning is fundamentally a biological engineering challenge. The microbial community you establish during the startup phase will define the treatment performance, the regulatory compliance trajectory, and the operational resilience of that plant for years to come. Cutting corners at this stage, under timeline pressure, under budget pressure, or simply through underestimating the complexity of biological startup, creates problems that are costly to fix, difficult to explain to regulators, and sometimes impossible to reverse without a full restart.

Approach seeding new STP systems as a science. Understand what organisms you need, create the conditions for them to establish, protect them during the vulnerable early phase, and ramp up loading with patience and discipline. The plants that hit compliance from their first monitoring cycle are not lucky, they are the product of commissioning processes that were planned and executed correctly from day one.

The right STP commissioning bacteria, the right dosing protocol, and the right technical support make all of this achievable, on time and within scope. Talk to Team One Biotech’s technical team before your next STP commissioning. Our biological products and application support are designed to help your plant achieve compliance from the very first cycle of operation.

Looking to improve your ETP/STP efficiency with the right bioculture?
Talk to our experts at Team One Biotech for customised microbial solutions.

Contact: +91 8855050575

Email:  sales@teamonebiotech.com

Visit: www.teamonebiotech.com

Discover More on YouTube – Watch our latest insights & innovations!-

Connect with Us on LinkedIn – Stay updated with expert content & trends!
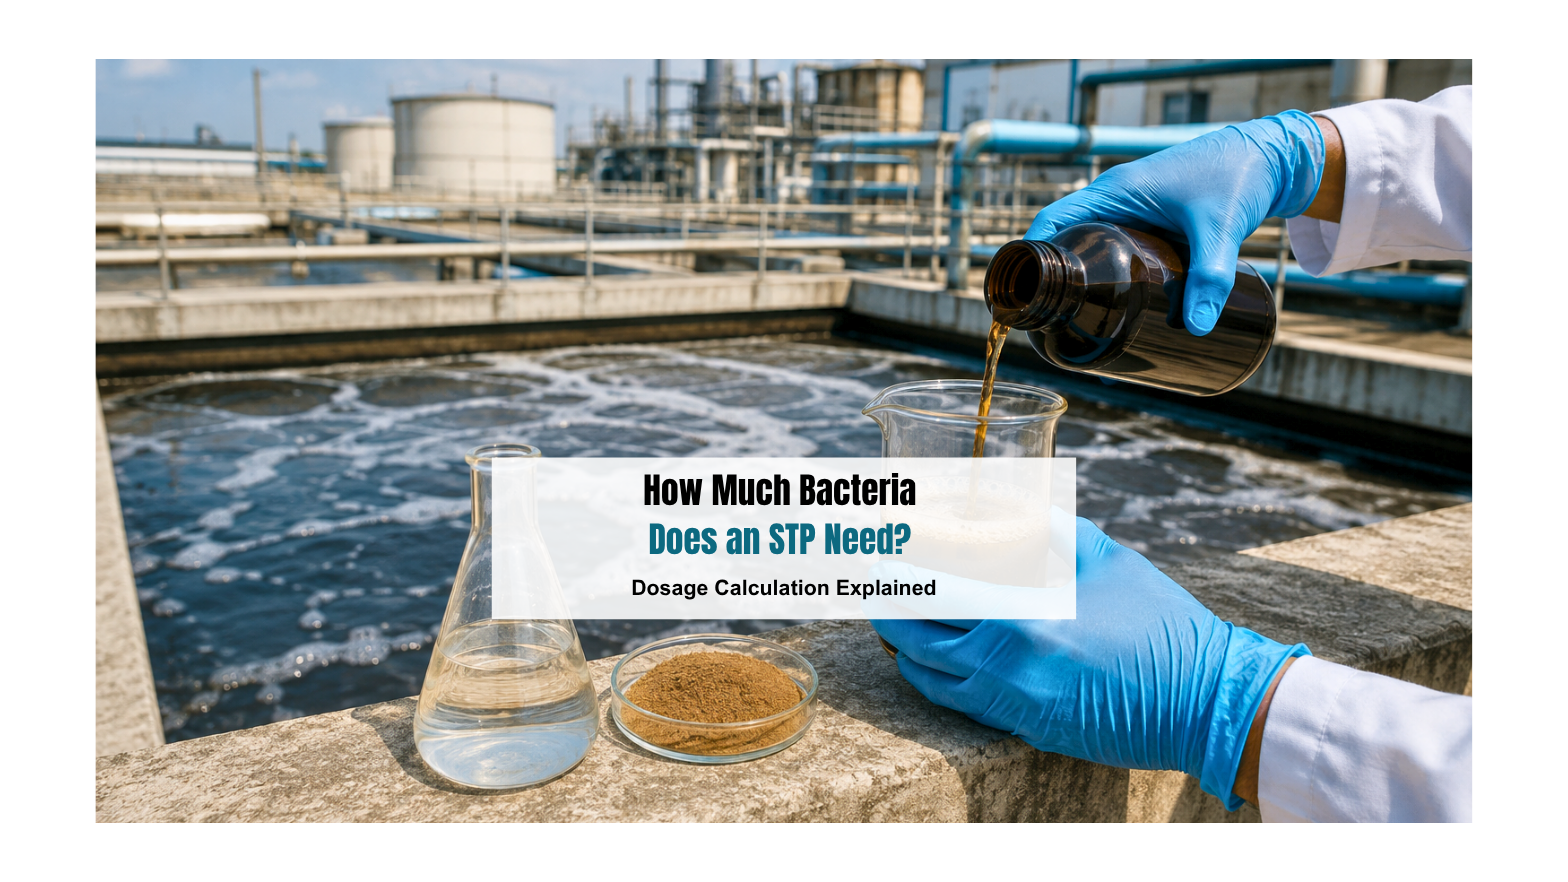
How Much Bacteria Does an STP Need? Dosage Calculation Explained

Underdose your bioculture and your STP begins to fail, BOD climbs, COD spikes, and the regulator’s notice arrives before you notice the problem. Overdose it and you are burning the budget without any performance gain. The question every STP operator eventually faces is the same: exactly how much bacteria does this plant need?

It is a deceptively simple question with a genuinely complex answer. STP bacteria dosage is not a single number you can read off a chart. It is a calculation, one that depends on where your plant currently stands biologically, how much organic load it is processing, and what product you are dosing. Get that calculation right, and your plant runs cleanly within CPCB norms. Get it wrong, and you are either fighting effluent violations or wasting money on bioculture that is doing nothing measurable.

This guide walks you through both the parameters you need to understand and the step-by-step framework for calculating bioculture dosage for your STP with confidence.

Why Getting the Dosage Wrong Costs More Than You Think

Why Getting the Dosage Wrong Costs More Than You Think

Most STP operators who struggle with dosage decisions are not making careless mistakes. They are working with incomplete frameworks. They know bioculture is necessary; they are less certain about how to size it correctly. That uncertainty has real consequences.

When you underdose, the biological community inside your aeration tank becomes numerically insufficient relative to the organic load arriving in your influent. The microorganisms present are overwhelmed. BOD and COD removal efficiency drops. The effluent that exits your secondary clarifier carries more suspended solids, more organics, and more biological oxygen demand than CPCB and SPCB discharge standards permit. What follows is familiar to any veteran operator, escalating notices, potential shutdowns, and the expense of emergency remediation that always costs far more than prevention would have.

Overdosing creates a different class of problem. Excess bacterial mass that cannot find sufficient food substrate does not simply disappear. It dies, autolyses, and contributes to your sludge burden. Sludge handling, dewatering, and disposal costs rise. Your F/M ratio shifts unfavourably. The additional bioculture product you purchased generates no treatment benefit. From a budget perspective, it is dead spend.

Both scenarios are preventable. The path between them is a structured, data-driven dosage calculation framework, and that is exactly what this article provides.

The Key Parameters You Must Know Before Calculating Dosage

The Key Parameters You Must Know Before Calculating Dosage

Bacterial dosage calculation for sewage treatment plants is grounded in four operational parameters. Understanding these before touching a dosage calculator is not optional, it is the foundation everything else is built on.

Mixed Liquor Suspended Solids (MLSS)

MLSS is the concentration of suspended solids, biological and inert, in your aeration tank. It is the primary proxy for biological mass in an active STP. When operators talk about “how much biology is in the tank,” they are talking about MLSS.

A healthy, functioning STP aeration tank maintains MLSS within a range that balances sufficient microbial density with manageable sludge settleability. When MLSS falls below the lower threshold of that range, the biological community is too sparse to efficiently process incoming organic load. This is the primary trigger condition for bioaugmentation, the deliberate addition of concentrated external bioculture to supplement or rebuild the in-situ microbial population.

Disclaimer: The values mentioned above are general indicative ranges. Actual parameters vary significantly depending on plant design, influent composition, temperature, SRT, and operational history. Always calibrate dosages based on site-specific testing.

Food-to-Microorganism (F/M) Ratio

The F/M ratio describes the relationship between the organic food available in your system and the microbial population present to consume it. Think of it as a feeding balance. Too much food relative to microorganisms and your biology is overwhelmed, leading to poor BOD/COD removal. Too little food and you have excess biomass with nowhere to put its energy, leading to endogenous decay, poor sludge quality, and operational instability.

A balanced F/M ratio is the hallmark of a well-managed biological treatment process. When the ratio is off, the symptoms are visible in your aeration tank and clarifier: bulking sludge that refuses to settle properly, effluent turbidity that persists despite normal operations, and foam that builds up in ways it should not. Operators who regularly monitor F/M ratio alongside MLSS are equipped to catch these imbalances before they become compliance failures.

Disclaimer: Optimal F/M values are indicative and must be calibrated to individual plant conditions.

Organic Loading Rate (OLR)

Organic Loading Rate connects your influent quality to your biological demand. It is calculated from two variables you should be measuring consistently, your daily flow rate and the BOD or COD concentration of the incoming sewage. Together, these give you the total mass of organic material your system must process each day, typically expressed in kilograms of BOD or COD per day.

OLR matters for STP bacteria dosage because it directly determines how much biological mass your system needs. A plant receiving a high organic load requires a proportionally denser and more active microbial community to achieve the same treatment efficiency as a lightly loaded plant. This is why static dosage rules, “add this much per MLD”, consistently underperform. They ignore the actual organic challenge the biology is facing.

Seasonal and diurnal fluctuations in influent composition make OLR a moving target, which is why dosage decisions made annually or even quarterly tend to drift out of calibration over time.

Hydraulic Retention Time (HRT)

HRT is the average length of time that wastewater spends inside your aeration tank before moving to the clarifier. It determines how long your microbial population has to act on incoming organics before they pass through.

Shorter HRT means less contact time between biology and substrate. To compensate, your system needs a denser, more active microbial population, which pushes your dosage requirement upward. Plants with generous HRT have more contact time to work with and can achieve similar removal efficiencies at lower MLSS concentrations. When you are calculating bioculture dosage for your STP, HRT is a critical multiplier that shapes how aggressively you need to supplement your biological community.

Disclaimer: All parameter ranges and dosage figures referenced in this article are general indicative values intended for educational purposes. Actual bioculture dosage requirements vary significantly based on plant design, influent composition, temperature, HRT, SRT, and current biological health. Always conduct site-specific testing and consult a qualified process engineer before making dosage decisions.

How to Calculate Bioculture Dosage for Your STP, A Practical Framework

How to Calculate Bioculture Dosage for Your STP, A Practical Framework

Now that the foundational parameters are clear, the dosage calculation itself becomes structured and logical. The important thing to understand at the outset is that bioculture dosage STP calculation is not a lookup, it is a function of your plant’s current biological health, its organic load, and the concentration of the specific product you are using. Here is how to work through it systematically.

Step 1, Assess Your Current Biological Health

Begin with a clear picture of where your aeration tank biology currently stands. Pull a fresh MLSS measurement. Compare it against the target MLSS range appropriate for your plant design and influent type.

The difference between your current MLSS and your target MLSS is your biomass deficit. This deficit is what your initial dosage must address. A plant that is operating at sixty percent of its target MLSS has a substantially larger deficit than a plant running at ninety percent, and the dosage required to correct the first condition is meaningfully larger than what the second needs.

If your plant is recovering from a biological crash, a high chlorine dosing event, a severe pH excursion, or a toxic influent spike, your effective MLSS may be significantly lower than what the reading suggests, because a portion of the suspended solids you are measuring may be dead or dying biomass rather than active, viable microorganisms. In these conditions, assume a larger deficit and plan a more aggressive corrective dose.

Step 2, Determine Your Organic Load

Calculate your current organic loading rate using your most recent influent flow and BOD or COD measurements. Express this as kilograms of BOD or COD per day.

This figure tells you what your biological system is being asked to process. From your plant design parameters or your baseline operational data, you should have a sense of the MLSS density required to process that specific load to the required effluent standard. If the MLSS required to handle your current organic load is higher than what Step 1 revealed you actually have, the difference further confirms the dosage requirement identified in Step 1.

For plants where influent quality is variable, residential STPs receiving fluctuating loads, commercial facilities with intermittent industrial discharge, calculate OLR on a rolling average rather than a single data point. This prevents you from dosing for a single high-load day and then being under-dosed the rest of the month, or vice versa.

Step 3, Factor in the Bioculture Concentration

Not all bioculture products are equivalent. The amount of product you need to achieve a target biomass addition depends directly on the viable cell count per unit volume or weight of the specific formulation you are using, expressed as CFU per millilitre or CFU per gram.

This is where generic “rules of thumb” reliably fail operators. A bioculture product with a high viable cell count delivers significantly more active biology per kilogram than a diluted or degraded product with lower CFU. Using the same dosage volume for both gives you very different biological outcomes.

Always work from the product data sheet. Obtain the specified potency, CFU/mL or CFU/g, and use that figure to convert your calculated biomass requirement into an actual product quantity. Team One Biotech’s bioculture formulations carry specified potency data, and dosing recommendations are built around product-specific parameters rather than general approximations. This is the difference between a calculated dose and a guessed one.

Step 4, Differentiate Between Startup and Maintenance Dosing

One of the most common bioculture dosage STP errors is applying the same dosage logic to two fundamentally different scenarios: startup and maintenance. These are not the same situation, and treating them identically produces consistently poor results.

Startup dosing applies when you are seeding a new plant, restarting after shutdown, or recovering from a biological crash. The objective is to establish or re-establish a functional microbial population from a near-zero baseline. This requires a significantly higher dose, sometimes multiples of what the steady-state maintenance dose will be, delivered over a compressed initial period, with daily monitoring to track the biological response.

Maintenance dosing applies during normal operations when a functioning microbial population already exists. The objective here is to replenish natural die-off, compensate for washout via sludge wastage, and sustain the target MLSS and F/M ratio over time. Maintenance doses are lower in volume, applied at regular intervals, and adjusted based on the monitoring trends that emerge between doses.

A practical way to think about the distinction:

  • Startup scenario, higher dose volume, shorter dosing interval, daily MLSS and SVI monitoring, response assessment within the first 72 to 96 hours, dose adjustment based on observed ramp-up rate
  • Maintenance scenario, lower dose volume, weekly to monthly interval depending on plant stability, monitoring tied to routine operational checks, adjustments triggered by trend deviation rather than daily variation

Disclaimer: All parameter ranges and dosage figures referenced in this article are general indicative values intended for educational purposes. Actual bioculture dosage requirements vary significantly based on plant design, influent composition, temperature, HRT, SRT, and current biological health. Always conduct site-specific testing and consult a qualified process engineer before making dosage decisions.

Step 5, Monitor, Adjust, and Log

STP bacteria dosage is not a set-and-forget decision. Biological systems are dynamic. The organic load your plant receives today may not be what it receives in six weeks. Seasonal shifts, population changes, industrial discharge patterns, and temperature fluctuations all alter the biological demand on your system, and your dosage must track those changes.

After each dosing cycle, monitor MLSS, Sludge Volume Index (SVI), and effluent BOD and COD. These three metrics together tell you whether the biology is responding as expected. Rising SVI alongside stable or declining MLSS is a warning sign. Effluent quality that is not improving in proportion to your dosage suggests either a product quality issue or an environmental stressor that is suppressing biological activity.

Maintain a dosing log, dates, quantities, product batch, pre- and post-dose measurements, and any operational anomalies. Beyond helping you optimise your dosage protocol over time, this log is a critical asset during regulatory audits. A well-documented dosing record demonstrates biological process management competence to CPCB and SPCB inspectors in a way that verbal assurances simply cannot.

Common Dosage Mistakes That Lead to Compliance Failures

Common Dosage Mistakes That Lead to Compliance Failures

Even operators who understand the calculation framework can fall into patterns that undermine their results. These are the most consistently observed mistakes that contribute to effluent quality failures and regulatory non-compliance:

  • Dosing based on tank volume alone, without calculating actual organic load, this produces arbitrary numbers that have no biological basis
  • Applying a single fixed dose year-round despite significant seasonal variation in influent temperature, flow, and concentration
  • Skipping post-dose monitoring and assuming the bioculture is working without verifying effluent quality or MLSS response
  • Selecting bioculture products with unverified or inflated CFU claims, a product with poor viability delivers far less biology than the label suggests, even when dosed correctly
  • Failing to identify environmental stressors, chlorine carry-over, pH shock, or antibiotic contamination in the influent, that kill dosed bacteria before they can establish
  • Treating bioculture dosage as a one-time corrective action rather than an ongoing biological management practice integrated into routine operations

Each of these mistakes is correctable. But all of them become much less likely when the dosage process is grounded in structured monitoring and documented methodology.

Why Bioculture Quality Is as Important as Dosage Quantity

A precisely calculated dose of a poor-quality bioculture product delivers poor results. The dosage calculation framework described above assumes that the product you are dosing contains the viable microbial population it claims to contain. When that assumption fails, because the product was stored incorrectly, has passed its effective shelf life, or was formulated with inadequate strain diversity, the calculation breaks down at the last step regardless of how accurately the first four steps were executed.

When evaluating bioculture products for your STP, the quality markers that matter operationally are viable cell count expressed as CFU per unit, strain diversity appropriate to the treatment objective (BOD and COD degradation, nitrogen removal, or a combined profile), shelf life and storage requirements, and compatibility with your plant’s operating temperature and pH range.

Team One Biotech’s bioculture formulations are developed specifically for sewage treatment applications under Indian operating conditions, accounting for the influent characteristics, temperature ranges, and regulatory standards that define the compliance environment most operators in this market are working within. The technical specifications behind each product are designed to support accurate dosage calculations, not approximate them.

Talk to our process engineers to get a dosage recommendation tailored to your plant’s capacity and current MLSS levels. Contact Team One Biotech.

Frequently Asked Questions

How do I know if my STP is underdosed with bioculture?

Signs include rising effluent BOD and COD beyond discharge limits, poor sludge settling in the secondary clarifier, a thin and visually pale MLSS, persistent foam or odour from the aeration tank, and an SVI that is trending upward without a corresponding increase in organic load.

Can I add too much bioculture to an STP?

Yes. Excessive dosing upsets the F/M ratio by creating more biological mass than the available food substrate can support. The result is increased sludge production without proportional treatment improvement, higher sludge handling costs, and potential secondary effects on clarifier performance. More bioculture is not always better, calibrated bioculture is better.

How often should bioculture be dosed in an STP?

Dosing frequency depends on your operational phase. During startup or biological recovery, dosing intervals are short and monitoring is intensive. During steady-state maintenance operations, intervals typically range from weekly to monthly, but this must be determined based on your specific plant’s MLSS trends, organic loading patterns, and sludge wastage rate. There is no universal answer.

Disclaimer: Dosing frequency ranges referenced here are general indicative values. Actual intervals must be determined based on site-specific monitoring.

Does temperature affect bioculture dosage requirements?

Yes, significantly. Microbial metabolic activity is temperature-dependent. In colder months, or in plants operating in lower ambient temperature conditions, enzymatic reaction rates slow, microbial growth rates decline, and the biological system’s ability to process organic load at a given MLSS density is reduced. This typically requires higher or more frequent dosing during cold periods to maintain equivalent treatment performance.

What is the difference between seed culture and maintenance culture in an STP?

Seed culture establishes a new microbial population in a plant that has none, either during initial commissioning or after a biological crash. It requires a high-volume, high-frequency dosing protocol until the MLSS reaches a functional level. Maintenance culture sustains an already-established population during normal operations. The two products may be similar in microbial composition but differ significantly in required dosage volume and application frequency.

Conclusion, Dose Right, Stay Compliant

Getting STP bacteria dosage right is not guesswork, and it is not a fixed number on a product label. It is a structured, data-driven process grounded in four operational parameters, MLSS, F/M ratio, organic loading rate, and HRT, translated into a product quantity through your bioculture’s specified potency, and differentiated clearly between startup and maintenance scenarios.

Plants that manage bioculture dosage STP correctly through this kind of structured approach consistently outperform those that rely on intuition, historical habit, or generic rules of thumb. The biological system is stable. Effluent quality is predictable. Regulatory compliance with CPCB and SPCB discharge norms is far easier to maintain when your aeration tank biology is neither starved nor overwhelmed. The operators who get this right are not doing anything exotic, they are simply working with a proper calculation framework and monitoring their results.

BOD and COD reduction targets are achievable. MLSS in the healthy range is maintainable. The compliance record you want is within reach, but it requires treating bacterial dosage calculation for sewage treatment as the disciplined, ongoing biological management practice it is.

Team One Biotech offers both high-quality bioculture products formulated for Indian STP operating conditions and the technical support to help you calculate and implement the right dosage strategy for your specific plant.

Do not leave your STP’s compliance to chance. Reach out to Team One Biotech’s technical team today for a plant-specific bioculture dosage assessment, and keep your effluent consistently within discharge limits.

Looking to improve your ETP/STP efficiency with the right bioculture?
Talk to our experts at Team One Biotech for customised microbial solutions.

Contact: +91 8855050575

Email:  sales@teamonebiotech.com

Visit: www.teamonebiotech.com

Discover More on YouTube – Watch our latest insights & innovations!-

Connect with Us on LinkedIn – Stay updated with expert content & trends!
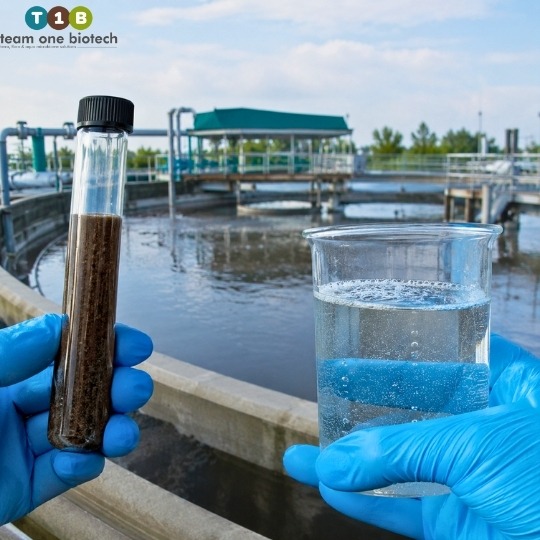
What Is STP Bacteria? A Complete Guide for Plant Operators

Every STP operator has faced this moment, the effluent looks off, BOD levels are climbing, and nobody can pinpoint why. You check the aerators, inspect the pumps, run through the mechanical checklist. Everything looks fine on paper. But the plant is not performing. More often than not, the answer is not mechanical. It is biological.

The invisible workforce running your sewage treatment plant is not steel and concrete, it is bacteria. Understanding what is STP bacteria, how these microorganisms function, and what keeps them healthy is the difference between a plant that consistently meets discharge norms and one that keeps you up at night. This guide covers everything a working operator needs to know: the types of bacteria active in your system, how they break down sewage, what makes them fail, and how to keep your microbial population in peak condition.

What Exactly Are STP Bacteria?

What Exactly Are STP Bacteria?

STP bacteria are microorganisms, primarily bacteria, but also fungi and protozoa, that are either naturally established or deliberately cultivated within a sewage treatment system to break down organic matter in wastewater. They are not contaminants. They are not a sign that something has gone wrong. They are the core biological engine of every functional sewage treatment plant in operation.

When a manufacturer like Team One Biotech supplies an STP bioculture product, what they are delivering is a concentrated, carefully selected blend of bacterial strains, organisms chosen for their ability to perform specific treatment functions efficiently and reliably. Think of it as seeding your plant with a purpose-built microbial workforce rather than waiting months for a natural population to develop on its own.

The term “sewage bacteria” often triggers the wrong association in operators who are newer to biological wastewater treatment. These organisms are not the dangerous pathogens you are trying to remove. They are beneficial, process-driving microbes that consume the very pollutants that pathogens feed on. Removing pathogenic organisms is largely a function of disinfection at the tail end of treatment. The bacteria we are discussing here are your allies at every stage before that.

Different treatment stages host fundamentally different bacterial communities, each adapted to local oxygen levels, organic load, and chemical environment. Understanding which bacteria belong where, and what each type does, is what separates an operator who reacts to problems from one who prevents them.

The Main Types of Bacteria Found in an STP

The Main Types of Bacteria Found in an STP

No single type of bacterium handles everything inside a sewage treatment plant. The system works because different microbial communities operate in sequence, each tackling a different fraction of the pollutant load. Here is what you need to know about each major group.

Aerobic Bacteria, The Primary BOD Destroyers

Aerobic bacteria are the workhorse organisms of biological wastewater treatment. They operate in oxygen-rich zones, primarily the aeration tank, and are responsible for breaking down the bulk of the carbonaceous biochemical oxygen demand (BOD) present in incoming sewage.

Key genera found in healthy aerobic zones include Pseudomonas, Bacillus, and Zoogloea, among others. These are not exhaustive categories, a mature aeration tank hosts hundreds of species, but these genera are commonly associated with strong BOD removal and stable floc formation. Floc formation is critical: aerobic bacteria aggregate into clusters that make sludge heavier and more settleable, which is what allows your secondary clarifier to function properly.

What aerobic bacteria need to thrive:

  • Adequate dissolved oxygen in the aeration zone (maintain within an appropriate operational range, see disclaimer below)
  • Sufficient organic substrate without overloading
  • Stable temperature and pH conditions
  • Absence of toxic inhibitors such as heavy metals or concentrated disinfectants

What happens when dissolved oxygen drops below adequate levels: aerobic populations crash, filamentous organisms proliferate, sludge bulks, and your clarifier performance deteriorates rapidly.

Disclaimer: The values indicated above are general reference ranges. Actual figures vary based on plant design, influent characteristics, organic load, temperature, and site-specific operational conditions.

If your aerobic zone is underperforming, a targeted aerobic bioculture can dramatically restore microbial density. Reach out to Team One Biotech’s technical team to understand which formulation suits your plant’s specific conditions.

Anaerobic Bacteria, The Deep Decomposers

Anaerobic bacteria thrive in the complete absence of oxygen and are most active in sludge digesters, septic zones, and the deeper layers of settled sludge. Their primary role is breaking down complex organic compounds, particularly the heavier, slower-degrading fraction of organic matter, into simpler end-products, including methane gas as a useful byproduct in plants equipped for biogas recovery.

In sludge digesters, anaerobic activity is responsible for a significant reduction in sludge volume, which directly reduces the cost and frequency of sludge disposal. In plants that recover biogas, well-functioning anaerobic digestion is also a source of energy.

Where operators need to be careful is in zones designed to be aerobic. If dissolved oxygen management fails and sections of your aeration tank go anaerobic, you will see it in odour complaints, typically hydrogen sulphide, and in deteriorating effluent quality. Anaerobic activity in the wrong zone is a signal to check your aeration system immediately.

What anaerobic bacteria require:

  • Complete absence of dissolved oxygen
  • Stable pH within a neutral to mildly alkaline range (add site-specific calibration, see disclaimer)
  • Adequate retention time in the digester
  • Absence of toxic compounds at inhibitory concentrations

Disclaimer: The values indicated above are general reference ranges. Actual figures vary based on plant design, influent characteristics, organic load, temperature, and site-specific operational conditions.

Facultative Bacteria, The Adaptable Operators

Facultative bacteria are the most operationally resilient category in your plant. These organisms can shift their metabolism depending on whether oxygen is available or not, functioning aerobically when dissolved oxygen is present and switching to anaerobic or fermentative pathways when it is not.

Their practical importance is often underestimated. In transition zones between aerobic and anoxic conditions, and during operational disturbances like power failures, aeration equipment breakdowns, or sudden organic load spikes, facultative bacteria are frequently what prevents a complete process collapse. They bridge the gap while conditions are re-established.

For operators managing plants with variable influent loads, frequent power interruptions, or older aeration infrastructure, understanding and protecting facultative populations is not a theoretical exercise. These organisms buy you time when your process is under stress.

Nitrifying Bacteria, The Compliance-Critical Microbes

If there is one category of STP bacteria that deserves the most careful operational attention, it is the nitrifying bacteria. These organisms are responsible for the conversion of ammoniacal nitrogen, ammonia and ammonium, into nitrate, a process called nitrification. Under tightening CPCB and SPCB discharge norms that regulate total nitrogen in treated effluent, nitrifier health is directly linked to your compliance status.

Nitrification is a two-stage biological process. The first stage is carried out by organisms like Nitrosomonas, which oxidise ammonia to nitrite. The second stage involves organisms like Nitrobacter, which convert nitrite to nitrate. Both genera are mentioned here as representative examples, not as an exhaustive classification.

What makes nitrifying bacteria uniquely vulnerable is their biology. They are slow-growing organisms, much slower than the heterotrophic aerobic bacteria responsible for BOD removal. This means that once a nitrifier population is damaged or lost, rebuilding it takes considerable time. They are also highly sensitive to operational stress:

  • pH swings outside a stable biological range will rapidly inhibit nitrifier activity
  • Temperature drops, particularly in winter months in northern India, significantly slow nitrification rates
  • Toxic shock events from industrial effluent, heavy metals, or disinfectant overdose can effectively eliminate nitrifier populations almost overnight
  • Insufficient sludge age (mean cell residence time) washes nitrifiers out of the system before they can reproduce and maintain population density

If your plant is showing ammonia breakthrough in final effluent, the nitrifiers are telling you something is wrong. Do not wait for your regulator to tell you first.

Nitrifier populations are the first casualty of operational stress. Team One Biotech’s nitrification bioculture is formulated to restore and sustain this critical microbial community in plants recovering from process upsets or establishing nitrification for the first time. Contact us to understand how targeted seeding can accelerate your compliance recovery.

Disclaimer: The values indicated above are general reference ranges. Actual figures vary based on plant design, influent characteristics, organic load, temperature, and site-specific operational conditions.

Denitrifying Bacteria, Closing the Nitrogen Loop

Denitrifying bacteria complete the nitrogen removal process that nitrifiers begin. Where nitrifiers convert ammonia into nitrate, denitrifiers convert nitrate into harmless nitrogen gas, which exits the system through the atmosphere. This is the only biological pathway that actually removes nitrogen from the effluent rather than converting it from one form to another.

Denitrifiers are anoxic-zone organisms. They require nitrate as their electron acceptor but cannot tolerate free dissolved oxygen, which means they are typically active in dedicated anoxic zones positioned upstream of the aeration tank in more sophisticated STP configurations.

What denitrifying bacteria need:

  • Absence of free dissolved oxygen in the anoxic zone
  • Adequate nitrate supply, typically recycled from the aerobic zone
  • A carbon source for their metabolic activity (often provided by the incoming wastewater itself)
  • Sufficient hydraulic retention time in the anoxic zone

Operators who underestimate the importance of denitrification increasingly find themselves on the wrong side of nitrogen discharge limits. As CPCB norms evolve and more plants fall under stricter nutrient removal requirements, denitrification is shifting from an optional upgrade to a compliance necessity.

How Do STP Bacteria Actually Break Down Sewage?

How Do STP Bacteria Actually Break Down Sewage?

The biological treatment process is not a single event, it is a continuous, dynamic series of microbial interactions happening simultaneously throughout your plant. Here is what actually occurs when bacteria go to work on incoming sewage.

When wastewater enters the biological treatment zone, bacteria colonise organic particles and suspended solids immediately. They secrete extracellular enzymes that break complex organic molecules into simpler compounds that can be absorbed across bacterial cell membranes. Inside the cell, these compounds are metabolised through aerobic or anaerobic respiration, depending on the organism and the available oxygen, producing energy for growth and reproduction, with carbon dioxide, water, and stable biological solids as end-products.

This is what BOD removal actually looks like at the microbial level: bacteria consuming dissolved and suspended organic matter and converting it into their own biomass and stable by-products that either escape as gas or settle as sludge.

Two operational parameters that every plant operator encounters daily reflect the health of this biological process. Mixed Liquor Suspended Solids (MLSS) measures the concentration of biological solids, active bacteria and associated organic matter, in your aeration tank. Maintaining MLSS within an appropriate operational range is essential for adequate treatment capacity. Sludge Volume Index (SVI) reflects how well your sludge settles: healthy aerobic floc settles compactly, giving a low SVI, while bulking sludge, often a sign of filamentous bacteria dominating the population, gives a high SVI and poor clarifier performance.

The critical operational insight is this: your STP is a living system. Unlike a pump or a clarifier, it cannot be repaired by replacing a part. It responds to conditions, oxygen, temperature, pH, toxic load, retention time, and the microorganisms inside it either thrive or deteriorate based on how well those conditions are managed. That is why operators who understand the biology consistently outperform those who only understand the equipment.

Disclaimer: The values indicated above are general reference ranges. Actual figures vary based on plant design, influent characteristics, organic load, temperature, and site-specific operational conditions.

Why Bacterial Health Directly Determines Your Compliance Outcome

Why Bacterial Health Directly Determines Your Compliance Outcome

Every discharge norm that your plant is measured against, BOD in final effluent, total suspended solids, ammoniacal nitrogen, total nitrogen, is ultimately a measure of how well your bacterial populations are doing their job. The connection between microbial health and regulatory compliance is not indirect. It is direct, causal, and measurable on every monitoring report you submit.

BOD reduction is primarily the work of aerobic heterotrophic bacteria in your aeration tank. If that population is stressed, underfed, over-loaded, or oxygen-deprived, your effluent BOD climbs. TSS removal depends on floc-forming bacteria that produce settleable biomass. If they are outcompeted by filamentous organisms, your clarifier overflows with suspended solids. Nitrogen removal, as detailed above, depends entirely on the health of nitrifying and denitrifying bacterial communities that are slow to recover once damaged.

The signals that your microbial population is in distress are identifiable before your effluent test results confirm it:

  • Rising effluent BOD that does not respond to increased aeration
  • Bulking sludge or persistently poor settlement in the secondary clarifier
  • Excessive or persistent foaming in the aeration tank
  • Ammonia breakthrough appearing in final effluent samples
  • Persistent foul odour from zones that should be aerobic

Each of these is a biological symptom, not a mechanical one. Treating them as mechanical problems, adjusting pumps, increasing aeration blindly, dosing chemicals, without addressing the underlying microbial health will produce temporary improvements at best.

Is your STP consistently meeting CPCB discharge norms? If the answer is no, or even sometimes, the root cause is almost always biological. Get in touch with Team One Biotech for a technical process assessment, we work with plant operators to identify what the microbiology is telling them before compliance becomes a crisis.

How to Maintain a Healthy STP Microbial Population

Maintaining microbial health is a daily operational discipline, not a one-time intervention. Here are the key parameters and practices that determine whether your bacterial population thrives or deteriorates.

Dissolved Oxygen Management

Maintain dissolved oxygen in your aeration zone within an appropriate operational range for aerobic treatment. Too low and aerobic bacteria are starved; too high and you are wasting energy while potentially disrupting the anoxic zones needed for denitrification. Monitor DO continuously rather than on fixed schedules.

Disclaimer: The values indicated above are general reference ranges. Actual figures vary based on plant design, influent characteristics, organic load, temperature, and site-specific operational conditions.

pH Control

Biological activity in your STP depends on maintaining pH within a range that supports both heterotrophic and nitrifying bacteria. Nitrifiers in particular are sensitive to pH excursions. Monitor influent pH carefully, especially if your plant receives any industrial contribution, and dose neutralising agents proactively rather than reactively.

Avoiding Toxic Shocks

Industrial effluent containing heavy metals, strong acids or alkalis, solvents, or concentrated disinfectants can devastate microbial populations with little warning. If your plant receives combined municipal and industrial inflow, establish clear pre-treatment requirements at source and monitor for unusual influent characteristics. A single toxic shock event can set back biological recovery by weeks.

Sludge Age Management

Maintaining an appropriate mean cell residence time (sludge age) is essential, particularly for retaining slow-growing nitrifiers. Too short a sludge age washes these organisms out of the system faster than they can reproduce. Too long and you accumulate excess biomass that strains your sludge handling infrastructure. Find the operational range appropriate for your plant configuration and influent load.

Bioaugmentation During Startup and Recovery

When commissioning a new plant, restarting after a shutdown, or recovering from a process failure, seeding your system with a high-quality STP microbial culture dramatically reduces the time needed to establish an active, balanced biological population. Rather than waiting for indigenous bacteria to colonise and multiply over weeks, a commercial STP bioculture delivers a concentrated, proven microbial community ready to perform from day one.

Regular Monitoring

Track MLSS, SVI, dissolved oxygen, influent and effluent BOD, and ammoniacal nitrogen consistently. These parameters tell you the biological story of your plant. Gaps in monitoring are gaps in your early warning system.

Frequently Asked Questions About STP Bacteria

Q1: What is STP bioculture and how is it different from naturally occurring sewage bacteria?

STP bioculture refers to a concentrated, commercially prepared blend of selected bacterial strains that are specifically chosen for their ability to perform treatment functions, BOD removal, nitrification, sludge reduction, reliably and efficiently. Naturally occurring sewage bacteria develop through environmental colonisation over time, often including a wide range of organisms that are not particularly suited to treatment performance. A commercial bioculture gives you a defined, high-density starting population that reduces startup time and improves process stability.

Q2: How long does it take for STP bacteria to establish after a plant startup?

Startup periods vary considerably based on organic load, temperature, seeding method, and plant configuration. Natural colonisation without bioaugmentation can take several weeks to months before stable biological treatment is achieved. With commercial STP bioculture seeding, this period can be reduced substantially, though the exact timeline depends on site-specific conditions.

Disclaimer: The values indicated above are general reference ranges. Actual figures vary based on plant design, influent characteristics, organic load, temperature, and site-specific operational conditions.

Q3: Can STP bacteria survive toxic shocks from industrial effluent?

Toxic shocks, from heavy metals, strong disinfectants, or sudden pH swings, can severely reduce or effectively eliminate active bacterial populations, particularly nitrifiers. Resilience depends on the concentration and duration of the toxic exposure, as well as the overall health and density of the microbial population beforehand. Prevention through influent monitoring and pre-treatment is far more effective than post-shock recovery.

Q4: What are signs that bacterial activity in my STP has dropped?

Rising effluent BOD, poor sludge settleability resulting in high SVI, increased foaming in the aeration tank, and ammonia breakthrough in final effluent are the clearest operational indicators. Persistent foul odour from aerobic zones is another sign worth investigating immediately.

Q5: Is it safe to add commercial microbial cultures to an STP?

Yes. High-quality STP microbial cultures are formulated from non-pathogenic, GRAS-classified bacterial strains that are safe for operators, the surrounding environment, and receiving water bodies. Team One Biotech’s bioculture products are formulated to meet these safety standards and are intended for use in municipal and commercial STPs by trained operators.

Your STP Runs on Biology, Not Just Equipment

Every mechanical system in your sewage treatment plant exists to create the right conditions for one thing: microbial activity. The aerators feed oxygen to bacteria. The clarifiers settle bacterial biomass. The sludge digesters give anaerobic organisms time to work. Strip the biology out of the equation and what remains is expensive infrastructure that treats nothing.

Understanding what is STP bacteria, what types exist, what each one does, and what conditions each one needs, is foundational knowledge for anyone responsible for plant performance. Aerobic bacteria drive BOD removal and floc formation. Anaerobic bacteria reduce sludge and recover energy. Facultative bacteria provide process resilience during operational stress. Nitrifying and denitrifying bacteria determine whether your plant meets nitrogen discharge norms under CPCB and SPCB regulations. All of these microbial communities are interdependent, and all of them respond, positively or negatively, to how you manage your plant every single day.

Maintaining a healthy STP microbial culture is not a luxury or an add-on. It is the core operational task of biological wastewater treatment. When that culture is healthy, your plant performs. When it is compromised, no amount of mechanical adjustment or chemical dosing will fully compensate.

If you are looking to optimise your STP’s biological performance, reduce compliance risk, or recover from a process failure, Team One Biotech’s range of STP bioculture solutions is engineered for exactly that. Get in touch with our technical team today, because your plant deserves biology that works.

Looking to improve your ETP/STP efficiency with the right bioculture?
Talk to our experts at Team One Biotech for customised microbial solutions.

Contact: +91 8855050575

Email:  sales@teamonebiotech.com

Visit: www.teamonebiotech.com

Discover More on YouTube – Watch our latest insights & innovations!-

Connect with Us on LinkedIn – Stay updated with expert content & trends!
Powder vs Liquid Bioculture: Which Performs Better in an STP?

There is a particular kind of dread that settles in when a discharge report comes back non-compliant. The calls start, the paperwork stacks up, and somewhere in the middle of it all, someone asks the question that should have been asked earlier: did biology fail us, or did we fail biology?

For STP operators, plant superintendents, and biological process engineers working under the constant watch of CPCB and SPCB discharge standards, biological performance is not an abstract concern. It is a daily operational reality. BOD, COD, and suspended solids limits do not wait for your biomass to recover from a rough week. And when something goes wrong with the microbial community in your aeration tank, every hour of delay carries a compliance cost.

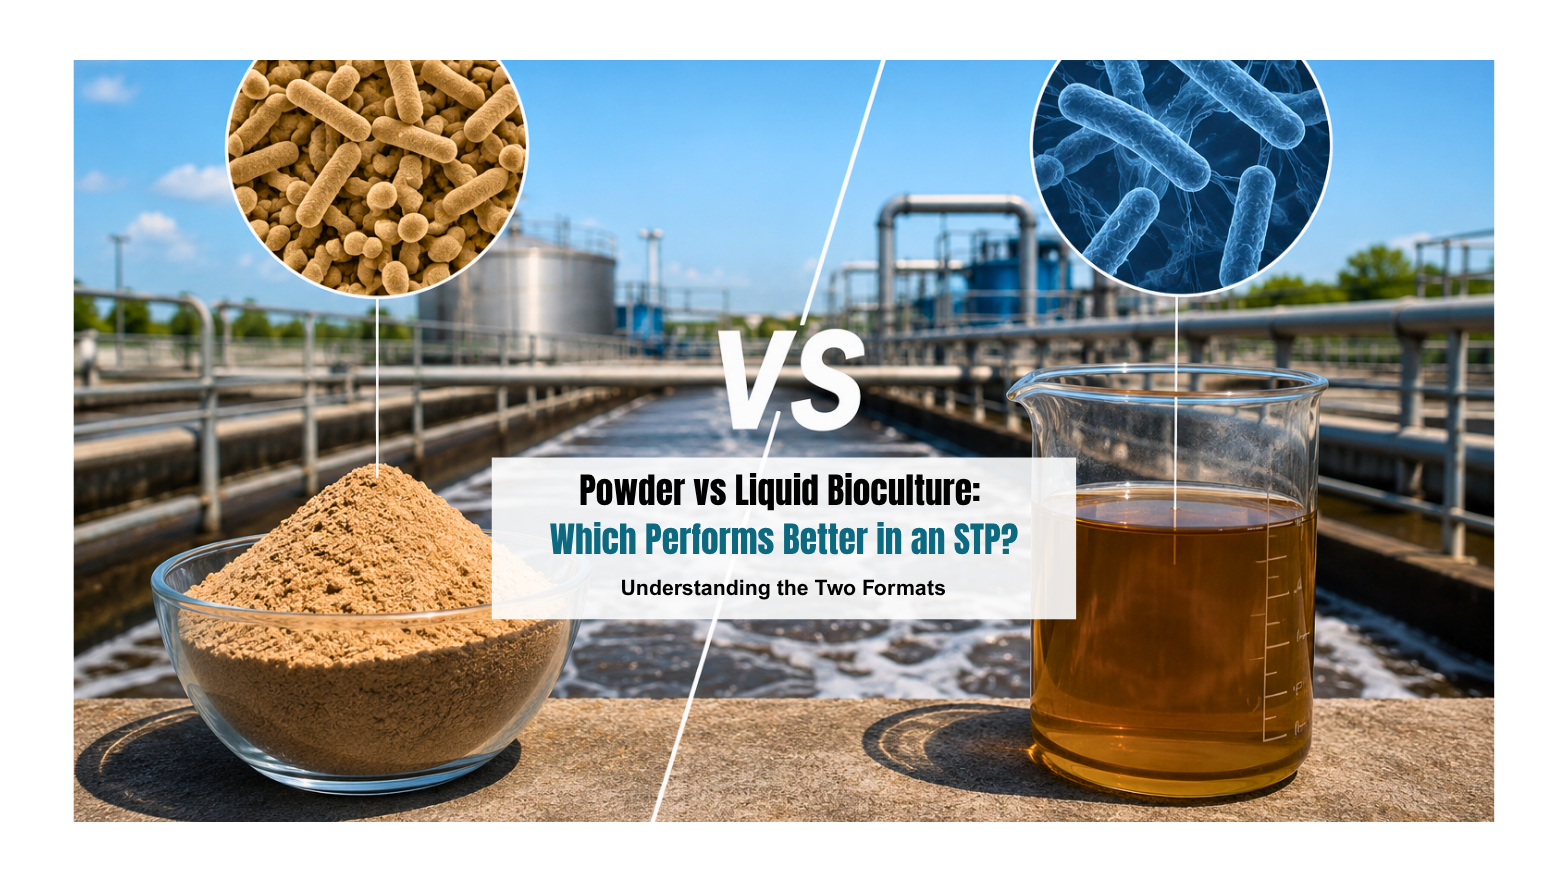
One of the decisions that sits quietly beneath this pressure, often made once and rarely revisited, is the choice of bioculture format. Specifically, the powder vs liquid bioculture question. Both are used in biological sewage treatment, but across the diverse operational landscape of Indian STPs, powder bioculture has emerged as the format that works reliably across a broader range of real-world conditions. This article explains why, while giving liquid bioculture its fair assessment where it genuinely earns it.

Understanding the Two Formats: What You Are Actually Buying

Understanding the Two Formats: What You Are Actually Buying

Before comparing, it helps to understand what each format fundamentally is and how it behaves from the moment it leaves the manufacturer’s facility to the moment it enters your aeration tank.

What Is Powder Bioculture?

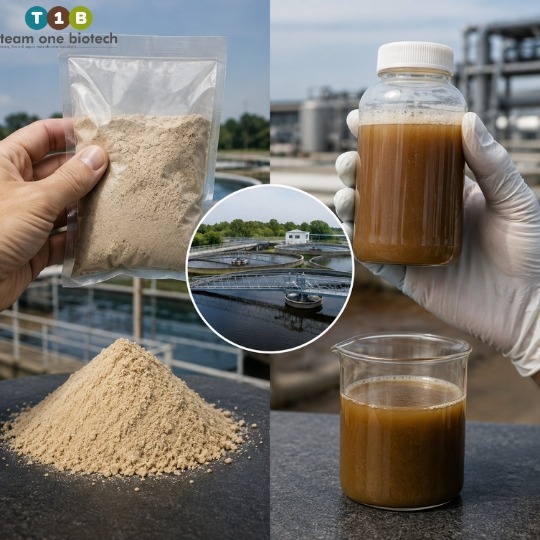
Powder bioculture is a dry, shelf-stable microbial formulation. The organisms within it have been processed, typically through spray-drying or lyophilisation, into a dormant or spore-based state. This processing is not just a preservation technique. It is an engineering decision that gives powder bioculture a resilience that liquid formats cannot match across varied storage environments, transport conditions, and procurement timelines.

When you open a bag of powder bioculture, you are handling dormant organisms that need to be rehydrated and activated before they begin working in your system. That activation step, done correctly in clean, dechlorinated water at the right temperature, is straightforward and well within the capability of any competent STP operator. The lag between dosing and observable biological activity is a known, manageable variable, not a hidden risk.

What makes powder bioculture particularly well-suited to Indian STP conditions is its stability. From a municipal plant in the hills of Uttarakhand to a housing society STP on the outskirts of Chennai, powder bioculture can be transported without refrigeration, stored without cold infrastructure, and drawn from inventory months after procurement without meaningful loss of viability. That kind of operational flexibility is not a minor benefit. For the majority of STP facilities operating across this country, it is the difference between a dependable biological tool and one that requires constant management.

What Is Liquid Bioculture?

Liquid bioculture is a suspension of live or semi-active microorganisms in a liquid medium. The organisms have not been placed into dormancy, which means they are already metabolically active or close to it at the time of dosing. This gives liquid bioculture a faster integration time into your biological system, and in time-critical scenarios like post-upset recovery, that speed can matter.

The trade-off is significant, however. Live organisms are sensitive organisms. Liquid biocultures require refrigerated storage throughout their usable life, from the manufacturer’s facility through transit and right to your dosing point. Any gap in that cold chain, a delay at a transshipment point, a power cut in your storage room, an unusually warm transit vehicle, can degrade viability in ways that are not always visible on inspection. By the time a liquid product is introduced into your aeration tank, you may be working with a meaningfully reduced effective microbial count without knowing it.

For plants with reliable cold infrastructure and frequent, predictable procurement, liquid bioculture is a workable option. For the broader population of Indian STPs, particularly those in Tier 2 and Tier 3 cities or peri-urban locations where cold-chain reliability cannot be assumed, the format carries a structural vulnerability that operators should weigh carefully.

Head-to-Head Comparison: The Four Parameters That Matter Most

Head-to-Head Comparison: The Four Parameters That Matter Most

1. Shelf Life and Storage Stability

This is where powder bioculture’s advantage is most clear-cut and most practically significant.

Powder bioculture, depending on the formulation, can remain viable at ambient temperatures for several months to well over a year. It does not require refrigeration. It tolerates the temperature variation that is an everyday reality of Indian logistics and storage environments. Bulk procurement is straightforward: you procure, you store, you dose on schedule without worrying about what happened to the product between the manufacturer’s warehouse and your dosing point.

Liquid bioculture’s usable shelf life is measured in weeks to a few months, and that shelf life is conditional on maintained refrigeration at every stage. Procurement must be more frequent, cold storage must be reliable, and the margin for error in handling is narrower. Every procurement cycle is an opportunity for a cold-chain failure to compromise the product before it reaches your system.

For most STP operators managing real-world logistics, this distinction alone is a strong argument for powder bioculture as the default format.

2. Activation Time and Lag Before Performance

Powder bioculture requires a pre-activation step. The organisms need to be rehydrated and given time to transition from dormancy to metabolic activity before they are introduced into your aeration tank. Depending on the strains, the system temperature, and the organic loading at the time of dosing, this lag can range from several hours to a couple of days.

This is the parameter where liquid bioculture holds a genuine, legitimate advantage. Because the organisms are already active, liquid bioculture integrates into the biological system faster, and in acute emergency scenarios, that speed can translate to a measurably faster recovery curve.

However, it is worth putting this in operational context. The majority of bioculture dosing in a well-run STP is not emergency dosing. It is routine biological supplementation, scheduled seeding, planned system maintenance, and proactive biomass support. In all of these scenarios, the activation lag of powder bioculture is a predictable, manageable variable that experienced operators factor into their dosing schedule without difficulty. The lag only becomes a liability when a plant is in crisis mode, and the response to a biological crisis should not rest primarily on bioculture format. It should rest on early warning indicators, robust monitoring, and proactive biomass management that prevents the crisis from developing in the first place.

Powder bioculture’s slightly longer path to activation is a fair trade for its substantially superior storage reliability, procurement flexibility, and resistance to handling variability.

3. Bacterial Concentration and Effective Dosing

This is the area where the most misleading comparisons tend to circulate, and it deserves a careful look.

Powder biocultures are presented with CFU-per-gram figures that can look impressive on a datasheet. The organism that matters to your STP, however, is not the one on the label. It is the viable, metabolically active organism that successfully arrives in your aeration tank after activation, at a concentration sufficient to compete, establish, and perform in your mixed liquor. Recovery rate from dormancy is the variable that closes the gap between the label claim and the operational reality, and it is influenced by activation conditions, water quality, temperature, and how the product was handled prior to use.

Liquid bioculture delivers organisms that are already active, and the label concentration more directly represents what reaches your system, assuming the cold chain held and the product is well within its shelf life.

The practical implication is this: for powder bioculture, reliable performance is achieved when the activation protocol is followed correctly and consistently. For liquid bioculture, reliable performance is achieved when the cold chain is maintained correctly and consistently. The difference is that getting an activation protocol right is operationally simpler and more controllable for most STP teams than guaranteeing cold-chain integrity across an entire procurement and delivery cycle in Indian conditions.

When powder bioculture is handled correctly, the effective delivery to your system is predictable and reliable. That predictability is operationally valuable.

4. Cost-Efficiency Over the Long Term

The honest cost picture strongly favours powder bioculture for the majority of STP operations.

Powder bioculture generally carries a lower per-unit cost. Its extended shelf life means that bulk procurement is commercially advantageous and logistically practical, and the risk of product wastage due to expiry or mishandling is lower. There is no cold storage infrastructure to invest in or maintain, no running refrigeration cost, and no cold-chain management burden on your procurement team.

Liquid bioculture may offer a faster biological response in specific scenarios, and proponents argue that this can reduce total dosing volume in those scenarios, partially offsetting a higher per-dose cost. That argument has some merit in the right conditions. But when you account for the full cost picture, including refrigeration infrastructure, more frequent procurement cycles, greater wastage risk from cold-chain failures, and the higher per-unit price, liquid bioculture’s total cost of ownership is meaningfully higher for most plants.

The compliance cost perspective reinforces this. A non-compliance event carries costs that dwarf the price difference between formats. A powder bioculture that is correctly stored, correctly activated, and correctly dosed provides consistent, reliable biological support at a lower total cost, and consistent biological support is precisely what prevents compliance events.

What Does Compliance Demand of Your Bioculture?

What Does Compliance Demand of Your Bioculture?

CPCB and SPCB discharge standards require consistent, reliable reduction of BOD, COD, and suspended solids to within prescribed limits, not occasionally, not only when conditions are ideal, but discharge after discharge, across seasonal variation and influent fluctuation.

What this means in practice is that your bioculture choice must deliver biological stability across your plant’s actual operating conditions, not just its ideal ones. Powder bioculture’s resilience to storage variability, its procurement flexibility, and its lower sensitivity to handling conditions make it the more reliable foundation for that kind of consistent biological performance across a wide range of Indian STP environments.

Biological consistency is the compliance requirement. Powder bioculture, for most plants, is the more reliable path to achieving it.

So, Which Format Actually Performs Better?

So, Which Format Actually Performs Better?

For the majority of STPs operating in India, powder bioculture is the more practical, more reliable, and more cost-effective choice. Its shelf life advantage, storage flexibility, procurement simplicity, and lower total cost of ownership align well with the operational realities that most plant operators actually face.

Liquid bioculture has a real and legitimate place in specific scenarios: acute biological recovery situations where time is critical, plants with fully reliable cold-chain infrastructure and frequent procurement capability, and high-load systems where the speed-to-performance advantage justifies the additional handling requirements. In those conditions, it is a credible and effective tool.

But for routine biological supplementation, scheduled seeding, planned system maintenance, and general biomass support across a broad range of operating environments, powder bioculture is the format that delivers reliable performance without the logistical complexity.

Consider powder bioculture your primary format if:

Your plant is in a location where cold storage reliability cannot be fully guaranteed. You procure in advance and need inventory to remain viable over weeks or months. Your dosing schedule is planned and regular rather than crisis-driven. Cost efficiency across the full procurement and storage cycle is a meaningful factor in your decisions. You want a format that your operations team can handle correctly without specialised cold-chain management.

Consider liquid bioculture if:

You are responding to an acute biological upset where time-to-performance is critical and cold-chain capability at your facility is fully reliable. Your plant operates under consistently high organic loading and your procurement cycle is frequent and dependable. You have the infrastructure and operational discipline to maintain cold-chain integrity from procurement through dosing without exception.

The right bioculture is the one correctly matched to your plant’s actual conditions. For most plants, that match points clearly to powder.

Frequently Asked Questions

Can I switch between powder and liquid bioculture mid-operation in my STP?

Switching formats mid-operation is possible but should be managed carefully with guidance from your supplier. A controlled transition with appropriate biological parameter monitoring is recommended to avoid disrupting your established microbial community.

Does powder bioculture need to be pre-mixed before dosing into the STP?

Yes. Rehydration and pre-activation in clean, dechlorinated water for the period specified by your supplier is a required step, not an optional one. Skipping or shortening it will reduce the effective viable count reaching your aeration tank.

How do I know if my bioculture is still viable before dosing?

Check manufacturing and expiry dates. Confirm that storage conditions have been correctly maintained. When in doubt, conduct a jar test using your plant’s mixed liquor and influent, and consult your supplier before committing a full dose.

Which format is better for a newly commissioned STP during initial seeding?

Both are used effectively for initial seeding. Powder bioculture with a well-structured pre-activation and ramp-up protocol is a reliable, cost-effective approach for most new plant commissionings. Liquid bioculture may offer a marginally faster startup trajectory where timeline pressure is acute and cold-chain management is fully in place.

Does the choice of bioculture format affect CPCB compliance outcomes?

Indirectly, yes. A format that does not perform consistently under your specific storage and operational conditions creates biological instability risk, which in turn creates compliance risk. Powder bioculture’s greater resilience to storage and handling variability makes it the lower-risk format for most Indian STP operations.

Make the Decision That Serves Your Biology and Your Operations

Powder bioculture is not the right answer for every plant in every scenario. But it is the right answer for most plants across most scenarios that Indian STP operators actually face. Its shelf life, storage flexibility, cost efficiency, and resistance to handling variability give it a structural advantage that is difficult to match in the real-world operating environment of most facilities.

Team One Biotech manufactures both powder and liquid bioremediation solutions engineered specifically for Indian STP conditions and influent characteristics. Reach out to our technical team today to evaluate the right format for your plant, before your next compliance audit does it for you.

Looking to improve your ETP/STP efficiency with the right bioculture?
Talk to our experts at Team One Biotech for customised microbial solutions.

Contact: +91 8855050575

Email:  sales@teamonebiotech.com

Visit: www.teamonebiotech.com

Discover More on YouTube – Watch our latest insights & innovations!-

Connect with Us on LinkedIn – Stay updated with expert content & trends!
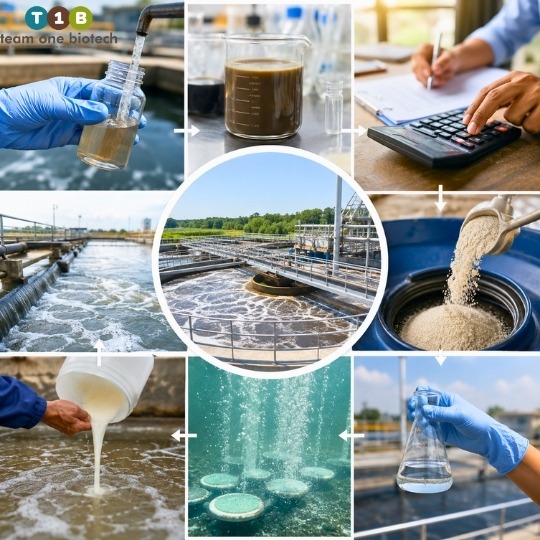
Quorum Sensing in Bacteria: What It Means for Biofilm in Your Treatment Plant

If your secondary clarifier has been acting up, your membranes are clogging faster than usual, or your effluent quality keeps slipping despite doing everything right, the problem may not be in your dosing chart. It may be in how your bacteria are talking to each other.

Most operators spend their shift monitoring dissolved oxygen, MLSS, sludge volume index, and HRT. These are the right things to watch. But there is a layer of biological activity happening beneath all of those parameters that almost no one monitors, and it is directly responsible for some of the most stubborn operational problems in biological treatment systems.

Bacteria in your plant are not passive organisms waiting to be managed. They are active, communicating, and making collective decisions based on what they sense around them. They coordinate biofilm formation, regulate metabolic activity, and respond to environmental stress in ways that are far more sophisticated than most process models account for. Understanding quorum sensing in bacteria is the starting point for understanding why your plant behaves the way it does, and why some problems refuse to go away no matter how well you operate your conventional parameters.

This is not a laboratory concept. Quorum sensing is happening right now in your activated sludge tank, your clarifier, your membrane modules, and your return sludge lines. The operators who understand it will be better positioned to manage their plants proactively rather than reacting to the symptoms after the damage is done.

What Is Quorum Sensing? Definition and Core Concept

What Is Quorum Sensing? Definition and Core Concept

Quorum sensing is the mechanism by which bacteria monitor their own population density and coordinate group behavior in response to it. The term was coined to describe what researchers observed: bacteria behave differently alone than they do in a crowd, and they always seem to know which situation they are in.

The quorum sensing definition, stripped of academic language, is this: bacteria communicate with each other using chemical signal molecules, and when enough of those signals accumulate to cross a threshold, the entire population switches on a new set of behaviors simultaneously.

The chemical signals responsible for this are called autoinducers. Each bacterial cell continuously produces and releases small amounts of these molecules into its surrounding environment. As the bacterial population grows, the concentration of autoinducers in the local environment increases proportionally. Individual cells are constantly sampling that concentration. When it crosses a critical threshold, it tells each cell that the population has reached a sufficient density, a quorum, and that it is time to act collectively.

This is the quorum sensing meaning in operational terms: a population-level decision made through chemical consensus, not through any central coordination.

The three-stage process works as follows:

  • Signal release, Individual bacterial cells produce and secrete autoinducer molecules at low, continuous rates throughout their lifecycle
  • Signal accumulation, As population density increases, autoinducer concentration in the surrounding environment rises in proportion; each cell is simultaneously detecting and contributing to this signal
  • Collective gene expression, Once the autoinducer concentration crosses a threshold specific to that microbial community, bacteria collectively activate gene clusters that change their behavior, including the genes responsible for biofilm formation

One important note: these thresholds vary widely depending on microbial community composition, temperature, organic load, and environmental conditions, values in your plant may differ significantly from anything published in research literature.

How Quorum Sensing Drives Biofilm Formation in Bacteria

How Quorum Sensing Drives Biofilm Formation in Bacteria

This is where science connects directly to what you see on the plant floor.

When quorum sensing signals reach their threshold, one of the most significant downstream consequences is the activation of genes that produce the EPS matrix, the exopolysaccharide matrix that forms the physical scaffold of a biofilm. This sticky, gel-like structure is what transforms a collection of free-swimming individual bacteria into an organized, surface-attached community that is structurally and functionally very different from what your aeration models and BOD calculations were designed around.

From Free-Swimming to Firmly Attached, The Transition That Changes Everything

Bacteria in biological treatment systems exist in two primary states: planktonic and sessile. Planktonic bacteria are free-swimming, dispersed throughout the bulk liquid, and are the form that most wastewater process models are built around. They respond to shear forces, are relatively accessible to dissolved oxygen and nutrients, and can be managed through conventional means like aeration, mixing, and chemical addition.

Sessile bacteria are the opposite. They are surface-attached, embedded in the EPS matrix, and operating under a fundamentally different set of conditions. The transition from planktonic to sessile is not random, it is triggered and coordinated by quorum sensing signals.

Once the autoinducer threshold is reached, QS signals switch on the genetic machinery for EPS production. The bacteria begin secreting the components of the matrix, attaching to available surfaces, membrane fibres, pipe walls, carrier media, clarifier internals, and recruiting additional cells into the growing structure. What begins as a thin conditioning layer on a surface progresses, over a range of hours to days depending on conditions, into a structured, multi-layered biofilm.

What a Mature Biofilm Looks Like Inside Your Treatment System

A mature biofilm is not simply a layer of bacteria stuck to a surface. It is a structured, differentiated community with a complex internal architecture that gives it properties very different from the same bacteria in planktonic form.

The outer layers of a mature biofilm remain metabolically active and in contact with the bulk liquid. Deeper layers experience steep diffusion gradients, dissolved oxygen, nutrients, and even chemical agents penetrate into the biofilm at progressively lower concentrations the further they travel from the surface. The innermost cells may be operating under near-anaerobic conditions even when bulk liquid DO readings appear adequate.

This architecture has two major consequences for your operation. First, the cells in the protected inner core are effectively shielded from both shear forces and conventional disinfectants. The EPS matrix blocks penetration, and even where penetration occurs, the outer cells are sacrificed while the inner community survives. Second, the metabolic activity of these sessile cells is fundamentally different from planktonic bacteria, their oxygen demand, nutrient uptake, and reaction rates do not match the assumptions built into standard BOD and COD models.

Periodically, sections of the mature biofilm will detach, a process also regulated, in part, by quorum sensing signals, and enter the bulk liquid as large aggregates. These detachment events are a key source of operational instability.

Beneficial vs. Problematic Biofilm, Two Sides of the Same Signal

Here is where the nuance matters, and where many discussions of biofilm get it wrong.

Biofilm is not inherently a problem. In fact, in a significant proportion of modern biological treatment systems, biofilm is the entire point. Fixed-film systems, moving bed biofilm reactors (MBBR), integrated fixed-film activated sludge (IFAS) systems, trickling filters, rotating biological contactors, are designed around the deliberate cultivation of biofilm on carrier media. In these systems, the dense, metabolically active biofilm community is what delivers the treatment performance. QS-driven biofilm formation is the mechanism that makes these systems work.

The problem is not biofilm itself. The problem is uncontrolled biofilm in locations where it does not belong, or biofilm that has overgrown to a point where it disrupts the process it is supposed to support.

In secondary clarifiers, biofilm growth on internal surfaces and weirs creates attachment points for sludge accumulation and introduces turbulence that disrupts settling. Detachment events from these surfaces cause sudden TSS spikes in clarifier effluent. In membrane bioreactor systems, biofilm formation on membrane fibres, driven by the same quorum sensing signals that are doing useful work in your MBBR, is the primary mechanism of biofouling. As the biofilm layer develops on membrane surfaces, it increases resistance to flow, driving up transmembrane pressure (TMP) and reducing filtration capacity. In return sludge and mixed liquor lines, unchecked biofilm can progressively restrict flow and alter the hydraulic behavior of the system in ways that are difficult to diagnose from surface-level monitoring.

The same bacterial communication mechanism that runs your biofilm reactor can, if left unmanaged, destroy your membrane integrity and destabilize your clarifier performance.

Understanding which biofilm you are cultivating, and which one is working against you, is the first step toward intelligent biofilm management. If you are unsure how your plant’s microbial community is behaving, our team at Team One Biotech can help you assess it.

Quorum Sensing in Wastewater Biofilm, What It Means for Compliance

Quorum Sensing in Wastewater Biofilm, What It Means for Compliance

The connection between quorum sensing in wastewater biofilm and regulatory compliance is direct, and it runs through several distinct pathways.

When biofilm grows unchecked on membrane surfaces in MBR systems, the result is a progressive increase in transmembrane pressure. As TMP rises, permeate flux drops, and the system requires more energy and more frequent chemical cleaning cycles to maintain output. Eventually, if the biofouling is severe enough, membrane integrity is compromised and effluent quality deteriorates. This is not a slow or theoretical risk, it is one of the most common causes of MBR underperformance in industrial and municipal applications.

In secondary clarifiers, biofilm detachment events introduce sudden, unpredictable loads of suspended solids into the effluent stream. These TSS spikes are among the most common causes of discharge compliance failures under CPCB and SPCB norms, and they are particularly frustrating because they occur without any obvious change in influent load or process parameters. The process looks stable right up until the clarifier effluent quality drops.

There is also a subtler compliance risk that receives less attention. Sessile bacteria in mature biofilm communities are metabolically different from the planktonic bacteria that BOD and COD process models are designed around. Their oxygen uptake rates, substrate utilization patterns, and response times differ from what standard models predict. When a significant portion of your active biomass is operating in sessile form, particularly in systems with uncontrolled biofilm growth on surfaces, your actual treatment performance may diverge from your process model in ways that are difficult to diagnose without understanding the microbial ecology involved.

Key compliance risks associated with uncontrolled QS-driven biofilm include:

  • Effluent TSS exceedances caused by biofilm detachment events in secondary clarifiers and pipe systems
  • Degraded effluent quality in MBR systems resulting from progressive membrane biofouling and increased TMP
  • Inconsistent BOD and COD removal performance when sessile bacteria dominate active biomass fractions
  • Elevated chemical oxygen demand in effluent during high-detachment periods, particularly following process disturbances or cleaning events

Disclaimer: The operational impacts described above are indicative and based on general biofilm behavior in biological treatment systems. Actual impacts on effluent quality, membrane performance, and compliance parameters will vary depending on your plant’s configuration, microbial community, influent characteristics, and operating conditions. Always conduct site-specific assessments before drawing conclusions or making process changes.

Can You Interrupt Quorum Sensing? Emerging Control Strategies

The recognition that quorum sensing drives biofilm formation has opened a new category of intervention strategies that go beyond conventional chemical biocide approaches, and understanding why that distinction matters is important for anyone responsible for managing a biological treatment system.

Conventional chemical biocides act on bacteria that are already present, and their effectiveness against mature biofilm is limited for a reason that is structural, not chemical. The EPS matrix that forms the scaffold of a mature biofilm physically blocks penetration of disinfectants and biocides. The outer cell layers are killed or inhibited, but the inner core of the biofilm community, protected by the matrix and operating in a state of reduced metabolic activity, survives. The biofilm recovers, and the problem returns.

A more fundamentally targeted approach is quorum quenching (QQ), the disruption of bacterial communication signals before the threshold for coordinated biofilm formation is reached. Quorum quenching works by degrading autoinducer molecules in the environment, preventing them from accumulating to the threshold concentration that triggers collective gene expression. Without the signal, the bacteria do not receive the instruction to form biofilm. The population remains in a more planktonic, dispersed state, which is more accessible to physical and chemical management and more consistent with the process assumptions in your treatment model.

Quorum quenching can be implemented through several approaches:

Biological quorum quenching involves inoculating the treatment system with microbial strains that produce enzymes capable of degrading autoinducer molecules. Some bacterial species naturally produce quorum quenching enzymes as a competitive strategy, by introducing or enriching these organisms within your treatment system, it is possible to shift the microbial community balance in a way that suppresses uncontrolled biofilm formation without disrupting the beneficial biofilm in fixed-film zones.

Process-based disruption, optimizing hydraulic retention time, aeration patterns, and shear stress within the system, can destabilize biofilm before it matures into a treatment problem. Periodic high-shear events, careful management of carrier media loading in MBBR systems, and controlled backwash cycles in MBR applications are all examples of process-level interventions that address biofilm stability without chemical addition.

Bioremediation-based microbial solutions represent an emerging approach in which the microbial community itself is managed proactively, introducing organisms selected for their ability to compete with biofilm-forming bacteria, degrade autoinducers, or occupy the ecological niches that would otherwise be filled by problematic biofilm communities.

What all of these approaches have in common is that they address the problem at the signaling level, before the biofilm is established, rather than trying to remove or destroy a mature biofilm structure after the fact.

At Team One Biotech, we develop bioremediation solutions that work with your plant’s microbial ecology, not against it. If biofilm management is a recurring challenge in your system, speak with our biological process specialists to explore science-backed intervention strategies tailored to your treatment configuration.

Frequently Asked Questions

What is quorum sensing in simple terms?

Bacteria count their own population using chemical signal molecules called autoinducers. As the bacterial population grows, these signals accumulate in the surrounding environment. When the concentration crosses a threshold, the entire bacterial community changes its behavior together, including switching on the genes responsible for biofilm formation. The quorum sensing definition, in the simplest possible terms, is a population-level decision made through chemical consensus.

How does quorum sensing lead to biofilm formation in bacteria?

Quorum sensing signals, once they reach the threshold concentration, activate gene clusters that produce the exopolysaccharide matrix, the physical scaffold that holds a biofilm together. Without QS reaching threshold, most bacteria remain planktonic and dispersed. It is the accumulation of autoinducer signals, and the collective gene expression that follows, that converts a free-swimming bacterial population into an organized, surface-attached biofilm community.

Is biofilm always bad in a wastewater treatment plant?

No. In fixed-film biological systems, MBBR, IFAS, trickling filters, biofilm is the desired treatment mechanism, and its formation is the goal of system design. The problem is uncontrolled biofilm in clarifiers, membrane systems, and pipe infrastructure, where it causes fouling, compliance failures, and increased operational costs. The challenge is not eliminating biofilm but managing where it grows and how dense it becomes.

What is quorum quenching and can it help my plant?

Quorum quenching refers to the disruption of bacterial communication signals, specifically the degradation of autoinducer molecules, before they accumulate to the threshold that triggers coordinated biofilm formation. It is an emerging biological control strategy being applied in advanced MBR and STP systems. By interrupting the signal before the behavioral switch is flipped, quorum quenching keeps bacteria in a more planktonic, manageable state without the limitations of chemical biocides against mature biofilm.

How does uncontrolled biofilm affect CPCB compliance?

Biofilm detachment events introduce suspended solids spikes into effluent that are difficult to predict or prevent using conventional process monitoring. In membrane systems, biofouling degrades filtration performance and effluent quality over time. Both pathways can result in deviation from discharge norms set by CPCB and SPCBs, and because these events are driven by microbial community behavior rather than influent load changes, they are often misdiagnosed as process upsets when the root cause is biological.

The Bottom Line, Know What Your Bacteria Are Planning

Quorum sensing is not a laboratory curiosity. It is a fundamental mechanism of microbial behavior that is operating in every active biological treatment system, continuously, around the clock. The biofilm growing on your membrane fibres, your clarifier internals, and your pipe walls is not appearing randomly, it is the result of coordinated bacterial decision-making driven by chemical signaling that your control panel does not measure and your process model does not account for.

The operators and engineers who understand this will approach biofilm differently. Instead of treating membrane fouling as a maintenance inconvenience or clarifier instability as an unexplained process upset, they will recognize these as downstream consequences of microbial community behavior that can be managed, and ideally, interrupted, before the symptoms appear in the effluent reports.

Microbial communication is not something you can see on your control panel, but its effects show up in your effluent reports, your maintenance schedules, and your compliance records. Team One Biotech specializes in bioremediation solutions that address biological treatment challenges at their root. Reach out to our team today to understand how targeted microbial management can improve the stability and compliance performance of your plant.

Looking to improve your ETP/STP efficiency with the right bioculture?
Talk to our experts at Team One Biotech for customised microbial solutions.

Contact: +91 8855050575

Email:  sales@teamonebiotech.com

Visit: www.teamonebiotech.com

Discover More on YouTube – Watch our latest insights & innovations!-

Connect with Us on LinkedIn – Stay updated with expert content & trends!
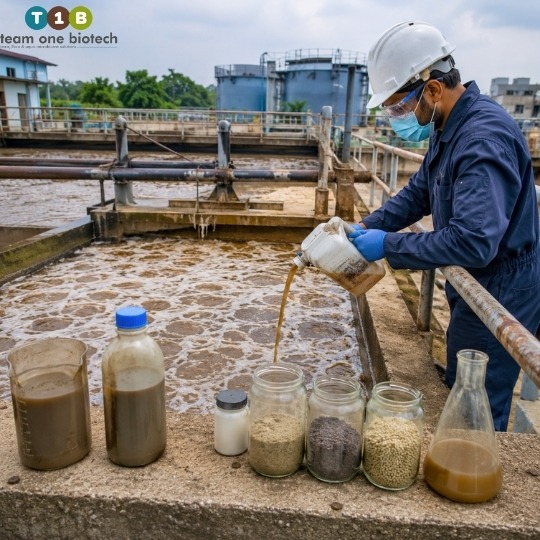
Zero Liquid Discharge (ZLD), Who Needs It and How Biological Treatment Reduces the Load

It is a Tuesday morning, and your compliance manager walks into your office with a printed directive. The letterhead reads CPCB. Somewhere in the second paragraph, the words “Zero Liquid Discharge” are underlined in red ink. The room goes quiet.

For a large number of plant directors and environmental heads across India, this is not a hypothetical. It is a moment that has already happened, or one they are quietly dreading. ZLD feels, at first glance, like an enormous, expensive, technically complex mandate handed down without a practical roadmap. The instinct is to panic, call three vendors, and receive three wildly different cost estimates that make things worse.

Before your team reaches that point, let us slow down. What ZLD actually means, which industries genuinely need it, what the compliance landscape looks like, and, most importantly, why the right biological treatment strategy can make the entire system far more manageable than the initial sticker shock suggests. That is what this guide is here to walk you through.

ZLD Full Form and What It Actually Means in Practice

ZLD Full Form and What It Actually Means in Practice

ZLD full form is Zero Liquid Discharge.

The definition, stripped of jargon, is this: a water management approach where no effluent leaves the plant boundary in liquid form. Every drop of wastewater generated within your facility is treated, recovered, and recycled back into your process. Nothing is discharged into a drain, a river, a municipal sewer, or any external body of water.

It is important to clarify what “zero” actually means here, because it trips people up. Zero Liquid Discharge does not mean zero water consumption. Your plant still uses water. It means zero untreated or partially treated liquid discharge leaving your premises. The water that enters must eventually either leave as solid waste, crystallised salts, sludge for disposal, or return to your process as recovered water.

In practice, a ZLD system moves through several stages. Incoming wastewater first goes through primary treatment, where solids and debris are removed. It then passes through secondary treatment, which is the biological stage, where microbial activity breaks down organic matter, reducing biochemical oxygen demand (BOD) and chemical oxygen demand (COD). After that comes tertiary treatment, including membrane filtration systems like reverse osmosis, which push water purity higher. Finally, the remaining concentrated reject stream goes through evaporation and crystallisation, where water is extracted as vapour and the dissolved solids are left behind as dry cake for disposal.

Each stage builds on the one before it. The quality of work done in your biological treatment stage directly determines how hard every stage after it has to work, and how much that costs you.

Zero Liquid Discharge India mandates are growing more stringent each year, and understanding the system architecture is the first step to approaching it rationally.

CETP Full Form and How It Fits Into the ZLD Conversation

CETP Full Form and How It Fits Into the ZLD Conversation

CETP full form is Common Effluent Treatment Plant.

A common effluent treatment plant is exactly what the name suggests: a shared treatment facility, typically set up by a cluster of small and medium-scale industries operating in proximity, to collectively treat their wastewater. Instead of each unit building and operating its own treatment infrastructure, which many small dyeing units, tanneries, or pharmaceutical manufacturers cannot afford, they pipe their effluent into a centralised CETP plant that handles treatment on their behalf.

In the context of industrial biochemistry, a CETP handles mixed-stream effluent. These streams tend to be complex: they carry high biological oxygen demand from organic matter, elevated chemical oxygen demand from synthetic compounds, variable pH, colour load, and in some cases heavy metals or residual solvents. The cetp full form in biochemistry context therefore implies not just shared infrastructure but shared biological and chemical treatment challenges, often in effluent streams that no single standard treatment protocol can address cleanly.

Here is where many industries make a dangerous assumption: they believe that discharging into a CETP exempts them from ZLD obligations. It does not. If your industry falls under a sector regulated for Zero Liquid Discharge, your wastewater does not get a free pass simply because it is pooled with others. The CETP itself may be required to meet ZLD norms, and the member industries may still carry regulatory responsibility. This is a compliance grey area that has caught several cluster units off guard during inspections.

Which Industries in India Are Legally Required to Implement ZLD

Which Industries in India Are Legally Required to Implement ZLD

The regulatory foundation here is significant. The Central Pollution Control Board (CPCB) and State Pollution Control Boards (SPCBs) across India have issued mandates requiring ZLD compliance for a defined set of industries, those characterised by high water consumption, complex effluent chemistry, and historically significant environmental impact. Non-compliance is not a matter of receiving a warning letter and carrying on. It can mean plant shutdown, cancellation of operating permits, and in serious cases, legal proceedings under the Environment Protection Act.

The following sectors are subject to ZLD mandates or intensive enforcement in India:

Textile and dyeing units sit at the top of this list. ZLD norms for textile industry India are among the most rigorously enforced in the country. Dyeing and bleaching operations generate effluent that is heavily coloured, high in TDS, and laden with reactive dyes that resist conventional treatment. Several SPCBs, particularly in Gujarat, Tamil Nadu, and Maharashtra, have issued sector-specific compliance timelines, and enforcement has become increasingly active. If your unit is in the textile or dyeing segment, ZLD is not a future consideration. It is a present obligation.

Distilleries and breweries generate some of the highest COD effluent loads of any industrial sector. Spent wash from distilleries is notoriously difficult to treat and has been the subject of specific SPCB directions in states including Uttar Pradesh, Maharashtra, and Punjab.

The sugar industry, while seasonal in its discharge cycle, produces large volumes of high-strength effluent during crushing season. The episodic nature of the discharge makes management harder, and ZLD requirements have been applied to sugar mills in several states.

Pulp and paper manufacturers have been on the CPCB’s regulated polluter list for decades. Effluent from paper mills contains chlorinated compounds, lignin, and high suspended solids loads that make discharge into natural water bodies unacceptable.

Pharmaceutical and bulk drug manufacturers are under increasing enforcement pressure, particularly in industrial clusters in Hyderabad (Patancheru, Bollaram) and Gujarat (Ankleshwar, Panoli). The effluent from bulk drug synthesis contains complex organic molecules, residual solvents, and active pharmaceutical ingredients that conventional treatment does not fully eliminate.

Tanneries produce effluent containing chromium compounds, sulfides, and high biological load, a combination that has resulted in severe enforcement action in clusters such as Vellore in Tamil Nadu and Kanpur in Uttar Pradesh.

Thermal power plants, particularly those managing ash pond discharge and cooling tower blowdown, face ZLD-adjacent requirements around water use efficiency and zero discharge from specific streams.

One important caveat: compliance requirements are not uniform across states. The CPCB sets the national framework, but SPCBs have discretion over timelines, specific norms, and enforcement intensity. Always verify your current obligations directly with your relevant state board or through a qualified compliance advisor.

ZLD vs ETP, Understanding the Difference Before You Invest

ZLD vs ETP, Understanding the Difference Before You Invest

When plant engineers and utility heads search for information on ZLD vs ETP, they are usually at a decision point: they have an existing system, they know something needs to change, and they are trying to understand how large that change needs to be.

An Effluent Treatment Plant, or ETP, treats your wastewater to permissible discharge limits and then releases the treated water, into a drainage channel, a river, or a municipal network, depending on your permit conditions. An ETP does its job and lets go of the water. It does not recover it.

A ZLD system does not let go. It goes several stages beyond an ETP, recovering water through membrane systems and thermal evaporation until nothing liquid remains to discharge. The recovered water goes back into your process. The residual becomes solid waste.

What is critical to understand is that ZLD is not a replacement for an ETP. It is an extension of one. A well-designed ETP with robust biological treatment is the foundation that a ZLD system is built on top of. You cannot skip the biological stage and bolt on an evaporator and expect things to work efficiently. That is not a technical opinion, it is a practical reality that plants across India have discovered the hard way.

Here is a general comparison of the two approaches:

ParameterETPZLD System
Liquid discharge allowedYes, within regulatory limitsNo liquid discharge permitted
Water recoveryPartialNear-complete
Primary cost driverChemical and biological treatmentEvaporation energy
Regulatory statusStandard compliance requirementMandatory for regulated sectors
Downstream destination of treated waterExternal drain, river, or sewerRecycled back into plant process

Disclaimer: The above is a general comparison. Actual performance parameters vary based on influent quality, plant design, technology selection, and operational conditions specific to each facility.

The underlying message: if you are in a regulated sector, ZLD is not an upgrade you choose. It is the standard you are required to meet. The question is not whether to build it but how to build it in a way that does not drain your operating budget every month.

Why Biological Treatment Is the Most Underrated Step in Any ZLD System

Here is where a great deal of industrial investment goes wrong, and where it can be corrected.

When the ZLD conversation starts inside a plant, the instinct is to focus on the visible, capital-intensive end of the system: the evaporators, the crystallisers, the multiple-effect evaporation units. These are the big-ticket line items. They look like the solution. And they are part of the solution, but they are the last part, not the whole.

The single most expensive mistake in ZLD system planning is rushing toward thermal evaporation without adequately addressing organic load upstream. The reason is straightforward: evaporation systems are energy-intensive by design. Every litre of water that enters an evaporator must be heated to the point of vaporisation. The higher the BOD and COD load in that water, the more the system fouls, scales, and struggles. The more it struggles, the more energy it consumes. The more energy it consumes, the higher your operating cost climbs, month after month, year after year.

Biological treatment, particularly advanced solutions using microbial consortia developed for specific effluent compositions, can reduce BOD and COD by a substantial margin before water reaches the thermal stage. This is not a marginal improvement. In well-designed systems, significant organic load reduction at the biological stage translates directly into reduced volume and strength of water entering evaporation, which translates into measurably lower energy consumption and operating expenditure.

What effective biological pre-treatment achieves within a ZLD system:

  • Significant reduction in BOD and COD before water reaches secondary and tertiary processing stages
  • Reduced fouling and scaling in membrane systems such as ultrafiltration and reverse osmosis, extending membrane life and cutting replacement frequency
  • Extended operational life of evaporation equipment by reducing the chemical aggressiveness of the concentrated stream
  • Lower consumption of chemicals in downstream polishing and pH correction stages
  • A materially reduced energy footprint for the ZLD system as a whole

The logic is simple: every unit of organic load you remove biologically is a unit of load your evaporator does not have to deal with. Biological treatment is cheaper per unit of load removed than thermal evaporation. Therefore, investing adequately in biological treatment before your evaporator is not a compromise, it is the economically rational decision.

Disclaimer: Reduction efficiencies vary depending on influent composition, hydraulic retention time, microbial culture selection, temperature, and plant-specific operating conditions. The benefits described above are indicative and reflect observations across typical industrial applications. Plant-specific assessment by a qualified engineer is recommended before system design decisions are made.

What Does a ZLD System Cost in India, And How Biological Treatment Affects That Number

One of the most common questions plant directors ask is straightforward: what will this cost?

The honest answer is that ZLD system cost in India varies considerably, and anyone who gives you a firm number without understanding your influent quality, discharge volume, recovery targets, and technology selection is guessing. Mid-sized industrial plants implementing ZLD in India have seen costs range from a few crores on the lower end, for plants with simpler effluent chemistry, existing pre-treatment infrastructure, and modest recovery requirements, to significantly higher for plants handling complex, high-volume, high-TDS effluent streams.

What matters more than the headline number is understanding where the costs come from and where they can be managed intelligently.

Capital cost in a ZLD system is dominated by evaporation and crystallisation equipment. These are expensive to procure, install, and maintain. Operating cost is dominated by energy, specifically the thermal energy required to run evaporators.

The single most effective lever available to reduce both capital and operating cost is upstream biological treatment. A plant that invests in a well-designed biological pre-treatment system can reduce the organic and dissolved load entering its evaporator. A reduced load means a smaller evaporator can do the job, lower capital cost. A reduced load also means less energy per litre of water processed, lower operating cost. Over a ten or twenty-year system life, the savings from right-sizing your evaporator based on biologically pre-treated water can be substantial.

Framed differently: the question is not whether biological treatment costs money. It does. The question is whether that investment reduces a larger cost elsewhere in the system. In well-designed ZLD systems, the answer is consistently yes.

Frequently Asked Questions

What is the ZLD full form?

ZLD full form is Zero Liquid Discharge, a wastewater management approach in which no liquid effluent is released outside the plant premises. All wastewater is treated, recovered, and recycled internally.

What is CETP full form in biochemistry?

CETP full form is Common Effluent Treatment Plant. In the context of industrial biochemistry, a CETP handles mixed effluent streams from multiple industries, typically streams with high biological oxygen demand and chemical oxygen demand, within a shared treatment facility serving an industrial cluster.

Is ZLD mandatory for textile industries in India?

Yes. ZLD norms for textile industry India have been mandated by CPCB and multiple State Pollution Control Boards, with particular enforcement focus on dyeing and bleaching units. Compliance timelines and specific norms differ by state, and units should verify their current obligations with their relevant SPCB.

How does biological treatment reduce ZLD operating costs?

By reducing BOD and COD before water reaches evaporation stages, biological treatment lowers the organic and dissolved load on energy-intensive thermal equipment. This reduces energy consumption, slows fouling of membranes and evaporators, and in many cases allows right-sizing of downstream equipment, cutting both capital expenditure and ongoing operating costs.

ZLD Is Not Optional, But It Does Not Have to Break Your Budget

Three things are worth carrying away from everything covered here.

First, Zero Liquid Discharge India compliance is a regulatory reality for most high-polluting industrial sectors, not a future consideration and not something that can be deferred indefinitely. The enforcement environment is tightening, and the cost of non-compliance, in legal exposure, reputational damage, and potential plant shutdown, is considerably higher than the cost of building the right system.

Second, biological treatment is the most underutilised cost-reduction lever in ZLD system design. Plants that invest in robust upstream biological pre-treatment consistently find that their downstream evaporation systems are smaller, cheaper to run, and longer-lasting than those of plants that skipped or underinvested in this stage.

Third, the intelligence in ZLD design is upstream. Over-sizing your evaporator because your biological treatment is inadequate is not a safety margin, it is an avoidable expense that compounds every time your energy bill arrives.

ZLD is not optional. But with the right treatment architecture, it does not have to define your plant’s economics in the way that first CPCB directive made it feel.

Team One Biotech works with industrial plants across India to design and deploy bioremediation solutions that make ZLD systems leaner, more efficient, and more cost-effective. Whether you are planning a new ZLD system or optimising an existing one, our technical team is ready to support you. Contact us today for a no-obligation consultation.

Disclaimer: Cost ranges mentioned above are general industry indicators and may vary significantly based on influent characteristics, plant scale, technology selection, and site-specific conditions. These figures should not be treated as project estimates. Detailed techno-commercial proposals from qualified vendors are essential for accurate cost assessment.

Looking to improve your ETP/STP efficiency with the right bioculture?
Talk to our experts at Team One Biotech for customised microbial solutions.

Contact: +91 8855050575

Email:  sales@teamonebiotech.com

Visit: www.teamonebiotech.com

Discover More on YouTube – Watch our latest insights & innovations!-

Connect with Us on LinkedIn – Stay updated with expert content & trends!
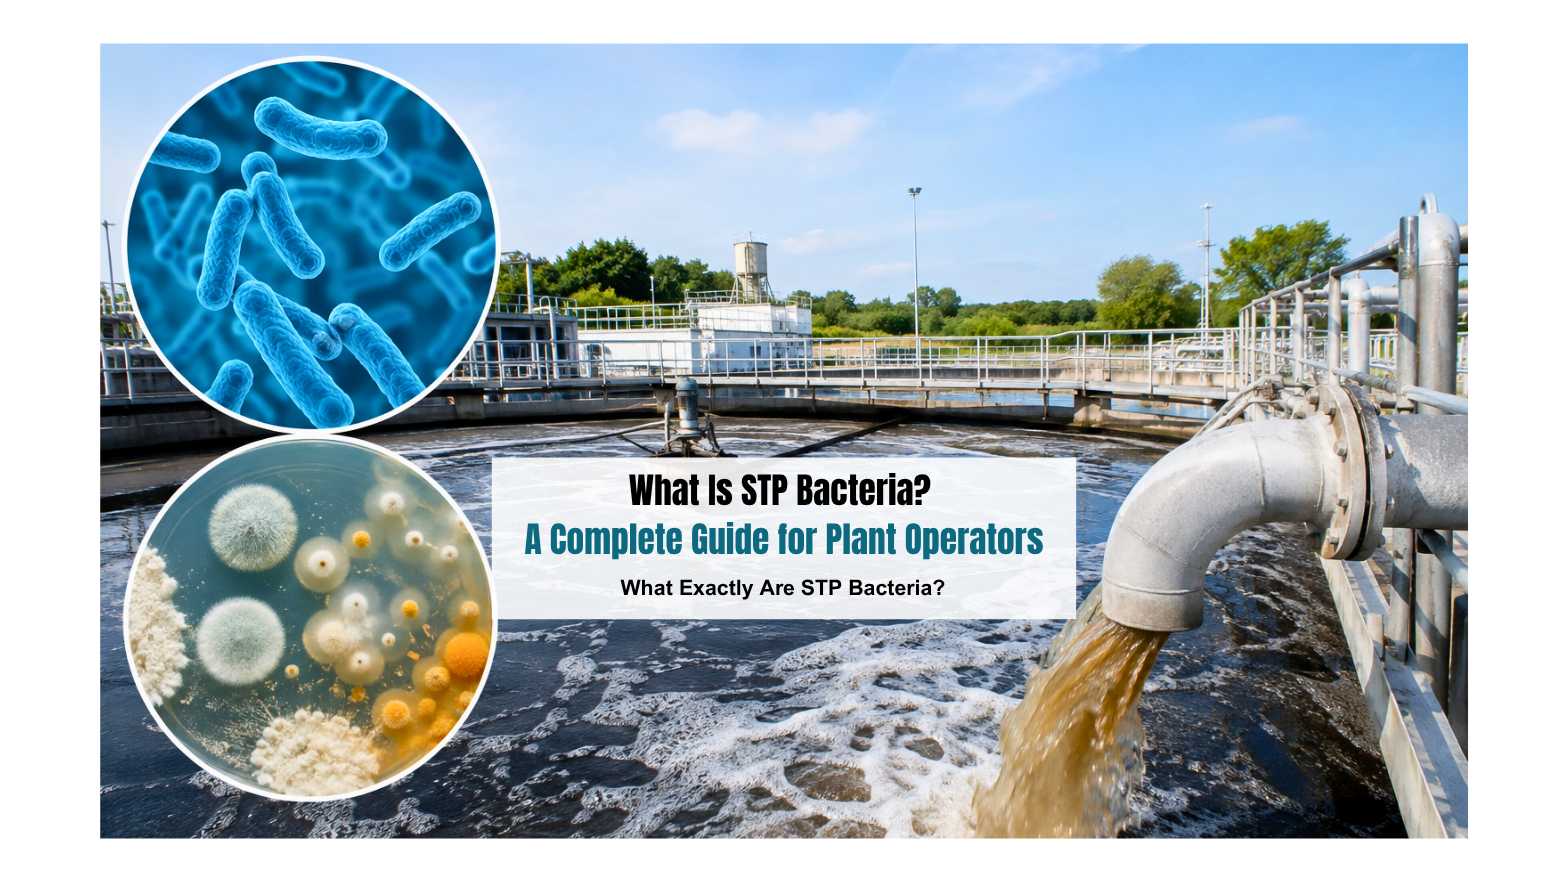
What Are Nanobubbles and Why Do They Behave Differently
Nanobubble Technology in Wastewater: How It Works and When It Outperforms Conventional Aeration

Many plant managers running biological treatment systems have faced the same frustrating scenario. You follow the prescribed aeration schedule. You maintain the blower run-hours. You check the equipment, everything looks fine on paper. And yet BOD and COD in the effluent keeps creeping above discharge limits. The diffusers are working. The blowers are humming. But the biology is struggling, and your compliance reports are telling a different story than your operational logs.

The issue is not always the quantity of air being pushed into the tank. More often than engineers initially expect, the real problem is how efficiently that oxygen is actually transferring into the mixed liquor where microorganisms can use it. You can move enormous volumes of air through a system and still starve your biology of dissolved oxygen if the gas transfer mechanism is inefficient. This is exactly where nanobubble technology changes the conversation, not by blowing more air, but by making every unit of oxygen work dramatically harder.

If you have ever stood beside an aeration tank running at full blower capacity, watching the surface churn, and still pulled DO readings that made you wince, this article was written for you.

What Are Nanobubbles and Why Do They Behave Differently

What Are Nanobubbles and Why Do They Behave Differently

To understand why nanobubble technology performs the way it does, you need to first understand what makes nanobubbles physically distinct from the bubbles produced by conventional aeration systems, including fine bubble diffusers, which are themselves considered an improvement over coarse bubble systems.

Nanobubbles are gas-filled cavities in liquid that are orders of magnitude smaller than conventional fine bubbles. We are talking about bubble diameters in the sub-micron range, so small they are invisible to the naked eye and behave more like dissolved species in the liquid than like the bubbles most engineers are used to working with. That size difference is not a cosmetic distinction. It fundamentally changes the physics of how gas transfers into liquid, and that is where the performance gains come from.

High surface area-to-volume ratio

The relationship between bubble size and gas-liquid contact surface is not linear, it is exponential. As bubble diameter decreases, the total interfacial surface area available for oxygen transfer increases dramatically for the same volume of gas injected into the system. This is the foundational reason why nanobubble aeration can achieve substantially higher oxygen transfer efficiency than conventional systems operating with the same gas input.

Neutral buoyancy and extended residence time

This is one of the more counterintuitive properties of nanobubbles for engineers who are accustomed to thinking of bubbles as things that rise. Conventional fine bubbles, even the small ones produced by quality membrane diffusers, rise through the liquid column relatively quickly and escape at the surface before all their oxygen transfers into the mixed liquor. Nanobubbles, because of their extremely small size and correspondingly low buoyancy, remain suspended in the liquid column for extended periods. Some remain in suspension indefinitely until their gas content fully transfers into the surrounding water. This extended residence time means far more of the injected oxygen actually ends up dissolved in the wastewater rather than venting off at the surface.

Zeta potential and electrostatic stability

Nanobubbles carry a surface charge, specifically a negative zeta potential, that gives them electrostatic stability within the liquid. In practical terms, this means they resist coalescence. When conventional bubbles are in close proximity, they tend to merge into larger bubbles, which then rise faster and transfer oxygen less efficiently. Nanobubbles repel each other and maintain their size throughout the aeration tank, sustaining their transfer efficiency across the full volume of the basin rather than degrading as they move through the liquid.

Implosion and reactive oxygen species generation

Under certain conditions, nanobubbles collapse under the pressure of the surrounding liquid, and this collapse event generates reactive oxygen species, primarily hydroxyl radicals. These are powerful oxidising agents that can attack complex organic molecules, including recalcitrant COD compounds that standard biological processes struggle to break down. This mechanism adds a chemical oxidation pathway on top of the biological oxidation that aeration already supports, which is particularly relevant for industrial effluents with complex organic loads.

The combination of these properties, extended residence time, high interfacial surface area, electrostatic stability, and reactive oxygen species generation, explains why nanobubble technology is not simply a variation on conventional aeration. It is a fundamentally different mechanism of gas transfer.

How a Nano Bubble Generator Works in a Wastewater System

How a Nano Bubble Generator Works in a Wastewater System

Understanding the physics of nanobubbles naturally leads to the question of how a nano bubble generator actually produces these structures at scale in a continuous-flow treatment environment.

Most nano bubble generator systems used in wastewater treatment operate on one of two primary principles: pressurised gas dissolution or hydrodynamic cavitation. In pressurised dissolution systems, gas, typically atmospheric air, or pure oxygen in applications where higher DO targets are needed, is dissolved into the process water under elevated pressure. When this pressurised, gas-saturated water is released back into the aeration tank at ambient pressure, the dissolved gas nucleates out of solution as nanobubbles distributed uniformly throughout the liquid volume. In hydrodynamic cavitation-based systems, high-velocity flow through specifically designed geometries creates localised low-pressure zones where nanobubbles are generated through a different but equally effective mechanism.

In both cases, the generator is integrated into the recirculation loop of the aeration tank, STP basin, or ETP equalization and treatment zone. A portion of the tank volume is continuously drawn through the generator and returned to the tank enriched with nanobubbles, maintaining steady-state dissolved oxygen levels across the basin.

A few operational characteristics of nano bubble generator systems are worth noting for plant evaluators. First, these systems are generally designed for retrofit integration into existing infrastructure, they do not require significant civil modification or tank redesign in most cases. The generator is installed in the recirculation pipeline, and the return flow is distributed back into the aeration basin through existing or modified return points. Second, unlike submerged membrane diffuser systems, most nano bubble generator configurations do not have submerged consumable components that require tank dewatering for inspection or replacement. This has meaningful implications for maintenance planning, as diffuser maintenance typically requires taking a tank out of service, a significant operational disruption in continuous-flow systems.

The ability to retrofit without full plant redesign is one of the more practically important features of nanobubble systems, particularly for facilities that are operating under compliance pressure and cannot afford extended downtime for infrastructure upgrades.

Fine Bubble Diffuser vs Nanobubble, A Direct Comparison

Fine Bubble Diffuser vs Nanobubble, A Direct Comparison

This comparison is worth approaching with some intellectual honesty. Fine bubble diffusers represent a mature, well-understood technology that has served the wastewater treatment industry reliably for decades. They are not a bad technology, they are simply not always the right technology, particularly for high-load industrial applications or aging systems that are struggling to maintain compliance.

Bubble size and oxygen transfer efficiency

Fine bubble diffusers produce bubbles in the range of a fraction of a millimetre in diameter, already a significant improvement over coarse bubble systems in terms of gas transfer. Nanobubbles are several orders of magnitude smaller, which translates to substantially higher oxygen transfer efficiency for equivalent gas input volumes. (Disclaimer: Actual OTE values vary significantly by wastewater type, tank geometry, organic loading, temperature, and operating parameters. Values cited in literature and from field installations are indicative and should not be taken as guaranteed performance for any specific installation.)

Energy Consumption

Fine bubble diffuser systems depend on continuous high-volume blower operation to maintain airflow through the diffuser grid. The blowers are typically the single largest energy consumer in an STP or ETP. Nanobubble systems can achieve comparable or, in many applications, superior dissolved oxygen levels at lower aeration energy inputs, because the oxygen they inject is transferred more efficiently, meaning less total gas needs to be processed. Actual energy outcomes are site-specific and depend on the baseline system being compared, but energy reduction is one of the consistently reported operational benefits across diverse installation types.

Dissolved oxygen consistency across the tank

One of the more significant operational differences between fine bubble diffuser systems and nanobubble aeration is DO distribution uniformity. Diffuser grids, even when well-designed, can leave zones of lower DO activity, particularly in corners, near tank walls, or in deeper sections with stratified flow. Nanobubbles, because they remain suspended throughout the liquid column and are distributed via recirculation flow, tend to produce more uniform DO profiles across the basin volume. This matters because DO-deficient zones are where biological performance degrades and where nitrification or COD removal can be inconsistent.

Maintenance and Biofouling

Diffuser membranes are subject to fouling from biological growth, scaling from mineral precipitation, and mechanical wear from continuous flexing. Membrane replacement or cleaning is a recurring maintenance cost in diffuser-based systems and typically requires tank dewatering. Nanobubble generators, with fewer or no submerged consumable components, generally require less frequent maintenance intervention, which reduces both direct maintenance cost and the operational disruption of planned downtime.

Capital cost and retrofit economics

Fine bubble diffuser systems have a lower upfront capital cost for new installations, and for a greenfield plant treating low-strength domestic wastewater with stable loading, they remain a cost-effective choice. Nanobubble systems involve a higher initial investment, but the total cost of ownership calculation changes significantly when you factor in energy savings, reduced maintenance frequency, and, critically, the cost of ongoing non-compliance for plants that are already struggling to meet discharge standards with their existing diffuser setup.

ParameterFine Bubble DiffuserNanobubble System
Bubble sizeSub-millimetre rangeSub-micron range
Oxygen transfer efficiencyModerateHigher (site-specific)
Aeration energy demandHigh (blower-dependent)Generally lower
DO uniformity in tankVariable, zone-dependentMore consistent
Submerged maintenance componentsYes, membrane fouling/wearMinimal to none
Retrofit complexityRequires tank dewateringTypically pipeline-based
Upfront capital costLowerHigher
Operational savings potentialBaselineSignificant in high-load applications

(Disclaimer: The above comparison reflects general operational characteristics. Specific performance outcomes depend on wastewater characteristics, plant design, and operating conditions. A site-specific assessment is recommended before making technology selection decisions.)

Dissolved Oxygen Improvement in STP, What Changes Operationally

Dissolved Oxygen Improvement in STP, What Changes Operationally

For the ETP or STP operator, understanding the physics of nanobubbles is useful, but what matters most is what actually changes at the plant level when nanobubble aeration is introduced into the treatment train.

The most immediate and consistent change reported by facilities that have adopted nanobubble technology is improved DO uniformity across the aeration basin. Rather than seeing high DO near the diffuser grid and progressively lower DO toward tank edges or at depth, operators typically observe a more stable DO profile throughout the basin volume. Dead zones, areas of chronically low oxygen activity, are significantly reduced or eliminated. This matters because biological treatment performance in an activated sludge system is directly tied to DO availability at the point where organisms and substrate interact, not just at the measurement probe.

With more consistent DO levels sustained across the tank, MLSS activity improves. Healthy, oxygen-sufficient biomass produces better settling characteristics, which flows through to clarifier performance and final effluent quality. This is a system-wide effect, better aeration in the biological reactor does not just improve BOD and COD removal, it also reduces sludge bulking risk and makes the downstream solids handling process more predictable.

Odour reduction is another operationally significant outcome that does not always feature prominently in technical literature but matters enormously to plant operators dealing with community relations or regulatory complaints. Anaerobic zones in aeration tanks are the primary source of hydrogen sulphide and other odorous compounds in biological treatment systems. When DO levels are consistently maintained throughout the basin, anaerobic microenvironments are suppressed, and odour generation drops considerably.

For plants that are running against CPCB and SPCB discharge norms, particularly during peak organic load events from seasonal production surges or industrial process changes, nanobubble aeration provides a meaningful buffer. Better oxygen transfer during peak loading means the biology can handle the surge more effectively, reducing the risk of compliance violations during the most operationally challenging periods.

If your STP or ETP is struggling with inconsistent DO levels, recurring compliance violations, or odour complaints that conventional aeration adjustments have not resolved, speak with our aeration specialists at Team One Biotech to evaluate whether nanobubble technology is the right fit for your system.

When Nanobubble Technology Outperforms Conventional Aeration, And When It Does Not

Technical credibility requires acknowledging that nanobubble technology is not the universal answer for every wastewater treatment application. Here is an honest evaluation of where it tends to outperform conventional systems, and where conventional approaches remain entirely adequate.

Nanobubble aeration tends to outperform conventional systems when:

  • The wastewater has a high organic load and the aeration tank is frequently DO-deficient despite sustained high blower run-hours, this is the profile where nanobubbles deliver the clearest benefit
  • The plant is treating industrial effluent with complex or recalcitrant COD compounds, pharmaceutical wastewater, food processing effluent, textile ETP streams, and similar high-strength applications where reactive oxygen species generation adds a meaningful oxidation pathway
  • Space constraints prevent aeration tank expansion, and the facility needs to improve treatment performance within the existing footprint
  • Energy cost reduction is a formal operational objective alongside compliance improvement, nanobubble systems offer a path to both simultaneously in many industrial applications
  • The existing diffuser system is aging, approaching end-of-useful-life, and the facility is evaluating whether to replace it with the same technology or upgrade

Conventional fine bubble diffuser aeration may still be the more appropriate choice when:

  • The plant is treating low-strength domestic wastewater with stable, predictable organic loading, in these conditions, a well-maintained diffuser system typically performs adequately without the additional capital investment that nanobubble systems require
  • The existing diffuser system was recently installed, is performing within acceptable DO and effluent quality parameters, and there is no pressing compliance or energy cost driver
  • Budget constraints make the higher initial capital investment in nanobubble generation infrastructure impractical at this stage of the facility’s lifecycle

The honest answer for most industrial ETP operators evaluating aeration upgrades is that nanobubble technology deserves serious, structured evaluation, not as a replacement for engineering judgment, but as an input to it. The technology has matured to the point where field performance data is available across a range of wastewater types and plant configurations, and that data supports a well-reasoned investment case for many high-load industrial applications.

Frequently Asked Questions

Q: Can a nano bubble generator be retrofitted into an existing ETP or STP?

In most cases, yes. Nano bubble generators are designed to integrate with existing aeration infrastructure through the tank recirculation loop, typically without significant civil modification or the need to take the tank out of service for extended periods. The specific retrofit approach depends on tank geometry, current flow rates, aeration configuration, and available pipe connections. A site assessment is recommended to confirm feasibility and define the integration scope before proceeding.

Q: How does nanobubble aeration help with CPCB compliance?

By improving dissolved oxygen consistency across the aeration basin and enhancing gas transfer efficiency, nanobubble systems support more complete biological oxidation of BOD and COD within the treatment tank. Better oxygen availability means better biological performance, and better biological performance translates to more consistent effluent quality within the limits prescribed by CPCB and SPCB discharge standards. In high-load industrial applications, the reactive oxygen species generated during nanobubble collapse can also contribute to COD reduction beyond standard biological pathways. Results are plant-specific and depend on wastewater characteristics and current treatment configuration.

Q: Is nanobubble technology suitable for all types of wastewater?

Nanobubble aeration has demonstrated strong results across a range of wastewater types, industrial effluent, pharmaceutical wastewater, food and beverage processing ETPs, textile effluent, and municipal STPs with elevated organic loads. Its effectiveness depends on the specific wastewater characteristics, current DO deficits, organic loading profile, and treatment objectives. Low-strength domestic wastewater with stable loading represents a category where the performance differential over conventional systems may not justify the capital investment without other driving factors.

Q: What is the typical energy saving compared to conventional aeration?

Energy outcomes vary significantly between installations and should not be generalised without a site-specific assessment. Facilities that have supplemented or replaced fine bubble diffuser systems with nanobubble aeration commonly report measurable reductions in aeration energy consumption, attributable to achieving equivalent or superior DO levels with lower total gas input volumes. The magnitude of savings depends on baseline blower energy consumption, wastewater characteristics, DO targets, and the specific nanobubble system configuration. A feasibility study based on your plant’s actual operational data will produce a more reliable energy savings estimate than any general range.

(Disclaimer: All performance values, efficiency ranges, and operational outcomes referenced in this article are general indicative estimates based on available literature and field data. Actual results vary depending on wastewater characteristics, plant configuration, organic loading rates, temperature, and site-specific operating conditions. We recommend a detailed site assessment before making any technology selection decisions.)

The Aeration Decision That Affects Everything Downstream

Aeration is not a background utility function in a wastewater treatment plant. It is the engine of biological treatment, the mechanism by which the microbial community that does the actual work of breaking down organic load receives the oxygen it needs to function. When aeration underperforms, the consequences are not confined to the aeration tank. They propagate downstream: into the secondary clarifier, into the sludge handling system, into the compliance report, and ultimately into the relationship between the facility and the regulatory authority.

Nanobubble technology offers a scientifically grounded, field-validated pathway to improve aeration efficiency without necessarily expanding tank volumes, adding blower capacity, or undertaking major civil works. For facilities that are operating hard to meet CPCB and SPCB norms and still falling short, particularly in high-load industrial applications where conventional aeration is running at its design limits, this technology deserves serious, structured evaluation.

The shift it represents is not from one brand of aeration equipment to another. It is a shift in the fundamental mechanism of oxygen delivery into the mixed liquor, and that is a meaningful distinction worth understanding before the next aeration infrastructure decision is made.

Team One Biotech works with environmental engineers and plant operators across India to evaluate, design, and implement nanobubble aeration solutions tailored to your ETP and STP requirements. Get in touch with our technical team to discuss your plant’s specific challenges and explore whether nanobubble technology is the right next step for your facility.

Looking to improve your ETP/STP efficiency with the right bioculture?
Talk to our experts at Team One Biotech for customised microbial solutions.

Contact: +91 8855050575

Email:  sales@teamonebiotech.com

Visit: www.teamonebiotech.com

Discover More on YouTube – Watch our latest insights & innovations!-

Connect with Us on LinkedIn – Stay updated with expert content & trends!
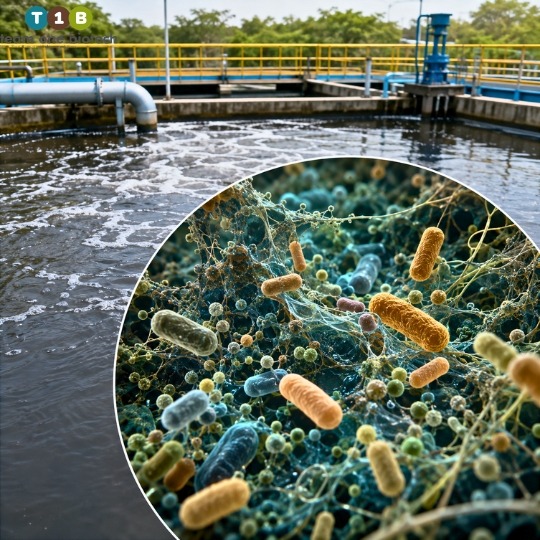
Nitrification and Denitrification in Wastewater Treatment: A Process Engineer's Overview
Nitrification and Denitrification in Wastewater Treatment: A Process Engineer’s Overview

There is a particular kind of dread that settles in when a consent violation notice lands on your desk. The ammonia levels in your treated effluent are elevated again. The CPCB or SPCB inspector is scheduled for next week. Your plant’s performance data tells a story you are not proud of, and you know that the next conversation with management is going to be uncomfortable. If you have been in this position, or are in it right now, you understand that nitrogen removal from wastewater is no longer a technical afterthought. It is a compliance imperative.

Biological nitrogen removal through nitrification and denitrification has become the cornerstone of compliant effluent treatment across India’s industrial and municipal sectors. As regulatory limits on total nitrogen, ammonia-nitrogen, and nitrate continue to tighten under CPCB and SPCB frameworks, plants that rely on conventional treatment alone are finding themselves perpetually on the wrong side of the discharge standards. The biology has to work. And for that to happen, the process engineer has to understand the biology.

This article walks through the complete picture, what nitrification and denitrification are, how they work at a biochemical level, what makes them fail, and what it takes to run them reliably under the pressures of industrial wastewater treatment in India.

If your plant is currently struggling to meet CPCB or SPCB nitrogen discharge norms, Team One Biotech’s specialized bioremediation cultures are engineered specifically to help. Reach out to our technical team today for a plant-specific assessment.

Why Nitrogen in Wastewater Is a Regulatory and Environmental Problem

Why Nitrogen in Wastewater Is a Regulatory and Environmental Problem

Nitrogen enters wastewater streams in multiple forms, primarily as ammonia (from industrial processes, fertilizer runoff, and domestic sewage), organic nitrogen, nitrate, and nitrite. Left untreated, this nitrogen load creates serious downstream consequences.

When nitrogen-rich effluent discharges into rivers, lakes, or coastal water bodies, it fuels eutrophication, an explosive growth of algae and aquatic plants that depletes dissolved oxygen, suffocates aquatic life, and renders water bodies unusable for irrigation, fisheries, or drinking water abstraction. The ecological damage compounds over time, and in water-stressed regions like much of India, the consequences extend well beyond environmental aesthetics.

From a regulatory standpoint, CPCB and various SPCBs have progressively tightened effluent discharge standards for total nitrogen, ammonia-nitrogen, and nitrate. These are limits that most conventional aerobic treatment systems, designed primarily for BOD and suspended solids removal, simply cannot meet without dedicated biological nitrogen removal. Industries most exposed include pharmaceutical manufacturers, food and beverage processors, fertilizer plants, municipal sewage treatment plants, and tanneries. For these sectors, the cost of non-compliance is not abstract: it includes consent violations, financial penalties, forced plant shutdowns, and reputational damage that is difficult to recover from.

The only sustainable solution, both economically and operationally, is biological nitrogen removal through the sequential processes of nitrification and denitrification.

What Is Nitrification? The Biochemical Mechanism Explained

The Nitrification Reaction, Two-Stage Aerobic Oxidation

Nitrification is a two-stage aerobic biological process in which ammonia-nitrogen is first converted to nitrite, and then nitrite is oxidized to nitrate. Each stage is carried out by distinct groups of highly specialized autotrophic bacteria that derive their energy not from organic carbon, but from the chemical oxidation of inorganic nitrogen compounds.

The first stage is performed by ammonia-oxidizing bacteria (AOB), predominantly species of the genus Nitrosomonas. These organisms oxidize ammonia to nitrite, releasing energy that they use for growth and cell synthesis. The second stage is handled by nitrite-oxidizing bacteria (NOB), primarily Nitrobacter spp., which oxidize nitrite to nitrate.

In simplified terms, the nitrification reaction proceeds as follows:

  • Stage 1 (AOB): Ammonia → Nitrite (with consumption of dissolved oxygen and alkalinity)
  • Stage 2 (NOB): Nitrite → Nitrate (with further oxygen consumption)

The net result is the conversion of toxic ammonia-nitrogen into nitrate, which is far less immediately toxic but still ecologically harmful and subject to discharge limits. Nitrification alone does not achieve total nitrogen removal from wastewater, it only transforms the form of nitrogen present. Complete removal requires denitrification as the second step.

One operational reality that every plant engineer must internalize: nitrifying bacteria are among the slowest-growing organisms found in activated sludge systems. They grow two to three orders of magnitude more slowly than the heterotrophic bacteria responsible for BOD removal. This makes them extraordinarily sensitive to washout, toxic shock, and process upsets. A nitrifier population that takes weeks to establish can be destroyed in hours.

Operating Conditions That Drive Nitrification Efficiency

Operating Conditions That Drive Nitrification Efficiency

Dissolved Oxygen (DO)

Nitrifiers are obligate aerobes, they cannot function without oxygen. The nitrification process requires dissolved oxygen levels to be maintained above a certain minimum threshold in the aeration tank. Below this threshold, nitrification rates drop sharply and can cease entirely. In practice, DO control in the aeration zone is one of the most direct levers an operator has for managing nitrification performance. (Note: These are general indicative ranges; actual values vary significantly depending on the specific ETP/STP design, influent characteristics, and operating conditions.)

pH

pH exerts a profound influence on nitrification efficiency. The nitrification process ceases at pH levels that fall outside the tolerable range for nitrifying organisms. The optimal pH window for nitrification lies within a moderately alkaline range, and activity drops sharply as pH approaches the acidic or strongly alkaline extremes. Engineers should note that nitrification itself consumes alkalinity, which means systems without adequate buffering capacity are prone to a pH crash that then further suppresses the very biological activity driving that pH shift, a self-reinforcing failure cycle. 

(Note: Indicative ranges only; site-specific values will differ based on system design and influent composition.)

Temperature

Nitrification is temperature-sensitive in a way that creates predictable seasonal challenges in many Indian climates. While high ambient temperatures can generally support nitrification, cold winters, particularly in northern India, can significantly reduce nitrifier metabolic rates and effective population density. Process engineers operating STPs and ETPs in these regions should anticipate performance degradation during colder months and plan accordingly, whether through bioaugmentation, extended SRTs, or temperature compensation strategies. (Indicative ranges only.)

Alkalinity

Because nitrification consumes bicarbonate alkalinity as a carbon source for autotrophic growth and as a buffer, systems receiving low-alkalinity influent or operating at high nitrogen loads may experience progressive pH depression. Alkalinity supplementation, typically through sodium bicarbonate or lime addition, is a standard corrective measure, but it must be managed carefully to avoid overcorrection.

Sludge Retention Time (SRT)

The slow growth rate of nitrifying bacteria means that a minimum SRT is required to maintain an active nitrifier population in the system. If the SRT falls below this biological threshold, nitrifiers are washed out of the system faster than they can reproduce. This is one of the most common and most damaging operational errors in plants that have not been specifically designed or adjusted for nitrification. In practice, nitrification-optimized systems require considerably longer SRTs than systems designed only for BOD removal. (Range is system-specific; consult a process specialist.)

Toxic Inhibitors

Industrial ETP operators face a challenge that municipal STP operators rarely encounter at the same scale: toxic influent loads. Heavy metals, free ammonia at elevated concentrations, chlorine residuals, and various industrial solvents and process chemicals can inhibit or outright kill nitrifying communities. Identifying and characterizing the inhibitory components in a plant’s influent is an essential step in any nitrification troubleshooting exercise.

What Is Denitrification? Closing the Nitrogen Loop

What Is Denitrification? Closing the Nitrogen Loop

The Biochemistry of Denitrification

If nitrification is the first half of biological nitrogen removal, denitrification is the step that completes it. Denitrification is the microbial reduction of nitrate and nitrite to nitrogen gas, which escapes harmlessly from the liquid phase into the atmosphere. It is the only biological mechanism that achieves actual removal of nitrogen from the wastewater system, not merely a transformation of its chemical form.

The organisms responsible for denitrification are fundamentally different from nitrifiers in their physiology and ecology. Denitrification bacteria in STP environments are facultative heterotrophs, organisms capable of switching their metabolic strategy depending on the availability of oxygen. Under anoxic conditions (where dissolved oxygen is absent or minimal, but the environment is not fully anaerobic), these bacteria use nitrate or nitrite as their terminal electron acceptor in place of oxygen, reducing them stepwise to nitrogen gas.

Key genera involved in denitrification include Pseudomonas, Paracoccus, Bacillus, and several others. Unlike nitrifiers, these organisms are not slow-growing specialists, they are metabolically flexible and relatively robust, which makes them somewhat easier to manage operationally. However, their effectiveness is still contingent on specific process conditions being met.

Without denitrification, a plant achieving full nitrification will simply accumulate nitrate in its treated effluent. This satisfies ammonia discharge limits but may still violate total nitrogen or nitrate-specific limits, and it represents an incomplete treatment outcome from both regulatory and environmental standpoints.

Key Operating Conditions for Denitrification

Key Operating Conditions for Denitrification

Carbon-to-Nitrogen (C:N) Ratio

Denitrification is fundamentally a heterotrophic process, the organisms require an organic carbon source as the electron donor to drive the reduction of nitrate. This creates a significant operational challenge in many industrial effluents, where the carbon-to-nitrogen ratio may be too low to support adequate denitrification rates. When influent BOD or COD is insufficient relative to the nitrogen load, denitrification stalls and nitrate accumulates in the final effluent. In such cases, external carbon sources, such as methanol, acetate, or other readily biodegradable organics, may need to be dosed into the anoxic zone to supplement the available carbon. 

(Note: Required C:N ratios are indicative and vary significantly with system configuration and influent characteristics.)

Anoxic Zone Design

Denitrification requires an environment where oxygen is absent but nitrate is available. This is the anoxic zone, a specific volume within the biological treatment system where dissolved oxygen is maintained at near-zero levels. In conventional activated sludge systems, MBRs, and SBRs, the configuration and sequencing of aerobic and anoxic zones is a critical design and operational variable. Both the volume of the anoxic zone and its hydraulic retention time (HRT) within that zone determine how completely denitrification can proceed.

Temperature

Like nitrification, denitrification rates are temperature-dependent. Cold conditions slow microbial metabolism and can cause denitrification performance to degrade seasonally. (Site-specific ranges apply; consult a qualified engineer.)

Nitrate Recycling

In pre-denitrification systems, where the anoxic zone precedes the aerobic nitrification zone, nitrate must be recycled from the aerobic effluent back into the anoxic zone through an internal recycle stream. The recycle ratio directly controls how much nitrate is available for denitrification and therefore how completely total nitrogen can be removed. Getting the recycle ratio right is one of the more nuanced operational adjustments in a BNR system.

Difference Between Nitrification and Denitrification, A Practical Comparison

For engineers who need to communicate this distinction clearly, whether in internal reports, client briefings, or regulatory documentation, the following comparison captures the essential differences:

ParameterNitrificationDenitrification
Primary organismsAutotrophic bacteria (AOB, NOB)Facultative heterotrophic bacteria
Electron acceptorDissolved oxygen (O₂)Nitrate / Nitrite (NO₃⁻ / NO₂⁻)
Environmental conditionAerobicAnoxic
Carbon requirementNone (autotrophic)Yes (BOD/COD required)
End productNitrate (NO₃⁻)Nitrogen gas (N₂)
Role in nitrogen removalConverts ammonia to nitrateRemoves nitrate as N₂ gas
Rate sensitivityHighly sensitive (slow-growing)Moderately sensitive

The key takeaway: nitrification transforms nitrogen; denitrification removes it. Both processes are required for true total nitrogen removal from wastewater.

Common Process Failures and How Engineers Diagnose Them

Process failures in biological nitrogen removal are frustratingly common, and they rarely announce themselves clearly. Here are the most frequently encountered failure modes and their diagnostic indicators:

Rising effluent ammonia despite adequate aeration

This typically points to nitrifier inhibition, nitrifier washout due to insufficient SRT, or a toxic loading event. The first diagnostic step is to verify DO levels in the aeration zone, confirm the actual SRT being achieved in the system, and review whether any unusual influent characteristics coincided with the performance decline.

Incomplete denitrification and rising effluent nitrate

When ammonia is adequately removed but nitrate climbs in the final effluent, the anoxic zone is underperforming. Common causes include insufficient carbon source (low C:N ratio), inadequate anoxic zone HRT, excessive internal recycle oxygen carry-over, or temperature suppression during cold months.

pH instability affecting both processes simultaneously

If pH is oscillating or trending downward, the first place to look is alkalinity balance. Nitrification consumes alkalinity; if the system’s buffering capacity is overwhelmed, pH destabilization can suppress nitrification directly, which then creates ammonia accumulation, a compound failure that can be difficult to reverse without systematic intervention.

Seasonal performance collapse

Temperature-driven performance drops in winter are predictable but still catch operators off guard. The response toolbox includes extending SRT where possible, reducing hydraulic loading temporarily, and in more severe cases, supplementing with external nitrifying and denitrifying bacterial cultures through bioaugmentation.

Many of these failures are rooted not in equipment design but in the biology, specifically, in the health, population density, and metabolic activity of the nitrifying and denitrifying microbial communities. A plant with well-designed infrastructure but a compromised biological community will consistently underperform.

Team One Biotech offers specialized nitrification and denitrification bacterial consortia, formulated for Indian effluent characteristics and CPCB compliance targets. Contact our technical team for a plant-specific recommendation.

Bioaugmentation as a Solution, When Native Microbiology Is Not Enough

Industrial ETPs operate under conditions that are genuinely hostile to biological communities. High and variable toxic loads, temperature swings, intermittent operation, shock loads from batch processes, these conditions suppress native nitrifier and denitrifier populations chronically, not just during acute upset events.

Bioaugmentation is the practice of adding concentrated, pre-adapted microbial cultures to an existing biological treatment system to reinforce or re-establish the microbial communities responsible for specific treatment functions. It is not a replacement for sound process design, but it is a highly effective tool for bridging the gap between what a system’s native biology can achieve and what CPCB or SPCB compliance requires.

For nitrification specifically, bioaugmentation allows plants to rebuild nitrifier populations far faster than natural growth rates would allow, reducing the time to stable compliance after a washout event from weeks to days. For denitrification, inoculating with robust denitrifying consortia adapted to low C:N industrial effluents can substantially improve nitrate removal rates without requiring major infrastructure changes.

Team One Biotech develops and supplies specialized nitrification and denitrification cultures engineered for the specific influent matrices, temperature ranges, and regulatory targets that Indian ETP and STP operators face. Our formulations have supported process recovery and compliance establishment across pharmaceutical, food processing, municipal, and specialty chemical sectors.

Frequently Asked Questions

What is the nitrification process in wastewater treatment?

The nitrification process is a two-stage aerobic biological conversion in which ammonia-nitrogen is first oxidized to nitrite and then further oxidized to nitrate by specialized autotrophic bacteria. It is a critical first step in biological nitrogen removal, though it does not by itself remove nitrogen from the system.

What organisms carry out nitrification?

Nitrification is carried out by two distinct groups of autotrophic bacteria. Ammonia-oxidizing bacteria (AOB), primarily Nitrosomonas spp., perform the first stage (ammonia to nitrite). Nitrite-oxidizing bacteria (NOB), primarily Nitrobacter spp., complete the second stage (nitrite to nitrate).

At what pH does the nitrification process cease?

The nitrification process operates within a specific pH window, and activity drops sharply outside of this range. At strongly acidic pH levels or highly alkaline conditions, nitrifier activity can cease almost entirely. The optimal range falls within moderate alkalinity, though the exact threshold at which nitrification process ceases at pH extremes is system-specific. (Note: Indicative only; actual thresholds depend on specific organism populations and operating conditions.)

What is the difference between nitrification and denitrification?

Nitrification converts ammonia to nitrate under aerobic conditions using autotrophic bacteria, while denitrification reduces nitrate to nitrogen gas under anoxic conditions using heterotrophic bacteria. Nitrification changes the form of nitrogen in the system; denitrification achieves actual removal of nitrogen from the wastewater.

What are denitrification bacteria in STP?

Denitrification bacteria in STP environments are facultative heterotrophs, organisms that can use either oxygen or nitrate as their terminal electron acceptor depending on the conditions. Key genera include Pseudomonas, Paracoccus, and Bacillus. These bacteria reduce nitrate and nitrite stepwise to nitrogen gas under anoxic conditions.

How does the carbon-to-nitrogen ratio affect nitrogen removal from wastewater?

Denitrification is a heterotrophic process that requires organic carbon as the electron donor. If the C:N ratio in the influent is too low, denitrification becomes carbon-limited and fails to reduce nitrate adequately, resulting in elevated nitrate in the treated effluent. External carbon dosing may be required in low-C:N industrial effluents.

Can nitrification and denitrification happen in the same tank?

Yes, this is the principle behind simultaneous nitrification and denitrification (SND), which is intentionally exploited in systems like sequencing batch reactors (SBRs) and certain MBR configurations. By creating micro-aerobic conditions or alternating aerobic and anoxic phases within a single vessel, both processes can be achieved in the same physical space, simplifying plant footprint requirements.

Compliance Is a Biology Problem as Much as an Engineering One

Nitrogen removal from wastewater through nitrification and denitrification is, at its core, a biological problem. The hydraulics can be right, the aeration equipment can be well-maintained, and the instrumentation can be calibrated perfectly, but if the microbial communities carrying out these processes are compromised, the plant will not achieve compliance.

Process engineers who understand the biochemistry of nitrification and denitrification, who know why nitrifiers wash out, why denitrification stalls when carbon is insufficient, and why pH instability cascades through both processes simultaneously, are far better equipped to maintain consistent performance and defend their effluent quality in front of a regulatory inspector.

The biology must be respected on its own terms. These organisms have requirements, sensitivities, and growth dynamics that do not bend to operational convenience. Meeting them consistently requires both good process design and a commitment to monitoring and maintaining the biological communities that do the actual work.

Team One Biotech has helped industrial and municipal plants across India achieve consistent CPCB and SPCB nitrogen compliance through our engineered bioremediation products. If your plant is facing nitrification failures, incomplete denitrification, or total nitrogen exceedances, talk to our specialists today. We will assess your current process and recommend a targeted biological solution, one designed for your specific effluent characteristics, regulatory targets, and operational constraints.

Visit our website or speak to a technical expert today.

Disclaimer: The values, ranges, and parameters discussed in this article are general indicative figures for reference and educational purposes only. Actual operating parameters, thresholds, and performance outcomes vary significantly based on the specific ETP/STP design, influent composition, hydraulic loading, temperature, and site-specific conditions. Always consult a qualified process engineer or technical specialist before making operational adjustments.

Looking to improve your ETP/STP efficiency with the right bioculture?
Talk to our experts at Team One Biotech for customised microbial solutions.

Contact: +91 8855050575

Email:  sales@teamonebiotech.com

Visit: www.teamonebiotech.com

Discover More on YouTube – Watch our latest insights & innovations!-

Connect with Us on LinkedIn – Stay updated with expert content & trends!
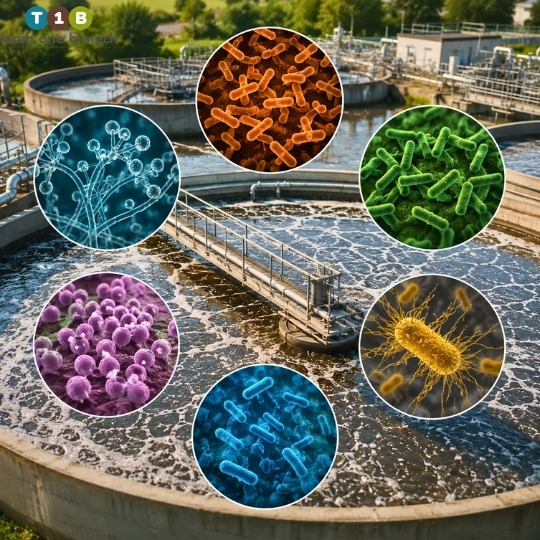
Scan the code