
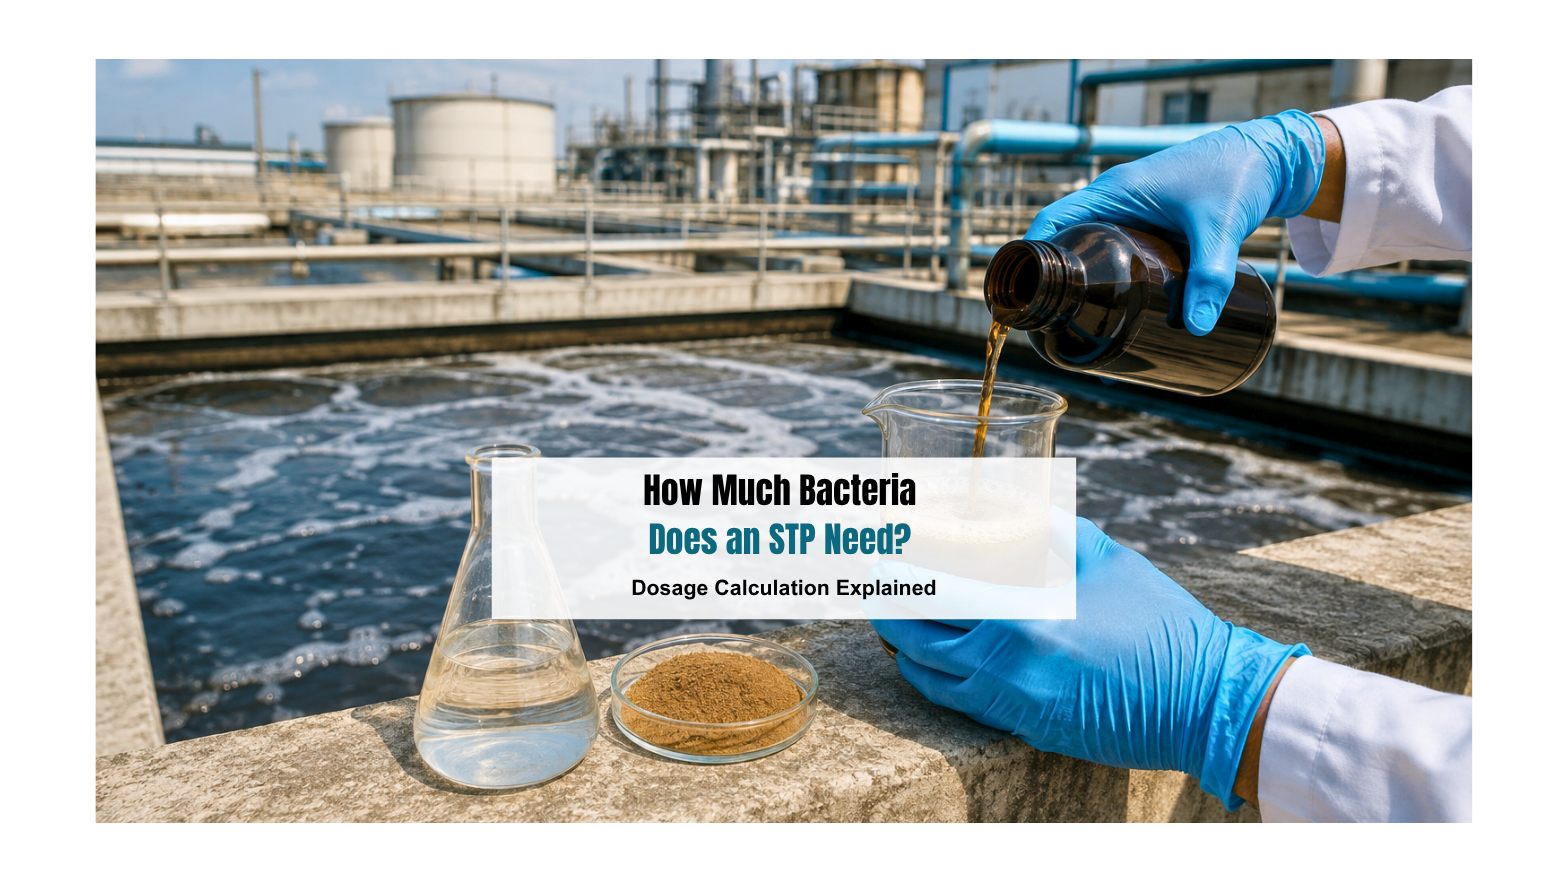

How Much Bacteria Does an STP Need? Dosage Calculation Explained
Underdose your bioculture and your STP begins to fail, BOD climbs, COD spikes, and the regulator’s notice arrives before you notice the problem. Overdose it and you are burning the budget without any performance gain. The question every STP operator eventually faces is the same: exactly how much bacteria does this plant need?
It is a deceptively simple question with a genuinely complex answer. STP bacteria dosage is not a single number you can read off a chart. It is a calculation, one that depends on where your plant currently stands biologically, how much organic load it is processing, and what product you are dosing. Get that calculation right, and your plant runs cleanly within CPCB norms. Get it wrong, and you are either fighting effluent violations or wasting money on bioculture that is doing nothing measurable.
This guide walks you through both the parameters you need to understand and the step-by-step framework for calculating bioculture dosage for your STP with confidence.
Why Getting the Dosage Wrong Costs More Than You Think
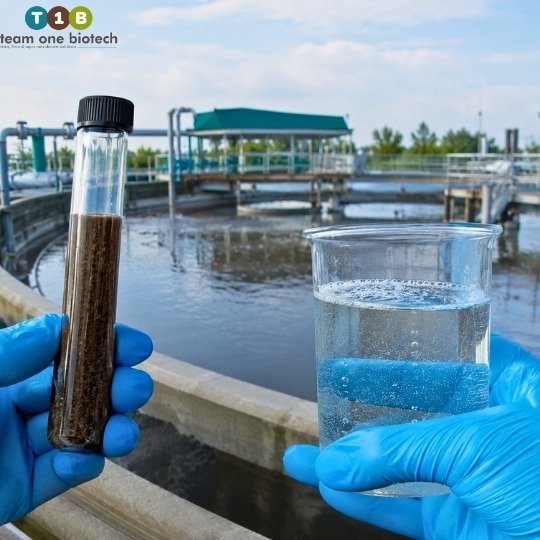
Most STP operators who struggle with dosage decisions are not making careless mistakes. They are working with incomplete frameworks. They know bioculture is necessary; they are less certain about how to size it correctly. That uncertainty has real consequences.
When you underdose, the biological community inside your aeration tank becomes numerically insufficient relative to the organic load arriving in your influent. The microorganisms present are overwhelmed. BOD and COD removal efficiency drops. The effluent that exits your secondary clarifier carries more suspended solids, more organics, and more biological oxygen demand than CPCB and SPCB discharge standards permit. What follows is familiar to any veteran operator, escalating notices, potential shutdowns, and the expense of emergency remediation that always costs far more than prevention would have.
Overdosing creates a different class of problem. Excess bacterial mass that cannot find sufficient food substrate does not simply disappear. It dies, autolyses, and contributes to your sludge burden. Sludge handling, dewatering, and disposal costs rise. Your F/M ratio shifts unfavourably. The additional bioculture product you purchased generates no treatment benefit. From a budget perspective, it is dead spend.
Both scenarios are preventable. The path between them is a structured, data-driven dosage calculation framework, and that is exactly what this article provides.
The Key Parameters You Must Know Before Calculating Dosage

Bacterial dosage calculation for sewage treatment plants is grounded in four operational parameters. Understanding these before touching a dosage calculator is not optional, it is the foundation everything else is built on.
Mixed Liquor Suspended Solids (MLSS)
MLSS is the concentration of suspended solids, biological and inert, in your aeration tank. It is the primary proxy for biological mass in an active STP. When operators talk about “how much biology is in the tank,” they are talking about MLSS.
A healthy, functioning STP aeration tank maintains MLSS within a range that balances sufficient microbial density with manageable sludge settleability. When MLSS falls below the lower threshold of that range, the biological community is too sparse to efficiently process incoming organic load. This is the primary trigger condition for bioaugmentation, the deliberate addition of concentrated external bioculture to supplement or rebuild the in-situ microbial population.
Disclaimer: The values mentioned above are general indicative ranges. Actual parameters vary significantly depending on plant design, influent composition, temperature, SRT, and operational history. Always calibrate dosages based on site-specific testing.
Food-to-Microorganism (F/M) Ratio
The F/M ratio describes the relationship between the organic food available in your system and the microbial population present to consume it. Think of it as a feeding balance. Too much food relative to microorganisms and your biology is overwhelmed, leading to poor BOD/COD removal. Too little food and you have excess biomass with nowhere to put its energy, leading to endogenous decay, poor sludge quality, and operational instability.
A balanced F/M ratio is the hallmark of a well-managed biological treatment process. When the ratio is off, the symptoms are visible in your aeration tank and clarifier: bulking sludge that refuses to settle properly, effluent turbidity that persists despite normal operations, and foam that builds up in ways it should not. Operators who regularly monitor F/M ratio alongside MLSS are equipped to catch these imbalances before they become compliance failures.
Disclaimer: Optimal F/M values are indicative and must be calibrated to individual plant conditions.
Organic Loading Rate (OLR)
Organic Loading Rate connects your influent quality to your biological demand. It is calculated from two variables you should be measuring consistently, your daily flow rate and the BOD or COD concentration of the incoming sewage. Together, these give you the total mass of organic material your system must process each day, typically expressed in kilograms of BOD or COD per day.
OLR matters for STP bacteria dosage because it directly determines how much biological mass your system needs. A plant receiving a high organic load requires a proportionally denser and more active microbial community to achieve the same treatment efficiency as a lightly loaded plant. This is why static dosage rules, “add this much per MLD”, consistently underperform. They ignore the actual organic challenge the biology is facing.
Seasonal and diurnal fluctuations in influent composition make OLR a moving target, which is why dosage decisions made annually or even quarterly tend to drift out of calibration over time.
Hydraulic Retention Time (HRT)
HRT is the average length of time that wastewater spends inside your aeration tank before moving to the clarifier. It determines how long your microbial population has to act on incoming organics before they pass through.
Shorter HRT means less contact time between biology and substrate. To compensate, your system needs a denser, more active microbial population, which pushes your dosage requirement upward. Plants with generous HRT have more contact time to work with and can achieve similar removal efficiencies at lower MLSS concentrations. When you are calculating bioculture dosage for your STP, HRT is a critical multiplier that shapes how aggressively you need to supplement your biological community.
Disclaimer: All parameter ranges and dosage figures referenced in this article are general indicative values intended for educational purposes. Actual bioculture dosage requirements vary significantly based on plant design, influent composition, temperature, HRT, SRT, and current biological health. Always conduct site-specific testing and consult a qualified process engineer before making dosage decisions.
How to Calculate Bioculture Dosage for Your STP, A Practical Framework
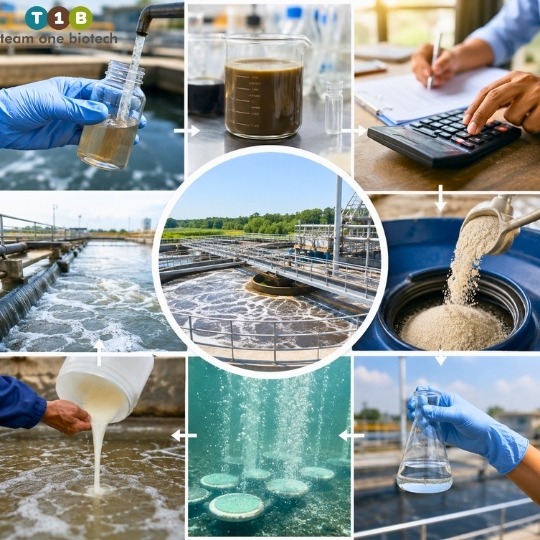
Now that the foundational parameters are clear, the dosage calculation itself becomes structured and logical. The important thing to understand at the outset is that bioculture dosage STP calculation is not a lookup, it is a function of your plant’s current biological health, its organic load, and the concentration of the specific product you are using. Here is how to work through it systematically.
Step 1, Assess Your Current Biological Health
Begin with a clear picture of where your aeration tank biology currently stands. Pull a fresh MLSS measurement. Compare it against the target MLSS range appropriate for your plant design and influent type.
The difference between your current MLSS and your target MLSS is your biomass deficit. This deficit is what your initial dosage must address. A plant that is operating at sixty percent of its target MLSS has a substantially larger deficit than a plant running at ninety percent, and the dosage required to correct the first condition is meaningfully larger than what the second needs.
If your plant is recovering from a biological crash, a high chlorine dosing event, a severe pH excursion, or a toxic influent spike, your effective MLSS may be significantly lower than what the reading suggests, because a portion of the suspended solids you are measuring may be dead or dying biomass rather than active, viable microorganisms. In these conditions, assume a larger deficit and plan a more aggressive corrective dose.
Step 2, Determine Your Organic Load
Calculate your current organic loading rate using your most recent influent flow and BOD or COD measurements. Express this as kilograms of BOD or COD per day.
This figure tells you what your biological system is being asked to process. From your plant design parameters or your baseline operational data, you should have a sense of the MLSS density required to process that specific load to the required effluent standard. If the MLSS required to handle your current organic load is higher than what Step 1 revealed you actually have, the difference further confirms the dosage requirement identified in Step 1.
For plants where influent quality is variable, residential STPs receiving fluctuating loads, commercial facilities with intermittent industrial discharge, calculate OLR on a rolling average rather than a single data point. This prevents you from dosing for a single high-load day and then being under-dosed the rest of the month, or vice versa.
Step 3, Factor in the Bioculture Concentration
Not all bioculture products are equivalent. The amount of product you need to achieve a target biomass addition depends directly on the viable cell count per unit volume or weight of the specific formulation you are using, expressed as CFU per millilitre or CFU per gram.
This is where generic “rules of thumb” reliably fail operators. A bioculture product with a high viable cell count delivers significantly more active biology per kilogram than a diluted or degraded product with lower CFU. Using the same dosage volume for both gives you very different biological outcomes.
Always work from the product data sheet. Obtain the specified potency, CFU/mL or CFU/g, and use that figure to convert your calculated biomass requirement into an actual product quantity. Team One Biotech’s bioculture formulations carry specified potency data, and dosing recommendations are built around product-specific parameters rather than general approximations. This is the difference between a calculated dose and a guessed one.
Step 4, Differentiate Between Startup and Maintenance Dosing
One of the most common bioculture dosage STP errors is applying the same dosage logic to two fundamentally different scenarios: startup and maintenance. These are not the same situation, and treating them identically produces consistently poor results.
Startup dosing applies when you are seeding a new plant, restarting after shutdown, or recovering from a biological crash. The objective is to establish or re-establish a functional microbial population from a near-zero baseline. This requires a significantly higher dose, sometimes multiples of what the steady-state maintenance dose will be, delivered over a compressed initial period, with daily monitoring to track the biological response.
Maintenance dosing applies during normal operations when a functioning microbial population already exists. The objective here is to replenish natural die-off, compensate for washout via sludge wastage, and sustain the target MLSS and F/M ratio over time. Maintenance doses are lower in volume, applied at regular intervals, and adjusted based on the monitoring trends that emerge between doses.
A practical way to think about the distinction:
- Startup scenario, higher dose volume, shorter dosing interval, daily MLSS and SVI monitoring, response assessment within the first 72 to 96 hours, dose adjustment based on observed ramp-up rate
- Maintenance scenario, lower dose volume, weekly to monthly interval depending on plant stability, monitoring tied to routine operational checks, adjustments triggered by trend deviation rather than daily variation
Disclaimer: All parameter ranges and dosage figures referenced in this article are general indicative values intended for educational purposes. Actual bioculture dosage requirements vary significantly based on plant design, influent composition, temperature, HRT, SRT, and current biological health. Always conduct site-specific testing and consult a qualified process engineer before making dosage decisions.
Step 5, Monitor, Adjust, and Log
STP bacteria dosage is not a set-and-forget decision. Biological systems are dynamic. The organic load your plant receives today may not be what it receives in six weeks. Seasonal shifts, population changes, industrial discharge patterns, and temperature fluctuations all alter the biological demand on your system, and your dosage must track those changes.
After each dosing cycle, monitor MLSS, Sludge Volume Index (SVI), and effluent BOD and COD. These three metrics together tell you whether the biology is responding as expected. Rising SVI alongside stable or declining MLSS is a warning sign. Effluent quality that is not improving in proportion to your dosage suggests either a product quality issue or an environmental stressor that is suppressing biological activity.
Maintain a dosing log, dates, quantities, product batch, pre- and post-dose measurements, and any operational anomalies. Beyond helping you optimise your dosage protocol over time, this log is a critical asset during regulatory audits. A well-documented dosing record demonstrates biological process management competence to CPCB and SPCB inspectors in a way that verbal assurances simply cannot.
Common Dosage Mistakes That Lead to Compliance Failures
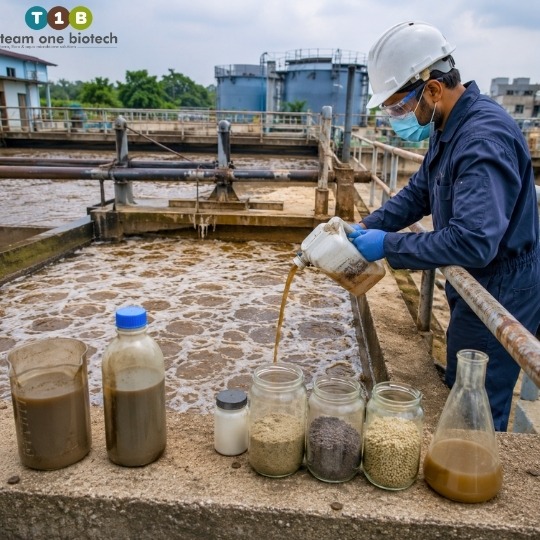
Even operators who understand the calculation framework can fall into patterns that undermine their results. These are the most consistently observed mistakes that contribute to effluent quality failures and regulatory non-compliance:
- Dosing based on tank volume alone, without calculating actual organic load, this produces arbitrary numbers that have no biological basis
- Applying a single fixed dose year-round despite significant seasonal variation in influent temperature, flow, and concentration
- Skipping post-dose monitoring and assuming the bioculture is working without verifying effluent quality or MLSS response
- Selecting bioculture products with unverified or inflated CFU claims, a product with poor viability delivers far less biology than the label suggests, even when dosed correctly
- Failing to identify environmental stressors, chlorine carry-over, pH shock, or antibiotic contamination in the influent, that kill dosed bacteria before they can establish
- Treating bioculture dosage as a one-time corrective action rather than an ongoing biological management practice integrated into routine operations
Each of these mistakes is correctable. But all of them become much less likely when the dosage process is grounded in structured monitoring and documented methodology.
Why Bioculture Quality Is as Important as Dosage Quantity
A precisely calculated dose of a poor-quality bioculture product delivers poor results. The dosage calculation framework described above assumes that the product you are dosing contains the viable microbial population it claims to contain. When that assumption fails, because the product was stored incorrectly, has passed its effective shelf life, or was formulated with inadequate strain diversity, the calculation breaks down at the last step regardless of how accurately the first four steps were executed.
When evaluating bioculture products for your STP, the quality markers that matter operationally are viable cell count expressed as CFU per unit, strain diversity appropriate to the treatment objective (BOD and COD degradation, nitrogen removal, or a combined profile), shelf life and storage requirements, and compatibility with your plant’s operating temperature and pH range.
Team One Biotech’s bioculture formulations are developed specifically for sewage treatment applications under Indian operating conditions, accounting for the influent characteristics, temperature ranges, and regulatory standards that define the compliance environment most operators in this market are working within. The technical specifications behind each product are designed to support accurate dosage calculations, not approximate them.
Talk to our process engineers to get a dosage recommendation tailored to your plant’s capacity and current MLSS levels. Contact Team One Biotech.
Frequently Asked Questions
How do I know if my STP is underdosed with bioculture?
Signs include rising effluent BOD and COD beyond discharge limits, poor sludge settling in the secondary clarifier, a thin and visually pale MLSS, persistent foam or odour from the aeration tank, and an SVI that is trending upward without a corresponding increase in organic load.
Can I add too much bioculture to an STP?
Yes. Excessive dosing upsets the F/M ratio by creating more biological mass than the available food substrate can support. The result is increased sludge production without proportional treatment improvement, higher sludge handling costs, and potential secondary effects on clarifier performance. More bioculture is not always better, calibrated bioculture is better.
How often should bioculture be dosed in an STP?
Dosing frequency depends on your operational phase. During startup or biological recovery, dosing intervals are short and monitoring is intensive. During steady-state maintenance operations, intervals typically range from weekly to monthly, but this must be determined based on your specific plant’s MLSS trends, organic loading patterns, and sludge wastage rate. There is no universal answer.
Disclaimer: Dosing frequency ranges referenced here are general indicative values. Actual intervals must be determined based on site-specific monitoring.
Does temperature affect bioculture dosage requirements?
Yes, significantly. Microbial metabolic activity is temperature-dependent. In colder months, or in plants operating in lower ambient temperature conditions, enzymatic reaction rates slow, microbial growth rates decline, and the biological system’s ability to process organic load at a given MLSS density is reduced. This typically requires higher or more frequent dosing during cold periods to maintain equivalent treatment performance.
What is the difference between seed culture and maintenance culture in an STP?
Seed culture establishes a new microbial population in a plant that has none, either during initial commissioning or after a biological crash. It requires a high-volume, high-frequency dosing protocol until the MLSS reaches a functional level. Maintenance culture sustains an already-established population during normal operations. The two products may be similar in microbial composition but differ significantly in required dosage volume and application frequency.
Conclusion, Dose Right, Stay Compliant
Getting STP bacteria dosage right is not guesswork, and it is not a fixed number on a product label. It is a structured, data-driven process grounded in four operational parameters, MLSS, F/M ratio, organic loading rate, and HRT, translated into a product quantity through your bioculture’s specified potency, and differentiated clearly between startup and maintenance scenarios.
Plants that manage bioculture dosage STP correctly through this kind of structured approach consistently outperform those that rely on intuition, historical habit, or generic rules of thumb. The biological system is stable. Effluent quality is predictable. Regulatory compliance with CPCB and SPCB discharge norms is far easier to maintain when your aeration tank biology is neither starved nor overwhelmed. The operators who get this right are not doing anything exotic, they are simply working with a proper calculation framework and monitoring their results.
BOD and COD reduction targets are achievable. MLSS in the healthy range is maintainable. The compliance record you want is within reach, but it requires treating bacterial dosage calculation for sewage treatment as the disciplined, ongoing biological management practice it is.
Team One Biotech offers both high-quality bioculture products formulated for Indian STP operating conditions and the technical support to help you calculate and implement the right dosage strategy for your specific plant.
Do not leave your STP’s compliance to chance. Reach out to Team One Biotech’s technical team today for a plant-specific bioculture dosage assessment, and keep your effluent consistently within discharge limits.