

Schedule VI Standards for Plant Managers (Without the Legalese)
It is 5:40 a.m. and your phone buzzes before the shift even starts. The OCEMS dashboard shows COD creeping upward, and it is not coming back down. Your stomach drops. You start running the checklist: blower status, last night’s batch discharge, sludge in the clarifier. Then comes the thought nobody likes to say aloud. What if the SPCB calls before you have an answer?
One show-cause notice can turn into a closure direction faster than anyone expects. If this feels familiar, you are not alone. This guide translates Schedule VI effluent standards into plain language, so you know exactly what you are being measured against.
Want a quick-reference compliance checklist for your ETP? Request your free copy from Team One Biotech and keep it at the control room desk.
What Schedule VI Effluent Standards Actually Are

Schedule VI sits inside the Environment (Protection) Rules, 1986. It lists the general discharge standards that apply to treated effluent leaving a plant. CPCB discharge standards are largely built on this schedule, and State Pollution Control Boards (SPCBs) use it as their starting point when they frame conditions for individual units.
In practical terms, think of it as the minimum bar. It says, “Whatever your industry, treated water leaving your gate should not look worse than this.”
Here is the part many teams miss. The general standards are a baseline, not a ceiling for strictness. Many industries also have their own sector-specific effluent norms, and your SPCB can set tighter limits for your plant based on the receiving water body, local pollution load, or your location. Those stricter conditions sit inside your Consent to Operate (CTO).
So who does it apply to? Almost every industrial unit that discharges treated effluent, and sewage treatment plants too, in one form or another. If you run an ETP or STP, these standards are part of your reality, even if your CTO has rewritten some of the numbers.
Any figures you see in this guide are broad indicative ranges. Actual limits differ by industry, discharge pathway, and your Consent to Operate.
The Four Discharge Pathways: Why Where Your Water Goes Changes Everything
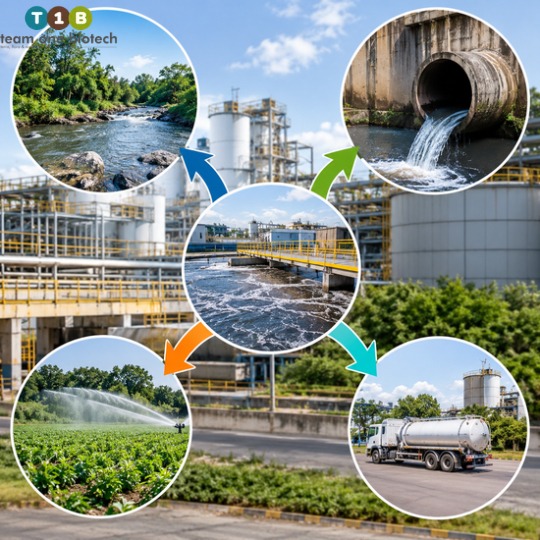
The same effluent can be acceptable at one discharge point and a violation at another. That is why the pathway matters before you look at any single parameter. Schedule VI groups discharge into four broad routes.
Inland Surface Water Discharge
This covers rivers, streams, canals, and similar water bodies. It is usually the strictest pathway for most parameters, because the water goes straight into a natural system that other people depend on. If your outfall reaches a river, expect tight limits and close scrutiny.
Public Sewer Discharge
Here, your treated effluent goes into a municipal sewer and on to a common treatment plant. Limits for organic load are generally more relaxed, because the downstream plant does more of the work. Limits on oil and grease, heavy metals, and anything that could damage the sewer network or upset the downstream biology still matter.
Land for Irrigation
When treated water is used on land, the concern shifts toward soil and crop health. Salts, specific toxic compounds, and certain nutrient forms become important, and the standards for some parameters look different from the other pathways.
Marine Coastal Discharge
Discharge into coastal and marine areas has its own set of conditions. The sea dilutes differently from a river, so some limits are relaxed while others, particularly toxic and persistent substances, are watched carefully.
Before you compare yourself against any limit table, confirm which pathway your CTO actually names.
Ranges across pathways can differ widely. Actual limits depend on industry, discharge pathway, and your Consent to Operate.
Parameter-by-Parameter Breakdown: What the Numbers Mean on the Floor

Here is a quick translation of the eight parameters most plant managers deal with. Use the ranges below to build intuition, not to set targets.
| Parameter | Pathway relevance | What it means on the floor |
| BOD | Strictest for inland surface water; looser for sewer | Shows how much biodegradable organic load is left. Typically in the range of roughly 20 to 100 mg/L across pathways. Rising BOD points to weak biology or low oxygen. |
| COD | Applies broadly; limits vary with industry | Captures both biodegradable and stubborn organics. Roughly 150 to 300 mg/L is a common band across general standards. A high COD to BOD gap points to hard-to-degrade compounds. |
| TSS | Looser for sewer, tighter for surface water and land | Solids carried out with the water. Roughly 50 to 600 mg/L depending on pathway. Usually a clarifier or sludge settling issue. |
| pH | Required across all pathways | Needs to sit in a band around neutral, from mildly acidic to mildly alkaline. A drift stresses microbes quickly. |
| Oil and Grease | Important for surface water and sewers | Typically single digits to low tens of mg/L. Fats and oils coat biomass and block oxygen transfer. |
| Ammoniacal Nitrogen | Mostly for surface water; relevant to some industries | Roughly 30 to 60 mg/L is a common general band. High values signal weak nitrification or low dissolved oxygen. |
| Heavy Metals | Pathway and metal-specific | Often fractions of a mg/L to low single digits, metal by metal. Biological treatment cannot remove them reliably. |
| Temperature | Mainly for surface water and marine discharge | Usually limited to a small rise above the receiving water or ambient conditions. Warm effluent affects dissolved oxygen downstream. |
These are general ranges. Actual limits differ by industry, discharge pathway, and your Consent to Operate.
What the Parameters Tell You About Your Biology
A few patterns are worth keeping in your head.
- BOD and COD: If BOD is stubborn, check aeration intensity first. Is dissolved oxygen steady across the tank, or are there dead zones? If COD is high while BOD is acceptable, you are probably dealing with non-biodegradable load, and a longer retention time or a pre-treatment step may be needed.
- Ammoniacal nitrogen: Nitrifying bacteria are slow growers and very sensitive. Low oxygen, low alkalinity, or toxic shocks can knock them out. If this parameter drifts, look at sludge age and oxygen supply.
- TSS: Poor settling often traces back to filamentous bulking, an overloaded clarifier, or sludge that is too old or too young.
- pH: Check dosing systems and equalization first. Sudden swings usually come from upstream, not from the biology itself.
- Oil and grease: Fit or maintain proper skimming at the front end. Once oil reaches the aeration tank, it is a headache.
- Heavy metals: These need chemical precipitation or dedicated treatment, and they can inhibit your biology if allowed to build up.
- Temperature: Warm effluent from process cooling or summer heat reduces oxygen solubility and speeds up microbial demand. You may need more aeration just to hold the same performance.
Need a second pair of eyes on your ETP numbers? Book a free plant review or technical consultation with Team One Biotech and let our team look at your trends with you.
When Your CTO Is Stricter Than Schedule VI

Let us be direct. Your Consent to Operate is the document that governs your plant. Not the general schedule, not a generic limit table you found online.
An SPCB can set tighter limits than the general standards for several reasons: your industry has a specific norm, your outfall is close to a sensitive water body, your area is already pollution-stressed, or your past compliance record suggests closer monitoring. Some CTOs add parameters that the general schedule does not emphasize, such as specific nutrients, color, or particular chemical compounds. Others set conditions on OCEMS connectivity, data reporting, or discharge timing.
So how do you check where you stand?
- Pull out your latest CTO and read the effluent conditions line by line.
- Mark every parameter and the discharge pathway it applies to.
- Compare those limits with your recent lab and OCEMS data.
- Flag anything running close to the edge, even if it has never actually failed.
Treat your CTO as your working document and Schedule VI as background. If the two differ, the stricter condition for your plant is the one that counts when the inspector arrives.
The consequences are real. OCEMS alerts can trigger a call or a notice. Repeated or serious exceedances can lead to show-cause notices, environmental compensation, and operational restrictions. Nobody wants to explain a pattern of excursions in a hearing room.
CTO limits can sit well below general ranges. Actual limits differ by industry, pathway, and your Consent to Operate.
Common Plant-Floor Mistakes That Lead to Exceedances
After years of looking at ETPs, the same causes keep turning up. Most of them are fixable without a major capital project.
- Undersized or poorly distributed aeration. Blowers that were fine at commissioning may no longer match your load. Fouled diffusers cut oxygen transfer without anyone noticing.
- Shock loading. A batch dump, a cleaning cycle, or a sudden process change sends a slug of load to the biology. Microbes that were doing fine yesterday collapse overnight.
- Weak equalization. If the equalization tank is too small, poorly mixed, or bypassed, your biological stage sees every swing in flow and strength.
- Sludge age mismanagement. Wasting too much sludge starves your biology. Wasting too little leaves you with old, sluggish biomass and settling problems. Do you track sludge age or just guess?
- Ignoring seasonal temperature swings. Winter slows microbial activity and summer cuts oxygen. A plant that holds steady in one season can slip in the next.
- Missing the early warning signs. Slight color change, foaming, or odor often shows up days before the lab numbers move.
Ask yourself a simple question. When did you last check your dissolved oxygen profile across the tank, not just at one point? Small habits like this prevent a lot of 5:40 a.m. phone calls.
The ranges mentioned earlier are general. Actual limits and treatment performance vary by plant.
How Bioremediation Helps You Stay Inside the Limits
Biological treatment depends on a healthy, active microbial population. When that population is disturbed by shock loads, toxic inputs, or seasonal changes, performance suffers. That is where bioremediation can support you.
Bioremediation solutions use selected microbial cultures and supporting formulations to strengthen and stabilize the biology already working in your ETP. In practice, this can help in several ways:
- Stabilizing the biology during startup, restart, or after a disturbance.
- Supporting recovery after a shock load or temporary toxic event.
- Improving consistency in BOD and COD removal when influent quality varies.
- Supporting treatment of difficult organics that standard biomass struggles with.
To be clear, bioremediation is not a magic fix. It works best alongside sound design, proper aeration, good equalization, and disciplined operation. Results depend on your effluent, your plant design, and how it is run. Team One Biotech’s approach is to understand your plant first and then recommend what is practical, not to promise outcomes that your site conditions cannot support.
Talk to Team One Biotech’s technical team about your ETP’s biology, and find out whether a bioremediation program suits your plant.
Staying Ahead of the Next Inspection
Schedule VI effluent standards give you the baseline. Your CTO gives you the real target. The gap between them, and the habits you build to stay safely inside both, is where compliance is won or lost.
Know your pathway. Know your CTO. Watch your trends, not just your pass or fail days. And treat every small drift as a message from your biology, not as noise.
Do not wait for the next OCEMS alert. Speak to a Team One Biotech specialist today and get your ETP ready for the next inspection.
Frequently Asked Questions
Is Schedule VI the same as my Consent to Operate limit?
No. Schedule VI sets general baseline standards under the Environment (Protection) Rules, 1986. Your Consent to Operate is plant-specific and can be stricter. If the two differ, follow your CTO, as it is the governing document for your site.
Do Schedule VI standards change with the discharge pathway?
Yes. Limits depend on whether treated effluent goes to inland surface water, a public sewer, land for irrigation, or marine coastal areas. The same effluent can pass for one pathway and fail for another.
What happens if my effluent exceeds the permitted limits?
Exceedances can trigger OCEMS alerts, SPCB notices, show-cause proceedings, environmental compensation, or operational restrictions. The exact action depends on severity, frequency, and your consent conditions, so review your CTO and act early.
Disclaimer: The values and ranges mentioned in this article are general indicative figures. Actual discharge limits and treatment performance differ for every ETP depending on industry type, discharge pathway, SPCB consent conditions, and site-specific design. Always refer to the latest official gazette notification and your own Consent to Operate before taking operational decisions.
Looking to improve your ETP/STP efficiency with the right bioculture?
Talk to our experts at Team One Biotech for customised microbial solutions.
Contact: +91 8855050575
Email: sales@teamonebiotech.com
Visit: www.teamonebiotech.com
Discover More on YouTube – Watch our latest insights & innovations!-
Connect with Us on LinkedIn – Stay updated with expert content & trends!