


OCEMS Explained: What Regulators Now See in Real Time
It is well past midnight when your phone buzzes. It is not the control room, and it is not your shift supervisor. It is an automated alert. A single parameter at your outlet has crossed its limit, and the regulator’s dashboard has already flagged it.
Nobody has called you yet. Nobody needs to. The data is already visible, and you have not had a chance to explain anything.
This is the reality of OCEMS requirements today. Online continuous effluent monitoring has changed who sees your plant’s performance, and when. In this guide, you will learn what the system measures, how the data reaches the regulator, what patterns it exposes, and how to keep your biology stable enough to stay out of trouble.
What Is OCEMS and Why Does It Matter Now?
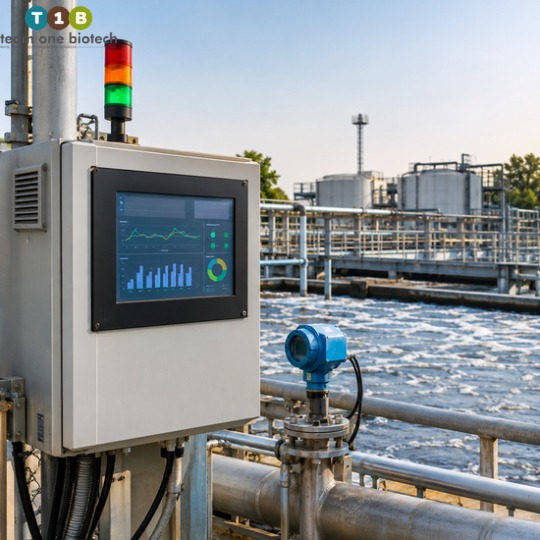
OCEMS stands for Online Continuous Effluent Monitoring System. In plain language, it is a set of sensors, analyzers, and data systems installed at your effluent discharge point. They measure key quality and flow parameters continuously and send the readings to the Central Pollution Control Board (CPCB) and the State Pollution Control Board (SPCB) servers.
Think of it as the difference between a photograph and a live video feed.
For decades, compliance was judged on periodic sampling. An inspector visited, drew a sample, a lab tested it, and the result represented a moment in time. A plant could be compliant on inspection day and struggling on every other day, and the system had limited ways to tell.
That gap is exactly what regulators set out to close. Mandates expanded because periodic sampling could not capture shock loads, night-time discharges, or short excursions. Continuous visibility lets authorities see how a plant behaves across shifts, seasons, and production cycles.
For you, this shifts the question from “Did we pass the inspection?” to “Is our ETP stable right now, and will the data prove it?”
OCEMS Requirements: What the Regulations Expect From Your Plant

Requirements are set by CPCB directions and implemented through each SPCB, so they vary by industry category, location, and the conditions in your consent to operate. Treat the following as a general map, not a substitute for your own documents.
- Covered industries: Typically, industries identified as significant polluters, including many in the highly polluting categories, along with large effluent generators and common effluent treatment plants. Applicability depends on category and consent conditions.
- Parameters monitored: Commonly pH, flow, COD, BOD (often through a proxy or correlation approach), and TSS. Some sectors carry additional parameters in their consents.
- Data transmission: Readings must reach the CPCB/SPCB servers continuously and reliably, through approved protocols and equipment configurations.
- Calibration and uptime: Sensors must be maintained, calibrated on a regular schedule, and kept operational. Extended downtime is itself a compliance concern.
- Data retention: Raw and processed data, calibration records, and maintenance logs generally need to be retained and made available when asked.
- Tamper resistance: Systems are expected to resist manipulation, with security features and audit trails that record access and changes.
Always verify the exact requirements against your consent to operate and the current CPCB/SPCB directions. Guidelines are revised, and what applied to a neighboring plant may not apply to yours.
Inside the System: Sensor Architecture and Data Flow

The simplest way to picture OCEMS is as a chain:
Sensor > Data Logger > Gateway > CPCB/SPCB Portal
If any link fails, the regulator sees the failure. Here is what each link does.
Sensors and Analyzers (COD, BOD or Proxy, TSS, pH, Flow Meter)
This is the measurement layer, and each parameter uses a different principle.
- pH: Electrode-based probes, sensitive to fouling and drift. They need regular cleaning and calibration.
- COD: Usually measured by optical or spectral analyzers, or by wet-chemistry analyzers in some setups. Optical units are often correlated against lab results for your specific effluent.
- BOD: Direct online BOD measurement is difficult, so many installations use a proxy or a correlation with COD and other signals. Your SPCB defines what is acceptable.
- TSS: Turbidity or suspended-solids sensors, which can be affected by color, bubbles, and fouling.
- Flow: Electromagnetic, ultrasonic, or open-channel flow meters that record discharge volume. Flow data is crucial because it reveals whether you are discharging more than your consent allows.
Data Logger, PLC, and Gateway
Sensor outputs feed a data logger or PLC, which time-stamps, stores, and formats the readings. The gateway then packages that data and pushes it to the regulator’s servers.
This layer also handles power-failure behavior, local buffering during connectivity loss, and security. A weak link here, such as an unprotected power supply or an unstable network, creates data gaps that look suspicious even when the effluent is fine.
Telemetry to CPCB/SPCB Servers
Data travels over approved communication channels to the central servers. Each reading carries a timestamp, a device identity, and status information. Transmission continuity matters as much as the values themselves.
How the Regulator Dashboard Displays Your Plant
On the regulator side, your plant appears as a live station. Authorities can typically view current readings, historical trends, status indicators for each analyzer, and alerts when readings cross limits or when data stops arriving.
Picture a color-coded status panel with a trend line behind every parameter. A single glance shows who is compliant, who is drifting, and who has gone quiet.
What Regulators Actually See in Real Time

Most plant managers worry about breaches. The system sees much more than that. A pattern is as visible as a breach, and sometimes more telling.
Here is what the dashboard can expose:
- Parameter spikes: A sudden jump in COD, TSS, or pH shows up immediately, along with how long it lasted and how fast it recovered.
- Repeated near-limit trends: A plant that hovers close to its limit day after day looks fragile. It signals a lack of treatment margin.
- Flat-line or frozen readings: Real effluent fluctuates. A reading that never moves suggests a stuck sensor, a disconnected probe, or manipulated data.
- Sudden zero or offline data: A parameter dropping to zero or the station going silent invites questions, especially if it coincides with production.
- Calibration irregularities: Unusual step changes after maintenance, or missing calibration records, raise concerns about data integrity.
- Power or connectivity gaps: Repeated gaps at similar times may point to a pattern rather than coincidence.
- Possible bypass or tampering patterns: Flow that does not match production, readings that behave unnaturally, or alerts from the tamper-detection features can all indicate that effluent is being diverted or data altered.
Notice what these have in common. None of them requires a lab test or an inspector’s visit. The system flags them on its own.
That is why a stable, well-managed plant is now the best defense. A quiet, predictable trend line is its own proof of control.
The Cost of Non-Compliance: Notices, Closure, and Bank Guarantees
The compliance framework rests on one expectation: uninterrupted alignment with CPCB and SPCB real-time telemetry protocols under the mandatory OCEMS guidelines. When alignment breaks, consequences can escalate quickly.
Automated electronic show-cause notices
When real-time data shows an exceedance, repeated near-limit behavior, or prolonged data loss, the system can trigger a show-cause notice electronically. The notice asks you to explain, and your response is judged against the data the regulator already holds.
Closure directives under Section 33A of the Water Act
Section 33A allows the State Pollution Control Board to issue directions, which can include closure, prohibition, or regulation of a process or industry, and in some cases the stoppage of utilities such as electricity or water. Persistent non-compliance or confirmed tampering can move a plant toward this stage.
Bank guarantee forfeiture
Many consents and compliance frameworks require a bank guarantee as a financial assurance. Real-time data exceedances or signal tampering alerts can become grounds for forfeiting it, depending on your conditions and the regulator’s directions.
The tone here is serious, not alarmist. Most plants never reach closure. But each step builds on the one before it, and a pattern that begins with ignored alerts can end with a financial or operational penalty. We have deliberately avoided quoting penalty amounts or timelines, since these depend on your consent conditions, your state, and current directions. Check your own documents.
Why Most Real-Time Breaches Start in the Biology, Not the Sensor
When an alert fires, the first instinct is often to blame the instrument. Sometimes that is fair. Sensors foul, drift, and fail.
But more often, the sensor is reporting reality accurately. The effluent really did change, and the cause is upstream, inside the biological treatment.
An activated sludge process or any other biological system is a living population. It responds to what you feed it. When conditions shift faster than the biology can adapt, the outlet shows it. Common root causes include:
- Shock loads: A sudden surge in organic load, a batch dump, or a cleaning-cycle discharge overwhelms the microbes.
- Poor equalization: Without a well-mixed buffer, variability reaches the biological reactor in full force.
- Nutrient imbalance: Too little nitrogen or phosphorus relative to carbon starves the biomass and weakens floc formation.
- Sludge bulking: Filamentous growth or poor settling carries solids over the clarifier weir, which shows up as a TSS excursion.
- Toxic inhibition: Biocides, heavy metals, solvents, or other inhibitory compounds suppress microbial activity.
- Seasonal and temperature swings: Biological rates slow in cold weather and can destabilize in extreme heat.
- Aeration issues: Insufficient or uneven oxygen transfer limits aerobic degradation. Excess aeration can damage floc structure.
Notice that none of these is fixed by recalibrating a sensor. They are fixed by stabilizing the process.
Is your ETP ready for what the dashboard sees? Talk to Team One Biotech’s technical team for an ETP performance review.
How to Prevent Real-Time Breaches for COD, BOD, TSS, pH, and Flow
Prevention works best in layers. Stabilize the biology, smooth the incoming load, and add microbial strength where the system needs it.
Biological Stabilization
A stable biological system has balanced food-to-microbe conditions, adequate oxygen, healthy sludge age, and the right nutrient ratio. The aim is a population that is resilient, not just active.
Practical steps include monitoring dissolved oxygen, watching sludge settling behavior, maintaining nutrient balance, and managing return sludge sensibly. Stable biology flattens the trend lines the regulator sees.
Buffer and Equalization Management
Equalization is your first line of defense against variability. A well-managed equalization tank, with adequate mixing, controlled pumping, and sensible retention time, turns an erratic influent into a steadier one.
Pay attention to pH adjustment before the biological stage, to avoiding dead zones that cause settling or septic conditions, and to scheduling high-strength batch discharges so they enter gradually rather than all at once.
Targeted Bioaugmentation
Bioaugmentation introduces specialized microbial consortia selected for the compounds and conditions in your effluent. Used well, it helps strengthen the existing biomass rather than replacing it.
Targeted bioaugmentation for an ETP can help in several ways. It can improve degradation of difficult organics, support faster recovery after a shock load, improve floc quality and settling, and add resilience when conditions swing. It does not replace good operation, but it supports stability and reduces the risk of breaches.
Parameter-versus-Remedy Map
| Parameter | Typical Cause of Spike | Biological / Operational Remedy |
| COD | Shock organic load, inhibited biomass, recalcitrant compounds | Better equalization, load scheduling, targeted bioaugmentation, nutrient balancing |
| BOD | Insufficient aeration, low microbial activity, short contact time | Improve oxygen transfer, stabilize biomass, support with specialized consortia |
| TSS | Sludge bulking, poor settling, clarifier overload | Control sludge age, manage filamentous growth, optimize clarifier operation |
| pH | Unneutralized process streams, chemical dosing errors | Equalization with pH correction, dosing control, buffer capacity management |
| Flow | Uncontrolled discharge, stormwater ingress, batch releases | Flow equalization, sensible discharge scheduling, leak and ingress checks |
A Practical OCEMS Readiness Checklist
Use this as a starting point for your plant team. Adapt it to your consent and your system.
- Confirm which parameters and reporting conditions apply under your consent to operate and current CPCB/SPCB directions.
- Review trend data regularly, not just at month end, and look for near-limit behavior and frozen readings.
- Keep calibration, cleaning, and maintenance schedules documented, current, and traceable.
- Protect the data chain with backup power for loggers and gateways, and a stable, monitored network connection.
- Check equalization performance: mixing, pH correction, and handling of batch discharges.
- Track biological health indicators such as dissolved oxygen, sludge settling, nutrient balance, and microscopic observations.
- Set internal alert thresholds below your regulatory limits so your team reacts before the regulator does.
- Write a response protocol for alerts, covering who acts, who documents, and who communicates with the SPCB.
- Review the system for tampering exposure: access controls, audit trails, and seal integrity.
Want to know where your biology is most exposed? Request a site-specific bioaugmentation assessment from Team One Biotech.
FAQs
Who needs to comply with OCEMS requirements?
Applicability is set by CPCB directions and implemented by each SPCB. It generally covers industries in specified polluting categories, larger effluent generators, and common effluent treatment plants. Your consent to operate and current SPCB communications are the authoritative sources. If you are unsure, confirm directly with your regional office.
What happens if OCEMS data shows an exceedance?
The system can generate an automated alert and, if the exceedance is significant or repeated, an electronic show-cause notice. Continued non-compliance can lead to directions under Section 33A of the Water Act, and financial consequences such as bank guarantee forfeiture. The response depends on your consent conditions and the regulator’s assessment.
Can bioaugmentation help stabilize effluent parameters?
Bioaugmentation can help support stability when it is matched to your effluent and applied alongside good operation. Specialized microbial consortia may improve degradation of difficult organics and help the system recover from shock loads. It is not a standalone fix, and results depend on your process, conditions, and how well the ETP is managed.
How often should sensors be calibrated?
Calibration frequency depends on the sensor type, the effluent, the manufacturer’s guidance, and what your SPCB specifies. Fouling-prone sensors generally need more frequent attention. Follow the schedule in your consent and system documentation, and keep clear records, since calibration history is part of what regulators may review.
Make Your ETP OCEMS-Ready
Go back to that midnight alert. The data was visible before you could explain it. That is the defining feature of online continuous effluent monitoring: the regulator sees what your plant is doing as it happens.
The good news is that sensors are honest messengers. If your biology is stable, your equalization is well managed, and your microbial population is resilient, the trend lines tell a calm, credible story. Understanding OCEMS requirements is the first step. Stabilizing the biological process behind every reading is the step that keeps you compliant.
Do not wait for the next real-time alert. Speak to the Team One Biotech experts today and make your ETP OCEMS-ready.
Disclaimer: The information in this post is general guidance. All values, ranges, and parameters referred to are general and indicative. Actual figures differ for every ETP depending on industry, process, influent characteristics, and regulatory consent conditions. Always verify requirements against your own consent to operate and the current CPCB and SPCB directions. Outcomes from any treatment approach depend on site-specific conditions and are not guaranteed.
Looking to improve your ETP/STP efficiency with the right bioculture?
Talk to our experts at Team One Biotech for customised microbial solutions.
Contact: +91 8855050575
Email: sales@teamonebiotech.com
Visit: www.teamonebiotech.com
Discover More on YouTube – Watch our latest insights & innovations!-
Connect with Us on LinkedIn – Stay updated with expert content & trends!