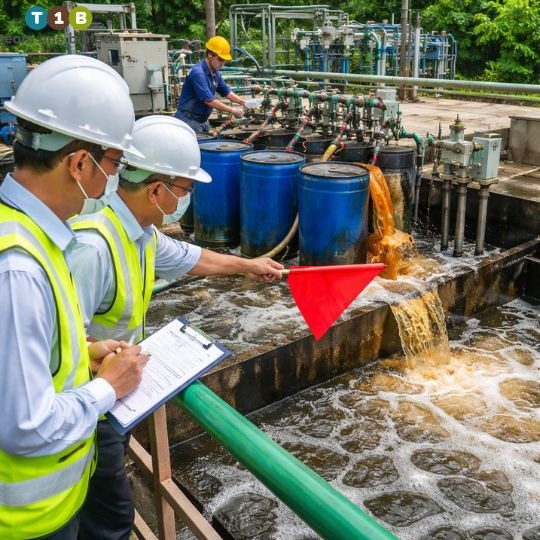
The anxiety that grips every factory manager in India isn’t about production targets anymore, it’s about compliance. The Polluter Pays principle isn’t just a headline in The Hindu or Economic Times. It’s a direct debit from your company’s bank account when the State Pollution Control Board slaps a show-cause notice on your facility.
The new Solid Waste Management Rules 2026 and stricter CPCB guidelines have fundamentally altered the industrial compliance landscape. Online Continuous Emission Monitoring Systems (OCEMS) are watching your discharge parameters 24/7. The grace period for “we’ll fix it next quarter” is over. The Central Pollution Control Board isn’t just auditing paperwork, they’re auditing your real-time data streams, your chemical procurement patterns, and even your groundwater quality.
Meanwhile, your chemical supplier just increased prices on Ferrous Sulfate and Poly Aluminium Chloride (PAC) by 18% this year. Your ETP is hemorrhaging money, producing mountains of hazardous sludge, and still barely meeting the discharge standards for COD and BOD, highlighting the urgent need for Environmental Compliance & Bioremediation Solutions for Industrial Wastewater Treatment that reduce chemical dependency and long-term operating costs.
If this sounds familiar, you’re not alone. But you are running out of time.
This is your 10-point survival guide, not from a textbook, but from the field. From factories that have passed their audits without a single rupee in fines, and from those who’ve transformed their ETPs from cost centers into strategic assets.
The 10-Point Checklist: Your SPCB/CPCB Audit Armor
1. Valid CTE/CTO Status: The Digital Renewal Trap
Consent to Establish (CTE) and Consent to Operate (CTO) are no longer manila folders gathering dust in your compliance office. In 2026, SPCBs across Maharashtra, Tamil Nadu, Gujarat, and Karnataka have moved to digital consent management systems. Your renewal isn’t valid until it’s reflected in the online portal.
Action Item: Log into your state’s SPCB portal (e.g., Maharashtra’s MPCB OCMMS) 60 days before expiry. Upload your annual environmental statement, stack monitoring reports, and effluent analysis certificates. Don’t wait for the reminder email, it doesn’t always arrive.
Red Flag: Expired CTO means your operations are legally non-compliant from Day One of the audit. No auditor will overlook this, regardless of how pristine your ETP looks.
2. OCEMS Calibration: The “Data Tampering” Accusation You Can’t Afford
The CPCB’s 2025 directive mandates that all industries with liquid discharge above 100 KLD must have OCEMS for pH, flow, COD, and TSS. The real trap? Calibration drift.
When your OCEMS shows pH 7.2 but the auditor’s handheld meter reads 8.9, you’re not just facing a fine, you’re facing accusations of data manipulation, which can trigger criminal provisions under the Water (Prevention and Control of Pollution) Act, 1974.
Action Item: Implement monthly third-party calibration (not just the quarterly mandate). Maintain a log with calibration certificates from NABL-accredited labs. Cross-verify OCEMS readings with manual grab samples every shift.
Cost Reality: Monthly calibration costs ₹8,000-₹12,000. A single “data tampering” notice costs you ₹5-10 lakhs in legal fees and potential operational closure.
3. The New 2026 Segregation: Four-Stream Waste Management at Source
The updated Solid Waste Management Rules 2026 mandate four-stream segregation: biodegradable, recyclable, hazardous, and domestic. This isn’t just about dustbins in the canteen. It’s about segregating process wastewater streams before they enter your ETP.
Why This Matters: When you mix high-COD food processing effluent with electroplating wastewater, you force your ETP to handle incompatible chemistry. Result? Chemical overdosing, unstable biological processes, and an audit report that reads like a charge sheet.
Action Item: Conduct a wastewater characterization study for each production line. Install dedicated collection sumps. Treat hazardous streams (hexavalent chromium, cyanide) separately before co-mingling.
4. ETP Efficiency vs. Chemical Overdosing: The Red Flag Auditors Always Spot
Here’s what auditors know that factory managers often don’t: excessive chemical consumption is a confession of ETP inefficiency.
When your monthly procurement shows 15 tons of Alum and 8 tons of Ferrous Sulfate for a 200 KLD plant, the auditor doesn’t think “this plant is well-stocked.” They think “this plant is chemically shocking the system to force compliance, and it’s probably generating 3-4 tons of hazardous sludge monthly.”
The Math You Need to Know:
Parameter
Chemical Treatment
Bioremediation
COD Reduction Cost (per kg)
₹45-₹60
₹12-₹18
Sludge Generation
3-5% of flow
0.5-1% of flow
pH Stability
Requires constant adjustment
Self-regulating (6.5-7.5)
Operator Dependency
High (dosing errors common)
Low (biological buffer)
Action Item: If your chemical cost per KLD exceeds ₹200/day, you’re over-treating. Transition to bioremediation (more on this in Point 5) to stabilize the system biologically, not chemically.
5. Bioremediation Integration: The Chemical-Free Compliance Path
Let’s address the elephant in the ETP. You’ve been told biological treatment is “slow” or “unreliable” for high-strength industrial effluent. That was true in 2015. It’s not true in 2026.
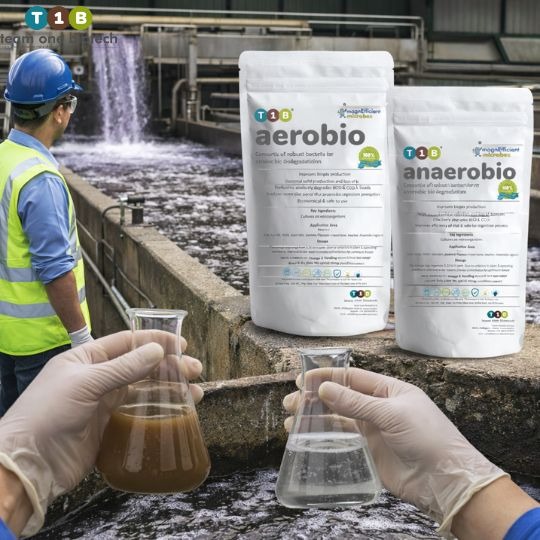
Modern microbial consortia, like Team One Biotech’s Aerobio cultures, are engineered for Indian industrial conditions. They handle COD loads up to 8,000 mg/L, tolerate pH fluctuations, and don’t “die” when production shuts down on Sundays.
How Bioremediation Passes the Audit:
Stable Discharge Parameters: Biological systems buffer shocks. Your effluent quality doesn’t swing wildly day-to-day, which OCEMS loves.
Reduced Hazardous Sludge: Microbial cultures reduce sludge by 60-70% compared to chemical coagulation. Less Form IV/V paperwork.
Lower Carbon Footprint: The CPCB’s 2026 guidelines now include energy consumption audits for ETPs. Aeration is cheaper than chemical dosing pumps and sludge dewatering.
Case Study (Anonymized): A textile dyeing unit in Tiruppur switched to bioremediation in Q3 2025. Chemical costs dropped from ₹4.2 lakhs/month to ₹1.1 lakhs/month. Sludge disposal costs (₹8,500/ton) reduced by 65%. They passed their TNPCB audit with zero non-conformances.
Action Item: Start with a pilot trial. Introduce microbial cultures in your aeration tank for 21 days. Monitor BOD/COD reduction without chemicals. Scale up post-validation.
6. Hazardous Waste Logbooks: The Audit Within the Audit
Your ETP sludge is classified as hazardous waste if it contains heavy metals, toxic organics, or exceeds TCLP limits. The Hazardous and Other Wastes (Management and Transboundary Movement) Rules, 2016 require meticulous record-keeping.
What Auditors Check:
Form IV: Monthly hazardous waste generation data (submitted online to SPCB by 10th of next month).
Form V: Annual compliance report.
Logbook Accuracy: Cross-verification between your logbook, transporter manifests, and TSDF receipts.
Common Mistake: Factory managers treat the logbook as a “to-do after production targets.” One missing TSDF receipt can invalidate 6 months of compliance.
Action Item: Assign a dedicated compliance officer (not the ETP operator’s “extra duty”). Use digital tools like CPCB’s Centralized Hazardous Waste Portal for real-time tracking.
7. Groundwater & Soil Health: The Hidden Audit Point for 2026
This is new and critical. SPCBs are now conducting groundwater sampling within 500 meters of industrial discharge points as part of surprise inspections.
If your ETP’s percolation or “evaporation pond” has been leaking COD, ammonia, or chlorides into the water table, you’re liable under the Environment (Protection) Act, 1986 for groundwater contamination, even if your effluent discharge meets standards.
Action Item: Install piezometers (groundwater monitoring wells) at three points: upgradient, at ETP boundary, and downgradient. Test quarterly for pH, TDS, nitrates, and heavy metals. Include reports in your “Green File” (Point 10).
Cost: ₹25,000 for installation, ₹3,500 per quarterly test. Non-compliance penalty: ₹10-50 lakhs plus remediation costs.
8. Staff Training: The “Why” Behind the “How”
Your ETP operator knows how to dose Alum. Does he know why excessive Alum creates hydroxide sludge that’s harder to dewater? Does he understand that a pH spike to 9.5 kills nitrifying bacteria in the aeration tank?
Auditors interview your staff. If your operator can’t explain the logic behind his daily checklist, the auditor assumes the plant runs on autopilot, or worse, isn’t run at all.
Action Item: Conduct monthly training sessions (2 hours). Cover: principles of biological treatment, OCEMS troubleshooting, emergency response for chemical spills, and regulatory updates. Document attendance. Show the auditor you invest in competence, not just compliance.
9. Energy Consumption in Treatment: The Carbon Footprint Audit
The CPCB’s Perform, Achieve, Trade (PAT) scheme is expanding to include wastewater treatment energy efficiency. If your ETP consumes more than 0.8 kWh per cubic meter of treated effluent, you’re an outlier.
Why This Matters: High energy use signals inefficiency, oversized pumps, continuous aeration without dissolved oxygen control, or chemical overdosing requiring excessive mixing.
Action Item: Install VFD (Variable Frequency Drives) on blowers. Use DO meters to optimize aeration. Switch to energy-efficient submersible pumps. Target: 0.5-0.6 kWh/m³.
Bioremediation Advantage: Biological systems require 30-40% less aeration than chemical precipitation systems.
10. The “Green File” Audit: 15-Minute Readiness
When the SPCB team arrives, you need to produce:
Last 12 months of stack emission reports (ambient air quality if applicable)
Last 6 months of effluent analysis (from NABL labs)
Noise level monitoring (quarterly for diesel generators)
CTO/CTE certificates
Hazardous waste manifests and TSDF receipts
OCEMS calibration certificates
Groundwater test reports
If this takes you 45 minutes to compile, the auditor’s already writing “poor documentation management” in the report.
Action Item: Maintain a physical and digital Green File. Update it monthly. Keep it in the compliance office, not the ETP operator’s desk drawer.
The Financial Win: Cost-Effective Compliance
Let’s return to the math, because CEOs and CFOs care about the P&L, not just the pollution index.
Typical 200 KLD ETP (Chemical-Heavy):
Chemical costs: ₹6 lakhs/month
Sludge disposal: ₹1.2 lakhs/month
Energy: ₹1.8 lakhs/month
Total: ₹9 lakhs/month
Same ETP with Bioremediation Integration:
Microbial cultures: ₹1.5 lakhs/month
Sludge disposal: ₹0.4 lakhs/month (65% reduction)
Energy: ₹1.3 lakhs/month (20% reduction via optimized aeration)
Total: ₹3.2 lakhs/month
Annual Savings: ₹69.6 lakhs. Payback period for bioremediation setup: 4-6 months.
Your ETP stops being a cost center. It becomes a strategic asset that protects your license to operate while improving your bottom line.
About Team One Biotech: India’s Industrial Compliance Partner
Team One Biotech (T1B) isn’t selling you a product. We’re offering you a compliance insurance policy.
For over a decade, T1B has partnered with textile units in Surat, pharmaceutical manufacturers in Hyderabad, food processing plants in Punjab, and automotive component suppliers in Chennai. Our Aerobic Bio Cultures, FOG Degraders, and specialized microbial consortia are formulated for the harsh realities of Indian industrial effluent, not laboratory conditions.
Why Factory Managers Trust T1B:
Guaranteed COD/BOD Reduction: 70-85% reduction in 21-day cycles.
Zero Acclimatization Downtime: Our cultures are pre-adapted to high salinity, extreme pH, and fluctuating loads.
Regulatory Expertise: We don’t just supply microbes. We help you interpret SPCB notices, prepare audit files, and train your ETP staff.
Products include:
Aerobic Bio Cultures for high-COD industrial streams
Anaerobic Cultures for distillery and food processing
FOG Degraders for kitchen and canteen wastewater
Septic Tank Biologicals for residential and commercial complexes
Don’t Wait for a Show-Cause Notice
The SPCB audit isn’t an “if”, it’s a “when.” And when that inspector walks through your gate, your compliance posture determines whether they leave with a handshake or a penalty order.
This 10-point checklist isn’t theoretical. It’s the distilled experience of factories that have navigated the 2026 regulatory landscape without fines, without shutdowns, and without compromising profitability.
Your move: Audit yourself before the SPCB does. Fix the OCEMS calibration. Clean up the hazardous waste logbook. And most importantly, transition your ETP from chemical dependency to biological stability.
Because in 2026, passing the audit isn’t about luck. It’s about preparation.
Ready to make your ETP audit-proof? Connect with Team One Biotech’s technical team for a free ETP efficiency assessment. Let’s turn compliance from a cost into a competitive advantage.
Team One Biotech – Engineered for India. Proven in the Field.
Looking to improve your ETP/STP efficiency with the right bioculture? Talk to our experts at Team One Biotech for customised microbial solutions.
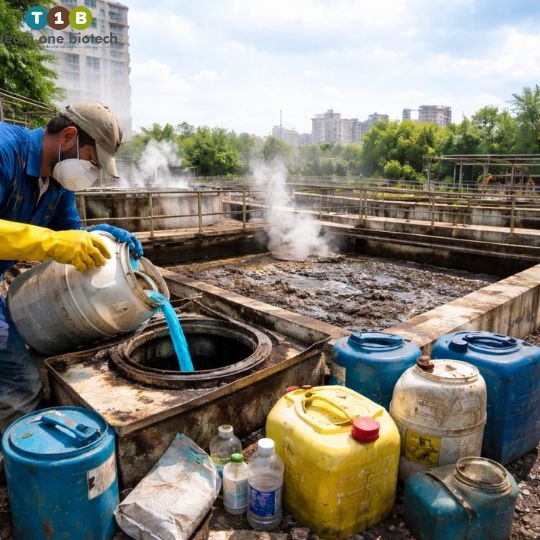
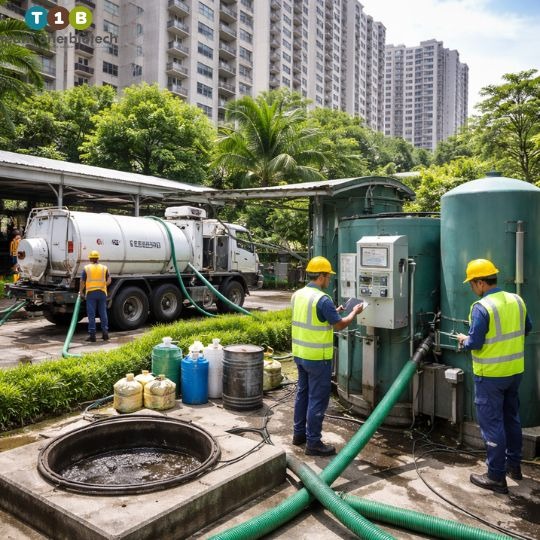
Mukund’s phone rings. He’s the facility manager of a 450-unit housing society in Pune, and the voice on the other end belongs to Mrs. Kapoor from Tower B, angry, sleep-deprived, and threatening to escalate complaints to the municipal corporation.
“The smell from the STP is unbearable. My children can’t sleep with the windows open. If this isn’t fixed by tomorrow, I’m calling the pollution control board myself.”
Mukund knows what this means. A resident complaint to the State Pollution Control Board (SPCB) triggers an inspection. An inspection reveals what he’s been dreading: sludge accumulation that hasn’t been properly managed in months, inconsistent effluent quality, and maintenance records that won’t hold up to scrutiny, issues that could have been controlled early with better process management and the right bio cultures for wastewater treatment.
The next morning, he receives the other call he’s been fearing, not from an angry resident this time, but from the managing committee chairman: “The SPCB has issued a show-cause notice. We have 15 days to respond or face penalties and potential shutdown of the STP.”
This scenario plays out across hundreds of Indian housing societies every month. The question isn’t whether your STP will face this crisis, it’s when, and whether you’ll be prepared.
Cost of “Traditional” STP Maintenance: Why Chemicals Aren’t the Solution
Most housing society STPs in India follow what operators call the “band-aid approach”, dosing increasing amounts of chemicals to mask problems rather than solving them at the source.
Here’s what this typically looks like:
Monthly Chemical Spend:
Chlorine for odor suppression: ₹8,000–₹15,000
Coagulants and flocculants: ₹12,000–₹20,000
pH adjusters and neutralizers: ₹5,000–₹8,000
Emergency deodorizers during complaint spikes: ₹10,000–₹25,000
Total monthly chemical costs: ₹35,000–₹68,000 for a mid-sized society
But here’s the problem: these chemicals don’t reduce sludge volume. They don’t address the root cause of odor (anaerobic decomposition of organic matter). They simply suppress symptoms while the underlying biological imbalance in your STP worsens.
The Biology You’re Fighting Against
Indian residential wastewater carries unique challenges:
High organic load variability: Festival seasons, weekend gatherings, and monsoon dilution create wild fluctuations in BOD (Biological Oxygen Demand) levels, from 150 mg/L to 600 mg/L within the same week.
Grease and oil from kitchens: Indian cooking introduces significantly higher fat content compared to Western wastewater profiles, leading to scum formation and reduced oxygen transfer efficiency.
Temperature extremes: Summer temperatures above 40°C accelerate decomposition and odor generation, while winter slowdowns reduce microbial activity.
Power fluctuations: Frequent power cuts disrupt aeration cycles, creating anaerobic pockets where hydrogen sulfide (that characteristic “rotten egg” smell) thrives.
Traditional chemical treatment cannot adapt to these variables. Biological systems can, if they’re properly designed and maintained with the right microbial communities.
How Poor Sludge Management Destroys Your Consent to Operate
The legal framework governing STPs in India is unforgiving, and it’s getting stricter:
Current Regulatory Landscape:
The Environment (Protection) Act, 1986 mandates specific discharge standards
CPCB’s revised 2023 guidelines tighten BOD limits to 10 mg/L for discharge into water bodies
State-level SPCBs conduct surprise inspections with increasing frequency
New regulations require quarterly sludge characterization reports for STPs above certain capacities
What Triggers an SPCB Inspection?
Resident complaints (the most common trigger in urban areas)
Routine area surveillance during monsoon season
Downstream water quality violations that trace back to your discharge point
Failure to submit annual returns or Consent to Operate renewal documents
The Penalty Structure That Can Cripple Your Society:
First offense: ₹10,000–₹50,000 fine + show-cause notice
Repeated violations: ₹1 lakh–₹5 lakh + potential criminal proceedings against managing committee members
Consent to Operate suspension: Complete STP shutdown until compliance is demonstrated
Legal costs and consultant fees: ₹2 lakh–₹8 lakh to remediate and document compliance
But here’s what most facility managers don’t realize until it’s too late: the biggest compliance risk isn’t the effluent quality, it’s the sludge.
The Sludge Management Crisis
Indian housing societies generate approximately 40–60 grams of sludge per person per day. For a 500-unit society (assuming 2,000 residents), that’s 80–120 kg of wet sludge daily, or 2.4–3.6 tons per month.
Traditional disposal costs:
Sludge dewatering and transport: ₹3,000–₹5,000 per ton
Licensed disposal facility fees: ₹2,500–₹4,000 per ton
Total monthly sludge management: ₹13,200–₹34,560
These costs are climbing yearly as environmental regulations tighten and disposal facilities become more selective. Several societies have faced situations where disposal facilities refuse sludge that doesn’t meet characterization requirements, leaving them with literally tons of waste and nowhere to put it.
The compliance trap emerges when:
Sludge accumulates faster than it can be economically removed
Operators reduce aeration to slow sludge production (creating odor problems)
Sludge overflow or improper disposal triggers SPCB violations
The society enters a crisis cycle of fines, emergency clean-ups, and escalating costs
The Bioremediation Alternative: Solving the Problem at Its Biological Source
Here’s what changes when you shift from chemical suppression to biological optimization:
Instead of fighting your STP’s natural processes, bioremediation works with them, introducing specialized microbial consortia that:
1. Accelerate Organic Waste Degradation
High-efficiency bacterial strains (including Bacillus species, Pseudomonas, and specialized cellulolytic bacteria) break down complex organic compounds 3–5 times faster than native microbial populations. This means organic waste that would normally ferment anaerobically (producing odor) is converted aerobically into CO₂ and water.
2. Reduce Sludge Volume at the Source
The right microbial mix doesn’t just process waste faster, it processes it more completely. Instead of creating excess biomass (sludge), optimized bacterial populations achieve higher metabolic efficiency:
Reduction in sludge generation: 35–45% compared to conventional treatment
Improved sludge settleability: Better compaction means less volume to transport
Enhanced nutrient removal: Lower nitrogen and phosphorus levels in both effluent and sludge
Real numbers: A society generating 3 tons of sludge monthly can reduce this to 1.6–1.9 tons, saving ₹7,000–₹15,000 monthly in disposal costs alone.
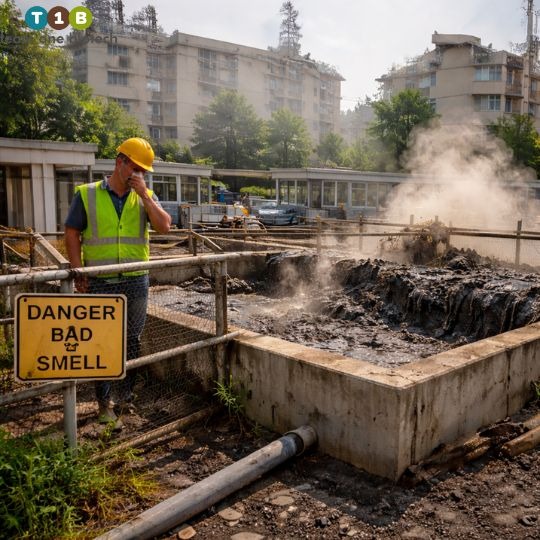
3. Eliminate Odor-Causing Compounds
Hydrogen sulfide, mercaptans, and volatile organic acids are the primary odor compounds in STP environments. Bioremediation addresses these by:
Maintaining aerobic conditions that prevent sulfate-reducing bacteria (the H₂S producers)
Rapidly metabolizing volatile fatty acids before they accumulate
Creating a balanced microbial ecosystem that outcompetes odor-causing anaerobic species
The India-Specific Advantage of Bioremediation
Our formulations are specifically designed for Indian conditions:
Monsoon resilience: Microbial blends that maintain activity during dilution events and temperature drops
High-temperature tolerance: Strains selected for optimal performance in 35–45°C ranges common in Indian summers
Grease degradation specialists: Lipase-producing bacteria that specifically target the cooking oil content in Indian residential wastewater
Power-cut adaptation: Formulations that include facultative bacteria capable of surviving temporary anaerobic conditions during aeration interruptions
The Team One Biotech Solution: Engineering Biology for Compliance and Cost Reduction
Our bioremediation approach isn’t a one-time “magic dose”, it’s a systematic biological upgrade to your STP:
Phase 1: Baseline Assessment and Microbial Analysis (Week 1)
Real-World Transformation: The Kharadi Society Case
A 380-unit housing complex in Pune’s Kharadi area faced exactly the crisis described at the beginning of this article: resident complaints, SPCB show-cause notice, and ₹35,000 monthly chemical costs that weren’t solving the odor problem.
Their situation in March 2024:
Visible sludge floating in the final clarifier
H₂S odor detectable 50 meters from STP
Effluent BOD consistently above 30 mg/L (limit: 10 mg/L for their discharge permit)
Chemical costs: Reduced from ₹35,000 to ₹6,500 monthly
SPCB compliance status: Consent to Operate renewed without conditions
The facility manager reported: “We went from dreading SPCB inspections to actually inviting them to document our improvement. That psychological shift alone was worth the investment.”
Why This Matters Beyond Your Balance Sheet
Effective STP management through bioremediation isn’t just about cost savings or avoiding fines, it’s about:
Community health: Eliminating hydrogen sulfide exposure that causes respiratory irritation and headaches among residents living near the STP
Environmental responsibility: Reducing the chemical load you discharge into municipal drains or water bodies
Property values: Well-maintained STPs with zero odor complaints become a selling point rather than a liability
Legal protection: Documented compliance creates a protective record if disputes arise with regulatory authorities
Operational peace of mind: Facility managers can focus on other society maintenance instead of firefighting STP crises
The Strategic Decision: Chemical Dependency vs. Biological Intelligence
The traditional approach to STP management, increasing chemical dosing when problems arise, creates a dependency cycle:
More chemicals → Temporary symptom suppression → Underlying biology deteriorates → More severe problems emerge → Even higher chemical doses required
Bioremediation breaks this cycle by addressing the root cause: establishing and maintaining a healthy, efficient microbial ecosystem that naturally prevents the conditions that lead to odor, excessive sludge, and compliance violations.
The question isn’t whether bioremediation works, decades of industrial and municipal applications prove its effectiveness. The question is whether you’ll implement it proactively or reactively.
Proactive implementation (before the crisis): Lower costs, smooth transition, no regulatory pressure
Reactive implementation (after SPCB notice): Higher urgency fees, pressure to show immediate results, legal documentation requirements
Next Steps: Your Compliance and Cost-Reduction Roadmap
If your housing society STP experiences any of these warning signs, a bioremediation assessment should be scheduled immediately:
Odor complaints from residents more than once quarterly
Monthly chemical costs exceeding ₹25,000
Sludge disposal costs above ₹15,000 monthly
Effluent parameters approaching (within 20% of) your discharge limits
Visible floating sludge or foam in clarifiers
Consent to Operate renewal approaching within 6 months
Team One Biotech offers complimentary STP assessments for housing societies in metro areas to:
Evaluate your current biological performance and chemical dependency
Quantify potential cost savings specific to your facility
Develop a customized bioremediation protocol for your waste characteristics
Create a compliance documentation package that satisfies SPCB requirements
The site audit takes approximately 3–4 hours and includes water sampling, sludge analysis, and operator interviews. Within 48 hours, you receive a detailed report outlining:
Current biological performance gaps
Projected cost reduction timeline
Regulatory risk assessment
Customized microbial formulation recommendations
The 2 AM Call You’ll Never Receive Again
When you solve STP problems at their biological source rather than masking symptoms with chemicals, everything changes.
No more midnight complaint calls about odor.
No more anxiety when the SPCB inspection vehicle pulls up.
No more escalating chemical costs eating into your maintenance budget.
Just a reliably functioning STP that meets compliance standards, protects community health, and operates at a fraction of traditional costs.
The question isn’t whether bioremediation works for housing society STPs in India, it’s whether you’ll implement it before or after the next crisis.
About Team One Biotech: We specialize in customized bioremediation solutions for industrial and residential wastewater treatment across India. Our microbial formulations are specifically engineered for Indian waste characteristics and environmental conditions, backed by 15+ years of field-proven results and complete regulatory compliance support.
Looking to improve your ETP/STP efficiency with the right bioculture? Talk to our experts at Team One Biotech for customised microbial solutions.
The phone call every textile mill owner dreads typically arrives on a Friday afternoon. It’s the SPCB officer informing you that your latest effluent sample has failed compliance testing. Your COD levels are 850 mg/L when the permissible limit is 250 mg/L. The penalty? A show-cause notice, potential production halt, and fines that could run into lakhs. For factory managers in Tirupur, Surat, or Ludhiana, this scenario isn’t hypothetical, it’s a recurring nightmare that disrupts operations and erodes profitability.
The traditional response has been to throw more chemicals at the problem. More alum. More ferrous sulfate. More polymer. Yet each month, the chemical bills climb higher while discharge quality remains unpredictable. The effluent treatment plant becomes a black hole for operational expenses, and the threat of regulatory action never truly disappears.
To understand how to optimize your plant and achieve consistent compliance, explore here:
There is another path forward, one that addresses the root cause rather than masking symptoms. Biological treatment, specifically optimized aerobic and anaerobic systems enhanced with targeted microbial solutions, offers Indian textile manufacturers a sustainable route to consistent CPCB compliance while dramatically reducing chemical dependency.
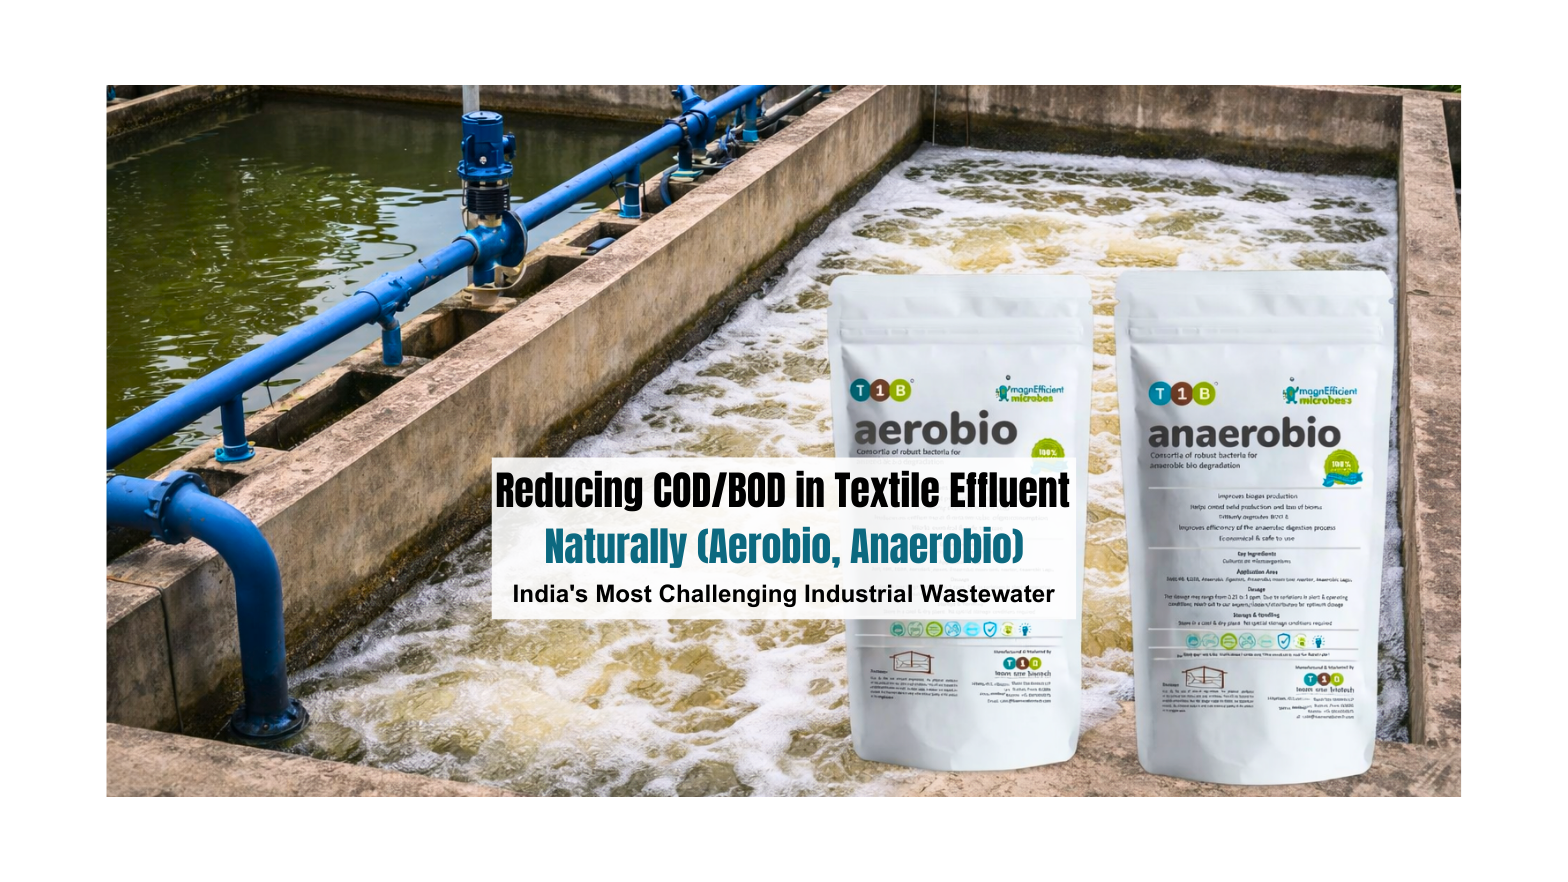
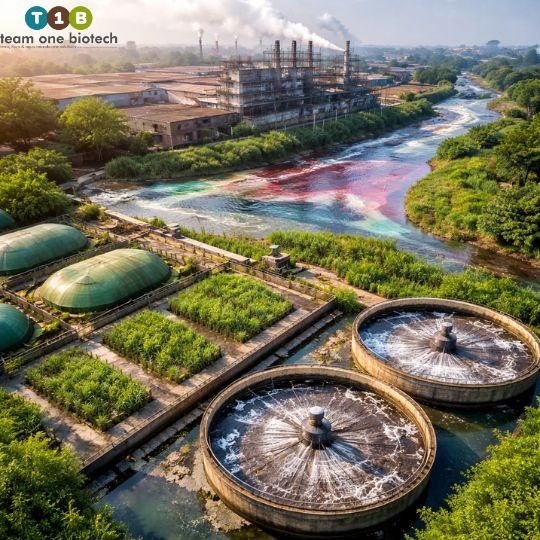
Why Textile Effluent Remains India’s Most Challenging Industrial Wastewater
Textile wastewater is chemically aggressive in ways that few other industrial effluents match. The combination of synthetic dyes, sizing agents, heavy metals from mordants, high salt concentrations, and extreme pH variations creates a hostile environment that resists conventional treatment.
The specific challenges include:
Recalcitrant organic compounds: Azo dyes and complex aromatic structures that standard bacterial consortia cannot degrade effectively
Color persistence: Even after COD reduction, the chromophores remain, making the treated water visually unacceptable for discharge
Toxicity to biological systems: Many textile chemicals actively inhibit the microorganisms you’re relying on for treatment
Variable loading: Batch-wise production means your ETP receives shock loads that destabilize biological processes
This complexity explains why so many Indian textile ETPs default to chemical-heavy approaches. Coagulation and flocculation with alum or ferrous salts produce visible results quickly. The water clarifies. Suspended solids drop. But the fundamental problem persists, you’re not degrading the pollutants, merely concentrating them into sludge that itself becomes a disposal challenge. Meanwhile, your monthly chemical expenditure continues to drain resources that could be invested in production capacity or market expansion.
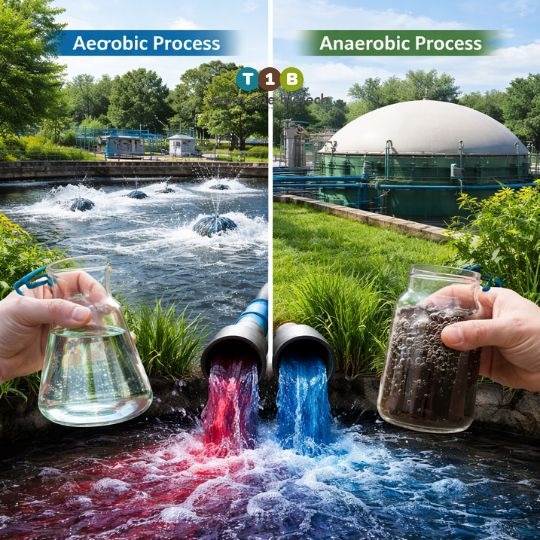
Biological COD/BOD Reduction: Aerobic vs Anaerobic Processes
The key to sustainable effluent treatment lies in harnessing natural microbial metabolism to break down organic pollutants into harmless end products. This is bioremediation at its core, using living organisms to remediate contamination. However, not all biological processes are created equal, and the distinction between aerobic and anaerobic treatment is crucial for textile applications.
Aerobic Treatment: Oxygen-Driven Degradation
Aerobic biological treatment relies on oxygen-respiring bacteria to metabolize organic matter. In an aeration tank, mechanical aerators or diffusers introduce dissolved oxygen, creating conditions where aerobic microorganisms thrive and rapidly consume biodegradable COD.
Key advantages for textile effluent:
High BOD removal efficiency: Typically 85-95% reduction when properly designed and operated
Faster reaction rates: Aerobic metabolism proceeds more quickly than anaerobic alternatives
Better handling of variable loads: Aerobic systems recover more rapidly from shock loading events
Nitrification capability: Can simultaneously remove nitrogen compounds common in textile processing
Limitations to consider:
High energy consumption: Running blowers or mechanical aerators 24/7 significantly impacts electricity bills, a major concern given India’s industrial power tariffs
Less effective for high-strength effluent: When COD exceeds 3,000-4,000 mg/L, aerobic treatment alone becomes economically impractical
Limited dye degradation: Many synthetic dyes require anaerobic conditions for the initial breaking of azo bonds
T1B Aerobio: Specialized Solution for Aerobic Treatment Excellence
For textile mills seeking to maximize the performance of their aerobic treatment systems, T1B Aerobio represents a scientifically formulated answer to the challenges of industrial wastewater. Originally developed for complex sewage systems and now adapted for industrial applications, this specialized microbial consortium addresses the specific metabolic requirements of aerobic COD/BOD reduction.
T1B Aerobio is engineered with:
Multi-strain bacterial cultures: A carefully balanced consortium of aerobic heterotrophs, nitrifiers, and facultative anaerobes that work synergistically to degrade complex organic compounds
Shock load resistance: Strains selected for their ability to maintain metabolic activity even during sudden changes in effluent composition or loading rates
Rapid acclimatization: Proprietary formulation that establishes active biomass 40-50% faster than naturally occurring populations
Enhanced dye degradation: Specific strains capable of aerobic decolorization of azo and anthraquinone dyes under high dissolved oxygen conditions
When applied to textile effluent aerobic treatment tanks, T1B Aerobio typically delivers COD reduction from 800-1,200 mg/L down to 180-220 mg/L within the standard hydraulic retention time of 24-36 hours. This consistent performance eliminates the uncertainty that plagues conventional activated sludge systems in textile applications.
The product’s versatility extends beyond textile mills, its proven effectiveness in sewage treatment systems demonstrates the robust nature of these bacterial strains across diverse wastewater compositions. For Indian textile manufacturers, this translates to reliability you can depend on, regardless of seasonal production variations or process changes.
Anaerobic digestion occurs in the absence of oxygen, with specialized bacteria breaking down complex organic molecules through a multi-stage process involving hydrolysis, acidogenesis, acetogenesis, and methanogenesis.
Why anaerobic treatment makes financial sense:
Zero aeration costs: No energy expenditure on oxygenation saves lakhs annually on electricity bills
Handles high COD loads: Effectively treats effluent with COD levels of 2,000-15,000 mg/L
Biogas generation: Methane produced can offset fuel costs for boiler operations
Better color removal: The reducing environment helps cleave azo bonds in synthetic dyes
Temperature sensitivity: Mesophilic anaerobic bacteria perform optimally at 35-37°C, requiring temperature management in winter months
Longer startup periods: Establishing a healthy anaerobic consortium takes 2-3 months compared to 2-3 weeks for aerobic systems
pH stability requirements: Methanogenic bacteria are sensitive to pH fluctuations; maintaining 6.8-7.2 pH is essential
Cannot achieve discharge standards alone: Anaerobic treatment typically reduces COD by 60-75% but requires aerobic polishing to meet CPCB limits
T1B Anaerobio: Maximizing Methane Production and COD Reduction
The success of anaerobic treatment depends entirely on maintaining a healthy population of methanogens, the fastidious microorganisms responsible for converting organic acids and hydrogen into methane. In textile effluent, the presence of toxic compounds, pH fluctuations, and hydraulic shocks frequently disrupts this delicate microbial ecosystem, resulting in system souring, reduced biogas production, and incomplete COD reduction.
T1B Anaerobio addresses these challenges through a specialized bioculture designed specifically for optimizing anaerobic digestion performance in industrial applications.
The formulation delivers:
Complete methanogenic consortium: Balanced population of hydrogenotrophic and acetoclastic methanogens that work in tandem to efficiently convert organic matter to biogas
Resilient acid-formers: Robust acidogenic and acetogenic bacteria that maintain stable volatile fatty acid profiles even under variable loading conditions
Toxicity tolerance: Strains adapted to function in the presence of sulfates, heavy metals, and residual dye molecules common in textile wastewater
Enhanced biogas yield: Optimization of the entire four-stage anaerobic process results in 30-40% higher methane production compared to unamended systems
For textile mills operating anaerobic reactors, whether UASB, EGSB, or fixed-film configurations, T1B Anaerobio transforms the reactor from a simple pre-treatment step into an energy-generating asset. A 500 KLD textile unit treating effluent with 4,000 mg/L COD can potentially generate 600-800 cubic meters of biogas daily when the anaerobic system operates at peak efficiency. At 55-65% methane content, this biogas has significant calorific value that can offset boiler fuel consumption.
The financial implications are substantial:
Improved methane yield alone can reduce monthly fuel costs by Rs. 40,000-60,000 for a mid-sized mill. Simultaneously, the enhanced COD reduction in the anaerobic stage reduces the organic load on downstream aerobic treatment, lowering aeration energy costs by another Rs. 25,000-35,000 monthly. This dual benefit, energy generation plus energy savings, makes T1B Anaerobio one of the most economically impactful interventions in textile wastewater treatment.
Beyond economics, the improved stability of methanogenic populations prevents the system souring incidents that can take weeks to rectify. Operators report more consistent pH levels, lower volatile fatty acid accumulation, and elimination of the hydrogen sulfide odor problems that plague poorly performing anaerobic systems.
The Hybrid Approach: Maximizing Both Worlds with T1B Solutions
The most cost-effective configuration for textile mills combines anaerobic pre-treatment with aerobic polishing, and Team One Biotech’s product suite is specifically designed to optimize this sequential treatment approach.
The ideal implementation strategy:
Stage 1 – Anaerobic Pre-Treatment with T1B Anaerobio: High-strength textile effluent enters the anaerobic reactor where T1B Anaerobio’s methanogenic consortium breaks down complex dyes and reduces COD from 3,000-4,500 mg/L down to 1,000-1,500 mg/L. Simultaneously, the system generates methane-rich biogas for energy recovery.
Stage 2 – Aerobic Polishing with T1B Aerobio: The anaerobically pre-treated effluent, now significantly lower in organic load and with partially degraded dye molecules, enters the aerobic treatment system. T1B Aerobio’s specialized bacteria complete the degradation process, achieving final discharge quality of COD below 250 mg/L and BOD below 30 mg/L.
This sequential treatment aligns perfectly with the metabolic capabilities of different bacterial groups while optimizing operational costs. The anaerobic stage handles the energy-intensive breakdown of recalcitrant compounds without electricity consumption, while the aerobic stage provides rapid, reliable polishing to meet stringent discharge standards.
The Bio-Augmentation Advantage: Specialized Cultures vs Natural Consortia
Here’s where the conventional wisdom often fails Indian textile mills. Many ETP operators assume that if they maintain the right pH, temperature, and nutrient levels, a suitable bacterial consortium will naturally develop. In theory, this is correct. In practice, textile effluent’s chemical complexity and toxicity prevent the establishment of a robust, diverse microbial community.
Bio-augmentation, the strategic introduction of specialized bacterial strains and enzyme systems, addresses this limitation directly.
The difference between relying on naturally occurring bacteria and employing scientifically selected consortia is analogous to the difference between hoping qualified employees walk through your factory gate versus actively recruiting specialists with the exact skills your production line requires.
Specialized microbial cultures offer:
Targeted degradation pathways: Strains selected specifically for their ability to metabolize textile-specific compounds like reactive dyes, vat dyes, and sulfonated aromatics
Toxicity resistance: Bacteria adapted to function in the presence of high salt concentrations and heavy metal residues
Consistent performance: Reduced vulnerability to shock loads and pH swings that would decimate natural populations
Accelerated treatment rates: Enzymes that catalyze rate-limiting steps in dye degradation, achieving compliance-level treatment in shorter hydraulic retention times
The financial implications are substantial. A textile mill in Tirupur processing 500 KLD of effluent might spend Rs. 8-12 lakhs monthly on coagulants and flocculants in a chemical-dominated treatment scheme. By transitioning to an optimized biological system with targeted bio-augmentation using products like T1B Aerobio and T1B Anaerobio, chemical costs can be reduced by 60-70% while simultaneously improving effluent quality and consistency.
Achieving SPCB Compliance: The Numbers That Matter
The Central Pollution Control Board’s standards for textile industry effluent discharge are explicit and non-negotiable. The key parameters for textile mills include:
COD: Maximum 250 mg/L
BOD: Maximum 30 mg/L
pH: 5.5-9.0
Total Suspended Solids: Maximum 100 mg/L
Color: Should not be recognizable in a dilution of 1:20
State Pollution Control Boards enforce these limits rigorously, with penalties escalating from monetary fines to production suspensions for repeat violations. The legal framework under the Water (Prevention and Control of Pollution) Act, 1974, grants SPCBs significant authority to impose closure notices on non-compliant facilities.
Beyond avoiding penalties, there’s a positive business case for reliable compliance. Many international buyers now mandate environmental certifications as a condition of orders. Brands sourcing from India increasingly require proof of sustainable water management. An ETP that consistently meets or exceeds discharge standards becomes a competitive advantage in securing premium contracts.
Biological treatment systems enhanced with T1B Aerobio and T1B Anaerobio routinely achieve:
COD levels of 150-200 mg/L, providing a comfortable compliance buffer
BOD levels of 15-25 mg/L, well below regulatory limits
Near-complete color removal through the combination of anaerobic reductive decolorization and aerobic oxidation
Stable pH in the 7-8 range without continuous chemical adjustment
The Team One Biotech Approach: Science-Backed Solutions for Real-World Challenges
At Team One Biotech, we recognize that Indian textile manufacturers need more than theoretical treatment schemes. You need solutions that function reliably under the specific constraints of your operations, limited space, variable effluent characteristics, tight cost controls, and the absolute requirement of continuous compliance.
Our biological treatment solutions are built on three core pillars:
1. Application-Specific Bacterial Consortia
We don’t offer generic microbial products. Our flagship products, T1B Aerobio and T1B Anaerobio, are formulated for the specific metabolic requirements of aerobic and anaerobic treatment processes. Whether you’re processing reactive dyes in cotton dyeing, disperse dyes in polyester operations, or complex combinations in blended fabric processing, our bacterial strains are matched to your treatment requirements.
T1B Aerobio brings proven performance from sewage treatment applications, adapted and optimized for the unique challenges of textile industrial effluent. T1B Anaerobio represents years of research into maximizing methanogenic activity under inhibitory conditions, ensuring your anaerobic reactor operates as both a treatment system and an energy generation asset.
2. Enzyme Enhancement Technology
Beyond living bacteria, our formulations include industrial enzymes that target the most recalcitrant components of textile wastewater. Azoreductases for azo dye cleavage. Laccases for phenolic compound oxidation. Peroxidases for lignin-like structures. These catalysts dramatically accelerate degradation reactions that would otherwise proceed at impractical rates.
3. Technical Support for Operational Excellence
Biological systems are living ecosystems that require informed management. We provide training for your ETP operators on system monitoring, troubleshooting common issues, and optimizing performance with T1B Aerobio and T1B Anaerobio. Regular technical audits ensure your system continues operating at peak efficiency as production patterns evolve.
The typical implementation process involves:
Effluent characterization: Detailed analysis of your wastewater composition, including COD/BOD ratio, dye classes, heavy metals, and toxicity assessment
System design review: Evaluation of your existing ETP infrastructure and recommendations for optimization, including appropriate dosing protocols for T1B products
Phased microbial introduction: Gradual bioaugmentation with T1B Anaerobio in anaerobic reactors followed by T1B Aerobio in aerobic treatment tanks to avoid shocking existing biological communities
Performance monitoring: Weekly sampling and analysis during the initial 60-90 days to track improvement and refine dosing schedules
Transition to maintenance mode: Once stable performance is achieved, moving to a routine supplementation schedule
The results speak clearly. Mills working with Team One Biotech and implementing T1B Aerobio and T1B Anaerobio typically see 40-60% reduction in chemical consumption within the first quarter, with full compliance achieved within 90-120 days of program initiation.
Financial Analysis: The True Cost of Chemical vs Biological Treatment
Disclaimer: The figures below are general indicative values for illustrative purposes only. Actual costs, dosages, and savings will vary significantly depending on the specific ETP design, effluent characteristics, operational parameters, local vendor pricing, and plant management practices. These numbers should not be used as a substitute for a site-specific techno-economic assessment.
For a mid-sized textile unit processing around 250–350 KLD of effluent with an average COD in the range of 2,000–3,000 mg/L, consider the comparative economics:
Traditional Chemical Treatment Monthly Costs: Alum (180–220 kg/day at Rs. 12–18/kg): Rs. 75,000–1,05,000 Ferrous sulfate (120–180 kg/day at Rs. 6–10/kg): Rs. 28,000–45,000 Polymer (12–18 kg/day at Rs. 150–210/kg): Rs. 65,000–1,00,000 Lime for pH adjustment (80–120 kg/day at Rs. 4–7/kg): Rs. 10,000–20,000 Sludge disposal (4,000–6,500 kg/month at Rs. 2–3/kg): Rs. 8,000–18,000 Indicative total monthly chemical costs: Rs. 1,90,000–2,80,000
Optimized Biological Treatment with T1B Aerobio and T1B Anaerobio: T1B Anaerobio for anaerobic reactor (maintenance dose): Rs. 24,000–38,000 T1B Aerobio for aerobic treatment (maintenance dose): Rs. 20,000–32,000 Enzyme supplement: Rs. 15,000–26,000 Nutrient supplementation (N, P source): Rs. 14,000–24,000 Residual coagulant for TSS polishing: Rs. 18,000–32,000 Reduced sludge disposal (1,500–2,500 kg/month): Rs. 3,000–7,500 Indicative total monthly costs: Rs. 95,000–1,55,000
Additional benefit – Biogas revenue offset: Rs. 25,000–45,000 (indicative fuel cost savings from methane generation with T1B Anaerobio)
Indicative net monthly savings: Rs. 1,10,000–1,75,000Indicative annual savings: Rs. 13,00,000–21,00,000
This analysis excludes the value of improved reliability and the avoidance of compliance penalties, which can easily exceed Rs. 5–10 lakhs in a single serious violation incident.
The payback period for transitioning to biological treatment with T1B products, including any necessary modifications to existing infrastructure, typically ranges from 6–14 months. Given that ETP systems operate for 10–15 years, the long-term economic advantage is substantial.
Implementation Roadmap: Your Path to Sustainable Compliance
Transitioning from chemical-dominated to biologically-optimized treatment with T1B Aerobio and T1B Anaerobio doesn’t require shutting down your ETP or halting production. The process can be managed incrementally:
Month 1: Baseline assessment and system preparation. Conduct comprehensive effluent characterization, review existing ETP design, identify any structural modifications needed, and begin operator training on T1B product application protocols.
Month 2-3: Pilot-phase bio-augmentation. Introduce T1B Anaerobio in the anaerobic reactor at conservative doses while monitoring biogas production and COD reduction. Begin T1B Aerobio application in aerobic tanks while maintaining existing chemical treatment as backup. Monitor performance closely and gradually reduce chemical dosing as biological activity establishes.
Month 4-5: Optimization and scale-up. Refine dosing protocols for both T1B products based on pilot results, expand bio-augmentation across all treatment stages, and achieve target performance on biological treatment with minimal chemical supplementation. Quantify biogas yield improvements and calculate fuel cost offset.
Month 6 onwards: Maintenance and continuous improvement. Establish routine monitoring schedules, implement T1B product replenishment protocols, conduct quarterly performance reviews, and fine-tune dosing based on seasonal production variations.
This phased approach minimizes risk while ensuring your mill maintains compliance throughout the transition period.
Your Next Steps Toward Sustainable Compliance
The choice facing Indian textile manufacturers is increasingly clear. You can continue managing effluent treatment as an unavoidable cost center, perpetually wrestling with chemical bills and compliance anxiety. Or you can embrace biological treatment as a strategic advantage, reducing costs, ensuring regulatory compliance, and positioning your mill as an environmentally responsible partner for quality-conscious buyers.
The science is proven. The economics are compelling. The regulatory imperative is non-negotiable.
Team One Biotech invites you to start the conversation. Contact our technical team for a no-obligation assessment of your current ETP performance and a customized proposal for implementing T1B Aerobio and T1B Anaerobio. We’ll analyze your specific effluent characteristics, evaluate your existing infrastructure, and provide a detailed roadmap showing projected performance improvements, biogas generation potential, and cost savings.
The path to sustainable compliance begins with a single decision. Make it today.
Contact Team One Biotech:
Transform your effluent treatment from operational burden to competitive advantage. Reach out to discuss your specific requirements and discover how T1B Aerobio and T1B Anaerobio can deliver both compliance certainty and financial benefits.
Your textile business deserves an ETP that works as efficiently as your production floor. Let’s make that happen together.
Looking to improve your ETP/STP efficiency with the right bioculture? Talk to our experts at Team One Biotech for customised microbial solutions.
On a Tuesday. Your phone vibrates with a message from your night shift supervisor: “SPCB team at gate. Surprise inspection. ETP discharge sample taken.”
Your heart sinks. You know the effluent quality has been inconsistent lately. The chemical dosing hasn’t been optimized. Your COD readings have been hovering dangerously close to the consent limits. Tomorrow morning, you might be explaining to your MD why production could halt, why legal notices are arriving, or worse, why the factory faces a closure order.
This scenario plays out across hundreds of Indian manufacturing facilities every month. The difference between factories that survive regulatory scrutiny and those that face crippling penalties often comes down to one thing: understanding and implementing proper wastewater compliance strategies before the inspection happens.
If your ETP is struggling with COD limits or chemical optimization, explore our proven Wastewater Treatment Solutions. Don’t wait for the next surprise inspection to secure your production’s future.
This handbook exists because India’s environmental enforcement landscape has fundamentally changed. The days of lenient inspections and negotiable standards are over. Real-time monitoring mandates, stricter discharge limits, public interest litigations, and National Green Tribunal interventions have created an environment where compliance is not optional, it’s existential.
Whether you manage a textile dyeing unit in Tiruppur, a pharmaceutical facility in Hyderabad, or a food processing plant in Punjab, this guide will walk you through everything you need to know about industrial wastewater compliance in 2026, the hidden costs draining your profitability, and the proven solutions that are helping Indian manufacturers stay ahead of regulations while cutting operational expenses.
The 2026 Regulatory Landscape, What Has Changed and Why It Matters
The New Normal: Stricter Standards Across the Board
The Central Pollution Control Board (CPCB) and State Pollution Control Boards have implemented the most stringent industrial effluent discharge standards in India’s regulatory history. These changes reflect both environmental necessity and legal pressure from courts and tribunals.
Latest Key Parameters for 2026
Parameter
Previous Limit (General)
Impact
BOD (Biochemical Oxygen Demand)
30 mg/L
67% reduction required
COD (Chemical Oxygen Demand)
250 mg/L
Up to 80% reduction
Total Suspended Solids (TSS)
100 mg/L
80% reduction required
pH Range
5.5–9.0
Tighter control needed
Heavy Metals (varies)
Sector-specific
Advanced treatment essential
These numbers represent more than regulatory targets. They represent the difference between receiving your annual Consent to Operate (CTO) renewal and facing immediate shutdown orders.
Real-Time Monitoring: The Game Changer
Perhaps the most transformative change is the mandatory installation of Continuous Effluent Monitoring Systems (CEMS) for Red and Orange category industries. This requirement has eliminated the buffer that many facilities previously relied upon.
Under the new regime:
Your effluent parameters are transmitted to SPCB servers every 15 minutes
Deviations trigger automatic alerts to regulatory authorities
Historical data is permanently stored and can be audited retroactively
Manual tampering or data manipulation carries severe criminal penalties
For factory managers, this means your ETP performance is under constant surveillance. A single upset condition that previously might have gone unnoticed can now generate an automatic violation notice.
State-Level Variations: Know Your SPCB
While CPCB sets national standards, implementation varies significantly across states. Understanding your specific SPCB’s enforcement style is critical:
Maharashtra Pollution Control Board (MPCB): Known for aggressive enforcement in industrial clusters like Pune and Thane-Belapur. Frequent unannounced inspections, strict interpretation of discharge standards, and quick escalation to closure orders for repeat violations.
Gujarat Pollution Control Board (GPCB): Focus on industrial estates and SEZs. Mandatory quarterly self-monitoring reports. Strong emphasis on zero liquid discharge (ZLD) for water-stressed regions like Saurashtra.
Tamil Nadu Pollution Control Board (TNPCB): Particularly stringent in textile hubs like Tiruppur and dyeing clusters near Erode. History of court-mandated closures. Emphasis on groundwater protection.
Karnataka State Pollution Control Board (KSPCB): Bangalore industrial area faces special scrutiny. Lake pollution concerns drive stricter enforcement. Technology adoption encouraged with faster clearances.
Delhi Pollution Control Committee (DPCC): Yamuna pollution is a political flashpoint. Industries near the river face maximum scrutiny. Frequent PIL-driven interventions.
The NGT Factor: Environmental Justice Moves Faster
The National Green Tribunal has become the most feared entity in Indian environmental compliance. Unlike traditional courts, NGT operates with:
Expedited hearing schedules (often within weeks, not years)
Authority to order immediate closures without lengthy appeals
Power to impose environmental compensation running into crores
Suo moto cognizance of pollution incidents based on media reports or complaints
Recent NGT interventions have resulted in:
Closure of entire industrial clusters in UP and Haryana
Personal liability imposed on directors and CEOs
Environmental compensation orders exceeding original penalties by 10-20x
Criminal prosecution referrals for willful non-compliance
The lesson is clear: by the time your case reaches NGT, you have already lost. Prevention is the only viable strategy.
The Hidden Drain on Profits, Why Your ETP is Bleeding Money
The Chemical Dependency Trap
Most Indian ETPs operate on a chemical-intensive treatment model inherited from Western engineering practices developed in the 1970s and 80s. While these systems can achieve compliance, they do so at an extraordinary hidden cost that most factory managers have never properly calculated.
The True Cost of Chemical-Dependent Treatment:
A typical 500 KLD (kiloliters per day) ETP in a medium-scale textile or pharmaceutical facility spends approximately:
Coagulants (Alum, Ferric Chloride): ₹1.2-1.8 lakhs per month
Flocculants (Polyelectrolytes): ₹80,000-1.2 lakhs per month
pH Adjusters (Caustic Soda, Sulfuric Acid): ₹60,000-90,000 per month
Disinfectants (Chlorine, Hypochlorite): ₹40,000-60,000 per month
Specialty Chemicals (Defoamers, etc.): ₹30,000-50,000 per month
Annual Chemical Expenditure: ₹36-50 lakhs
But the actual cost extends far beyond chemical procurement:
Hidden Cost #1: Sludge Generation and Disposal Chemical coagulation generates 3-5 times more sludge than biological treatment. For every ton of chemicals added, you create approximately 1.2-1.8 tons of additional sludge that must be:
Dewatered (energy cost)
Transported to authorized disposal facilities (₹2,500-4,500 per ton)
Disposed with proper manifests (regulatory burden)
Annual sludge disposal cost for the same 500 KLD facility: ₹18-28 lakhs
Hidden Cost #2: Energy Consumption Chemical treatment requires:
Continuous mixing for coagulation and flocculation
High-pressure pumping for clarifiers and filter presses
Extended aeration to compensate for reduced biological activity
The energy footprint of a chemical-dependent ETP is typically 40-60% higher than an optimized biological system. At industrial power tariffs (₹6-8 per unit in most states), this translates to an additional ₹8-15 lakhs annually.
Hidden Cost #3: Equipment Degradation Harsh chemicals accelerate corrosion and wear on:
Pumps and piping (requiring replacement every 3-5 years instead of 7-10)
Sensors and monitoring equipment (calibration drift, sensor poisoning)
Concrete structures (acid/alkali attack on clarifier tanks)
Replacement and maintenance costs: ₹5-8 lakhs annually
Hidden Cost #4: Inconsistent Performance Perhaps the most expensive hidden cost is variability. Chemical treatment is highly sensitive to:
There’s another cost that never appears on balance sheets but affects every factory manager dealing with a chemically-dependent ETP: stress and uncertainty.
When your compliance depends on precise chemical dosing that must be manually adjusted throughout the day, you carry constant anxiety about:
Will the morning shift operator remember to increase polymer dose when the cooling water blowdown increases?
Did the night shift properly account for the pH spike from the cleaning chemicals in the wastewater?
Is the recent increase in COD due to a process change or chemical underdosing?
This operational uncertainty translates into:
Over-conservative chemical dosing (wasting money to buy peace of mind)
Excessive monitoring and testing (labor and lab costs)
Deferred production decisions (waiting to confirm ETP can handle load changes)
The Bottom Line: The same 500 KLD facility spending ₹50 lakhs on chemicals is actually spending ₹80-100 lakhs annually on total ETP operations when all hidden costs are included. For many SMEs, this represents 2-4% of total revenue, a material impact on profitability that compounds year after year.
The Bioremediation Solution, Why Microbes Outperform Chemicals in Indian Conditions
Bioremediation is the process of using naturally occurring or specially cultivated microorganisms to break down pollutants in wastewater. Unlike chemical treatment that physically separates contaminants, bioremediation actually consumes and converts organic pollutants into harmless byproducts: primarily carbon dioxide, water, and biomass.
The concept is simple, but the execution requires sophisticated understanding of microbial ecology, wastewater characteristics, and operational parameters.
How Bioremediation Works in an Industrial ETP:
Specialized bacterial consortia are introduced into the biological treatment stages of your ETP. These microbes include:
Operates across a wide range of temperatures and pH levels
Why Bioremediation Excels in Indian Industrial Conditions
India’s industrial wastewater presents unique challenges that make bioremediation particularly effective:
Challenge #1: High Organic Load Variability Indian manufacturing often involves batch production with significant load variations. A dyeing unit might process heavy cotton batches in the morning and light synthetics in the afternoon. A food processing unit experiences seasonal variations with different crops.
Chemical treatment struggles with variability because dosing must be constantly adjusted. Bioremediation naturally adapts because microbial populations increase when food (pollutants) is abundant and decrease when it’s scarce. This biological buffering creates stable discharge quality despite influent fluctuations.
Challenge #2: Tropical Climate Advantages India’s warm climate (except in winter months in northern regions) is ideal for biological treatment. Microbial metabolic rates approximately double for every 10°C temperature increase up to optimal ranges.
While European and North American facilities struggle to maintain biological treatment efficiency during cold winters, Indian facilities operate in the optimal temperature range (25-40°C) for most of the year. This natural advantage is wasted in chemical-dependent systems but fully leveraged in bioremediation.
Challenge #3: Complex Industrial Pollutant Mixtures Indian industrial effluent often contains complex mixtures that are difficult to treat chemically:
Pharmaceutical effluent: Active pharmaceutical ingredients, solvents, high-salt content
Food processing: High BOD from sugars, proteins, fats, seasonal composition changes
Specialized microbial consortia can be tailored to target these specific pollutant profiles. Certain bacteria strains excel at breaking down azo dyes. Others specialize in degrading pharmaceutical residues. A properly designed bioremediation program assembles the right team of microbes for your specific wastewater signature.
Challenge #4: Water Scarcity and Reuse Requirements Many Indian industrial regions face acute water stress. Groundwater depletion in areas like Tiruppur, Ludhiana, and Surat has made water recycling a business necessity, not just an environmental preference.
Bioremediation produces treated water of significantly higher quality than chemical treatment, making it more suitable for recycling in cooling towers, gardening, or even certain process applications. The lower dissolved solids and minimal chemical contamination mean less scaling, corrosion, and fouling in recycled water systems.
The Economics of Bioremediation: Real Numbers from Indian Facilities
Let’s return to our 500 KLD facility example and compare actual operational costs:
Annual Operating Costs Comparison:
Cost Component
Chemical Treatment
Bioremediation
Savings
Primary treatment chemicals
₹48 lakhs
₹12 lakhs
₹36 lakhs
Microbial cultures
,
₹8 lakhs
,
Sludge disposal
₹25 lakhs
₹8 lakhs
₹17 lakhs
Energy consumption
₹18 lakhs
₹12 lakhs
₹6 lakhs
Maintenance & equipment
₹8 lakhs
₹4 lakhs
₹4 lakhs
Total Annual Cost
₹99 lakhs
₹44 lakhs
₹55 lakhs
Payback Period: Most bioremediation implementations in Indian facilities achieve full payback within 8-14 months, even accounting for any necessary equipment modifications or initial consulting costs.
Case Study: Textile Dyeing Unit in Tamil Nadu A 750 KLD facility treating complex dye effluent was struggling with:
Monthly chemical costs of ₹6.8 lakhs
Inconsistent COD removal (discharge frequently 180-220 mg/L against limit of 160 mg/L)
Avoiding the Red Category Trap, Actionable Steps to Stay Compliant and Operational
Understanding Industry Categorization: Red, Orange, Green, White
The CPCB classifies industries based on Pollution Index scores that consider:
Type and volume of pollutants generated
Environmental impact potential
Resource consumption intensity
Red Category (Pollution Index ≥60): Highest scrutiny industries including pharmaceuticals, dye intermediates, pesticides, petroleum refining, tanneries, cement. These facilities face:
Mandatory CEMS installation
Quarterly SPCB inspections (minimum)
Stringent consent conditions
First targets for closure during pollution emergencies
Orange Category (Pollution Index 41-59): Moderate polluters including many textile operations, food processing, chemicals manufacturing. Requirements include:
Annual consent renewals
Regular self-monitoring with certified labs
Growing pressure to install real-time monitoring
Green Category (Pollution Index ≤40): Lower-impact industries with less stringent requirements but still subject to inspections and enforcement.
If your industry falls in Red or Orange categories, the compliance burden is substantial and growing. Here’s how to stay ahead of enforcement.
The Compliance Checklist: Ten Non-Negotiable Requirements
Requirement #1: Consent to Establish (CTE) and Consent to Operate (CTO) These are your license to operate. Operating without valid consent carries:
Immediate closure orders
Fines up to ₹1 lakh per day
Criminal prosecution under Environmental Protection Act
Action Items:
Set calendar reminders 90 days before CTO expiry
Maintain organized files with all previous consents, amendments, and correspondence
Never operate even one day without valid consent
Requirement #2: Functional ETP with Design Capacity Your ETP must be:
Designed by a qualified environmental engineer
Sized for actual wastewater generation (not underestimated)
Properly maintained with documented service records
Common Pitfall: Many facilities report lower wastewater volumes in their CTO applications to reduce compliance burden, then struggle when actual discharge exceeds consented capacity during inspections.
Requirement #3: Certified Laboratory Testing Self-monitoring reports must come from NABL-accredited or CPCB-recognized labs. Using in-house testing or non-certified labs invalidates compliance documentation.
Best Practice: Establish relationships with 2-3 certified labs to ensure capacity during busy inspection seasons.
Requirement #4: Proper Record Maintenance SPCBs require meticulous documentation:
Daily ETP operation logs (operator signatures, chemical consumption, flow rates)
Monthly discharge monitoring reports
Sludge disposal manifests (tracking from generation to authorized disposal)
Equipment maintenance records
Chemical purchase invoices (to cross-verify consumption claims)
These records must be maintained for a minimum of three years and produced during inspections.
Requirement #5: Trained Operators Red category industries must have operators with formal ETP training certification. Even for other categories, demonstrated competence is expected.
Recommendation: Send operators for CPCB-recognized training programs. Document all training with certificates on file.
Requirement #6: Emergency Response Preparedness You must have documented procedures for:
Chemical spill response (containment, cleanup, reporting)
Toxic shock recovery (rapid response protocols)
SPCB inspectors increasingly verify these procedures during audits.
Requirement #7: Groundwater Monitoring Facilities in water-stressed regions or those using groundwater must install monitoring wells and conduct quarterly analysis for:
Water table levels
Groundwater quality parameters
Evidence of contamination migration
Requirement #8: Air Emission Compliance (if applicable) Many industrial facilities have air emissions from ETP operations:
Odor from biological treatment
VOCs from aeration tanks
Scrubber emissions
These require separate consents and monitoring.
Requirement #9: Hazardous Waste Management ETP sludge is often classified as hazardous waste requiring:
Storage in designated areas with proper signage
Disposal through CPCB-authorized facilities only
Annual returns filing on CPCB portal
Maintenance of waste disposal manifests
Requirement #10: Online Compliance Portals Most SPCBs now require electronic filing through state portals:
Annual Environmental Statements
Consent applications and renewals
Self-monitoring data uploads
Hazardous waste annual returns
Failure to file electronically on time results in automatic delays in consent processing.
The Inspection Survival Guide: What Happens and How to Respond
Despite best efforts, surprise inspections will occur. Here’s how to navigate them professionally:
During the Inspection:
Do’s:
Immediately inform senior management
Assign a knowledgeable escort (preferably ETP in-charge or compliance officer)
Provide requested documents promptly
Allow sampling but request duplicate samples for your own testing
Note down sample collection time, location, and inspector details
Remain professional and cooperative
Don’ts:
Never deny entry to inspectors with valid authorization
Don’t volunteer information beyond what’s asked
Avoid making admissions of non-compliance
Never offer or suggest anything that could be construed as bribery
Don’t obstruct sampling or photography
Post-Inspection Protocol:
Immediately test your own samples at a certified lab (use the duplicate samples)
Document everything: who was present, what was inspected, what was sampled, what was discussed
If a show cause notice is issued, respond within the specified timeframe (typically 7-15 days)
Engage an environmental consultant or lawyer if violations are serious
Implement immediate corrective actions and document them
When Things Go Wrong: Responding to Notices and Violations
Show Cause Notice (SCN): This is your opportunity to explain. Your response should:
Acknowledge receipt immediately
Provide a detailed technical explanation (not excuses)
Document corrective actions already taken
Propose a timeline for additional improvements
Include supporting evidence (lab reports, photographs, purchase orders)
Direction for Improvement: Typically gives 30-90 days to rectify issues. Your response should:
Submit a detailed action plan with milestones
Provide weekly progress updates
Engage qualified consultants to oversee improvements
Request extension if needed (with justification) before deadline expires
Closure Notice: This is the most serious. Immediate actions:
Engage legal counsel experienced in environmental law
Apply for interim stay if grounds exist
Implement maximum corrective measures immediately
Consider approaching NGT for appeal if closure is unjustified
Financial Penalties: Pay promptly. Delayed payment increases amounts and makes future appeals difficult.
The Path Forward, Building a Sustainable Compliance Framework
Beyond Compliance: The Business Case for Environmental Excellence
The factories that thrive in India’s evolving regulatory landscape don’t view compliance as a burden, they recognize it as a competitive advantage.
Advantage #1: Operational Resilience Facilities with robust ETPs and consistent compliance records experience:
Uninterrupted production (no shutdown risks)
Predictable operating costs (no emergency chemical purchases or expedited sludge disposal)
Better employee morale (operators aren’t constantly stressed about violations)
Advantage #2: Market Access International buyers increasingly require environmental compliance documentation. ISO 14001 certification, sustainability reports, and clean compliance records are becoming prerequisites for export contracts. Textile exporters to EU and US markets find that strong environmental credentials can command 3-5% price premiums.
Advantage #3: Financial Benefits Banks and financial institutions consider environmental compliance in lending decisions. Facilities with clean records access:
Lower interest rates on working capital
Faster approvals for expansion financing
Eligibility for green financing schemes with subsidized rates
Advantage #4: Community Relations Facilities in industrial clusters with poor overall environmental records face community opposition to expansions. Being the “clean factory” in a polluted area provides social license to operate and grow.
Technology Roadmap: Where Indian ETP Technology is Heading
The next five years will see rapid adoption of:
Advanced Biological Treatment:
MBBR (Moving Bed Biofilm Reactor) systems becoming standard for space-constrained facilities
MBR (Membrane Bioreactor) for facilities requiring high-quality treated water for reuse
Anaerobic treatment for high-COD waste streams (recovering biogas as energy source)
Automation and Control:
AI-driven dosing optimization systems
Predictive maintenance using IoT sensors
Mobile apps for remote ETP monitoring
Resource Recovery:
Phosphorus recovery from sludge (as fertilizer)
Metal recovery from specific industrial waste streams
Energy generation from biogas and waste heat
Facilities planning major ETP upgrades should consider these technologies now to future-proof investments.
CTO renewal application (start 90 days before expiry)
Environmental statement filing
Hazardous waste annual returns
Comprehensive ETP audit
Budget planning for next year’s compliance costs
Scaling Your Compliance, Team One Biotech as Your Partner
Why Specialized Bioremediation Expertise Matters
Transitioning from chemical-dependent treatment to bioremediation isn’t a simple product purchase, it’s a transformation that requires:
Deep understanding of microbial ecology in industrial wastewater
Experience with Indian industrial conditions and regulatory requirements
Ability to troubleshoot and optimize during the critical acclimatization period
Long-term support as your operations evolve
This is where Team One Biotech (T1B) has established itself as India’s leading bioremediation partner for industrial facilities.
The T1B Difference: Proven Results Across Indian Industries
Team One Biotech brings over a decade of specialized experience in industrial wastewater bioremediation across India’s most challenging sectors:
Textile and Dyeing: Successful implementations in Tiruppur, Surat, and Ludhiana treating complex dye chemistry with consistent COD reductions exceeding 85%.
Pharmaceutical and Chemical: Expertise handling high-salt effluent, antibiotic residues, and solvent-laden waste streams in Hyderabad, Vadodara, and Bangalore facilities.
Food Processing: Seasonal load management for sugar mills, dairy facilities, and beverage plants across Maharashtra, Punjab, and Tamil Nadu.
Pulp and Paper: Lignin and color removal in paper mills with significant reduction in chemical consumption and sludge generation.
Our Approach: Customized Solutions, Not Off-the-Shelf Products
T1B doesn’t believe in one-size-fits-all solutions. Our process includes:
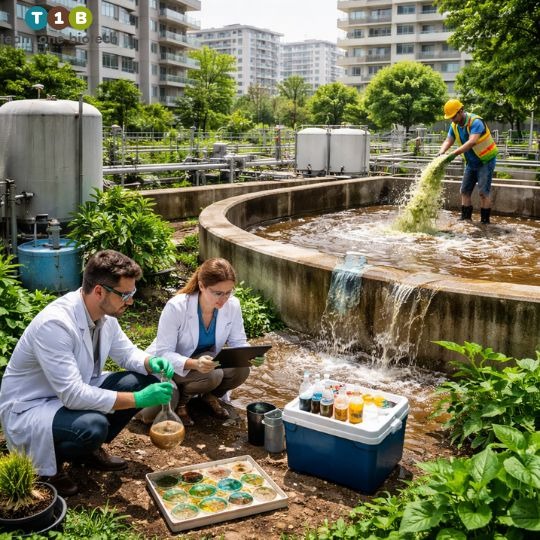
Phase 1: Comprehensive Assessment (Week 1-2)
Site visit and ETP audit by qualified microbiologist
Wastewater characterization and load profiling
Operator interviews to understand operational challenges
Preliminary feasibility report with cost-benefit analysis
Phase 2: Customized Program Design (Week 3-4)
Selection of microbial consortia specific to your waste profile
Dosing protocol development
Operational parameter optimization (aeration, retention time, nutrient supplementation)
Training program design for your operators
Phase 3: Implementation and Acclimatization (Month 2-3)
Phased introduction of bioremediation cultures
Weekly monitoring of biological indicators
Progressive reduction of chemical dependency
Real-time troubleshooting support
Phase 4: Performance Validation (Month 4-6)
Discharge quality verification through certified labs
Cost savings documentation
Operational stability confirmation
Handover to routine maintenance mode
Phase 5: Ongoing Support
Monthly supply of microbial cultures
Quarterly performance reviews
Annual refresher training for operators
Emergency support for shock load events or upsets
Quality Assurance: What Sets T1B Products Apart
High Viable Cell Counts: Minimum 10^9 CFU/gram (most competitors provide 10^6-10^7)
Rapid Activation: Proprietary packaging maintains cell viability; cultures activate within 48 hours (not 2-3 weeks like spore-based products)
Proven Strains: All organisms isolated from Indian industrial environments, not imported strains that may not adapt to local conditions
Shelf Stability: Guaranteed 12-month shelf life with proper storage; no refrigeration required
Technical Documentation: Complete characterization data, safety data sheets, and application guidelines with every order
Third-Party Validation: Performance verified by NABL-accredited laboratories in customer facilities
Accessing T1B Products: Introducing Our Alibaba Store
Understanding that modern procurement requires flexibility and transparency, Team One Biotech has launched our official presence on Alibaba.com, the world’s largest B2B marketplace.
Why T1B on Alibaba Benefits You:
Global Standard Pricing: Transparent pricing accessible to facilities of all sizes, from small SMEs to large industrial groups.
Bulk Procurement Convenience: Order anything from trial quantities (5 kg) to bulk shipments (500+ kg) through a single, streamlined platform.
Secure Transactions: Alibaba’s Trade Assurance protects your payment until delivery confirmation.
Verified Supplier Status: T1B maintains Alibaba’s Gold Supplier certification with verified business credentials and quality assessments.
International Reach: For corporate groups with manufacturing facilities across South Asia, Middle East, or Africa, unified procurement through one trusted partner.
Documentation and Support: Every order includes complete technical documentation, application guidelines, and access to our technical support team.
Beyond Products: T1B’s Commitment to Your Success
Our relationship doesn’t end with product delivery. T1B provides:
24/7 Technical Helpline: WhatsApp support group connecting you directly to our microbiologists for urgent troubleshooting.
Knowledge Resources: Regular webinars on ETP optimization, compliance updates, and emerging technologies. Access to our technical library with application notes and case studies.
Compliance Assistance: While we’re not legal consultants, our team has extensive experience navigating SPCB requirements and can guide documentation for bioaugmentation programs.
Performance Guarantees: We stand behind our products. If discharge parameters don’t improve within the guaranteed timeframe under proper implementation, we’ll reformulate your consortium at no additional charge.
Compliance as Competitive Advantage in 2026
The industrial landscape in India has irrevocably changed. The regulatory environment that once allowed flexibility and negotiation has been replaced by automated monitoring, strict enforcement, and severe consequences for non-compliance.
But this transformation, while challenging, also presents unprecedented opportunities for forward-thinking manufacturers. The gap between compliant and non-compliant facilities has never been wider, and that gap represents competitive advantage for those who embrace environmental excellence.
The facilities that will lead Indian manufacturing in the next decade are those that:
View compliance as investment, not expense: Every rupee spent on proper ETP operations returns multiples in avoided fines, uninterrupted production, and market access.
Adopt proven, efficient technologies: Bioremediation isn’t experimental, it’s the established standard in advanced economies and increasingly in India’s best-performing facilities.
Build institutional knowledge: Training operators, documenting processes, and creating organizational memory around environmental management.
Partner with specialists: Just as you wouldn’t handle complex taxation without a qualified CA or legal matters without counsel, environmental compliance deserves specialized expertise.
The choice before every factory manager, ETP operator, and CEO is clear: manage compliance reactively with chemical band-aids and constant anxiety about the next inspection, or invest in sustainable systems that deliver both regulatory certainty and operational savings.
Team One Biotech exists to make that second path accessible, affordable, and achievable for Indian manufacturers of all sizes. Whether you’re a small-scale unit taking the first steps toward reliable compliance or a large industrial group optimizing multiple facilities, our expertise in bioremediation combined with our commitment to your operational success makes us the partner of choice.
Secure Your CTO Status Today. Reduce Your ETP Costs Tomorrow. Build Sustainable Operations for the Future.
Looking to improve your ETP/STP efficiency with the right bioculture? Talk to our experts at Team One Biotech for customised microbial solutions.
The loo winds swept across the wheat fields of Bathinda in April 2024, carrying with them temperatures that touched 47°C. Harjit Singh watched his crop wilt despite having applied the recommended doses of urea and DAP. His tubewell ran dry by mid-May. That season, he lost 40% of his expected yield.
Harjit’s story is not isolated. Across Punjab, Haryana, Madhya Pradesh, and Maharashtra, farmers are confronting a harsh new reality: the fertilizers that once promised abundance are now powerless against the twin crises of erratic rainfall and relentless heat. The 2025 monsoon arrived three weeks late in parts of Vidarbha. When it did come, it brought flooding, not relief. Between these extremes, the soil, exhausted from decades of chemical dependency, has lost its ability to buffer crops against stress.
This is not a problem that can be solved with another bag of NPK. The solution lies beneath our feet, in the billions of microorganisms that once made Indian soils among the most fertile on earth. Restoring that microbial life is not just about yields. It is about survival.
The Hidden Crisis Beneath Indian Farms
Walk into any agricultural supply store in rural India, and the shelves tell a story: stacks of urea, DAP, potash, and an ever-growing array of pesticides. For fifty years, this chemical-intensive model delivered results. But the soil has a memory, and it is now demanding payment.
Consider the numbers. Groundwater tables in Punjab have dropped by over 20 meters in the past two decades. Coastal regions in Gujarat and Andhra Pradesh battle increasing soil salinity as seawater intrusion worsens. In the black cotton soils of Maharashtra, organic carbon content has fallen below 0.5%, a threshold below which soil is considered biologically dead.
The problem is structural. Chemical fertilizers provide nutrients, but they do nothing to build soil structure or water-holding capacity. Repeated applications have disrupted the soil’s natural pH balance, killed beneficial microbes, and left behind residues that actually inhibit plant growth under stress conditions. When a heatwave strikes or rains fail, these soils have no resilience. They crack, harden, and release whatever moisture they held within hours.
This is where the conversation must shift. The question is no longer “how much fertilizer should I apply?” but rather “how do I rebuild my soil’s ability to protect my crops when nature turns hostile?”
The Invisible Shield: How Microbes Build Crop Resilience
Soil is not merely a growing medium. It is a living ecosystem, home to bacteria, fungi, protozoa, and countless other organisms that form symbiotic relationships with plant roots. When these relationships are intact, crops can withstand stress that would otherwise be catastrophic.
At the heart of this system are Plant Growth-Promoting Rhizobacteria (PGPR) and mycorrhizal fungi. These microbes do not just feed the plant, they fundamentally alter how the plant responds to environmental stress.
What PGPR do during drought:
Produce ACC-deaminase enzymes that break down ethylene, the plant’s stress hormone
Synthesize osmolytes (compounds like proline and glycine betaine) that help plant cells maintain water balance
Secrete exopolysaccharides (EPS) that bind soil particles together, improving water retention
Enhance root branching and depth, allowing plants to access moisture from deeper soil layers
What mycorrhizal fungi contribute:
Extend root systems through fungal networks that can reach water sources up to 100 times farther than roots alone
Increase phosphorus uptake even in water-stressed conditions
Form protective sheaths around roots that reduce water loss
Break down organic matter, releasing nutrients slowly over time
The difference is measurable. Studies conducted on wheat in water-stressed conditions in Haryana showed that crops treated with PGPR maintained 65% higher relative water content in leaves compared to chemical-only treatments. In tomato crops subjected to 42°C heat stress in Karnataka, mycorrhizal inoculation reduced leaf wilting by 50% and maintained photosynthetic efficiency.
This is not theoretical. This is biology doing what chemistry cannot, preparing plants for uncertainty.
The Mechanics of Microbial Resilience
Understanding how microbes confer stress tolerance requires looking at what happens at the cellular level when a plant faces extreme heat or water scarcity.
When temperatures exceed 40°C, plants produce ethylene, a hormone that triggers premature aging, leaf abscission, and flower drop. PGPR bacteria containing ACC-deaminase cleave the ethylene precursor (ACC) before it can be converted into the stress hormone. The result: plants stay greener longer, retain flowers, and continue photosynthesis even under thermal stress.
During drought, plant cells lose turgor pressure and collapse. Microbes counter this by inducing the production of compatible solutes, organic compounds that stabilize proteins and cell membranes. Proline, for instance, acts like an internal antifreeze, protecting cellular machinery even as external water becomes scarce. Crops inoculated with proline-producing bacteria show significantly lower membrane damage and maintain higher stomatal conductivity.
Perhaps most importantly, microbial activity rebuilds soil architecture. Exopolysaccharides secreted by beneficial bacteria act as a biological glue, binding clay, silt, and organic matter into stable aggregates. These aggregates create pore spaces that hold water like a sponge while still allowing excess moisture to drain. In field trials across drought-prone regions of Rajasthan, soils treated with microbial consortia retained 30% more water at field capacity compared to untreated controls.
The heat tolerance mechanism is equally elegant. Certain thermotolerant bacteria produce heat shock proteins (HSPs) that transfer to plant roots. These proteins help stabilize enzymes and cell membranes, essentially teaching the plant to function at temperatures that would otherwise denature its critical proteins.
Bioremediation: Healing Soil Before Rebuilding It
Here is where Team One Biotech’s expertise becomes essential. Introducing beneficial microbes into chemically saturated soil is like planting seeds in concrete. The soil must first be detoxified.
Bioremediation addresses the legacy of chemical agriculture by using specialized microorganisms to break down pesticide residues, heavy metals, and excess salts that have accumulated over decades. This is not a cosmetic fix. It is a restoration of the soil’s biological capacity.
In coastal Andhra Pradesh, where soil salinity has made large tracts unviable for traditional crops, bioremediation protocols using halotolerant bacteria have reduced electrical conductivity (EC) levels by up to 40% within two cropping seasons. In Punjab fields contaminated with lindane and chlorpyrifos residues from decades of pesticide use, targeted microbial consortia degraded these compounds, allowing subsequent bio-fertilizer applications to establish successfully.
The principle is simple: you cannot expect beneficial microbes to colonize hostile environments. Bioremediation creates the conditions for biological regeneration. It is the foundation upon which microbial crop resilience is built.
Team One Biotech approaches this systematically. Soil testing identifies specific contaminants and deficiencies. Custom microbial formulations target those issues. Over time, the native microbial population rebounds, creating a self-sustaining system where beneficial organisms proliferate naturally.
This is not a one-season intervention. It is a multi-year commitment to soil health that pays dividends in drought resistance, heat tolerance, and ultimately, stable yields regardless of weather extremes.
Practical Steps for Indian Farmers: Transitioning to Bio-Integrated Systems
The shift from chemical dependency to biological resilience does not happen overnight, nor does it require abandoning conventional inputs entirely, at least not initially. The goal is integration, not replacement.
Year One: Assessment and Foundation
Conduct comprehensive soil testing including microbial biomass, organic carbon, and contaminant screening
Apply bioremediation formulations to address chemical residues and pH imbalances
Reduce chemical fertilizer input by 25%, replacing with microbial seed treatments and soil inoculants
Focus on PGPR formulations that contain ACC-deaminase producing strains
Incorporate organic amendments (vermicompost, farm yard manure) to feed the growing microbial population
Reduce chemical inputs by another 25%
Monitor water retention capacity and crop stress indicators
Year Three: Optimization
Aim for 50% reduction in chemical fertilizers while maintaining or exceeding previous yield levels
Implement cover cropping during off-seasons to maintain microbial activity
Use bio-fertilizers as the primary nutrient source with chemicals only as targeted supplements
Critical practices throughout:
Avoid broad-spectrum fungicides that kill beneficial microbes along with pathogens
Maintain soil moisture during establishment phase through drip irrigation or mulching
Test soil microbial counts annually to track biological recovery
Farmers in Jalgaon, Maharashtra, following this protocol reported 35% lower irrigation requirements by the third year while maintaining comparable cotton yields despite two consecutive low-rainfall seasons. The soil’s improved structure and active microbial community created a buffer against climatic variability that chemicals alone could never provide.
A Living Future for Indian Agriculture
The Second Green Revolution will not be written in fertilizer bags. It will be measured in the invisible life beneath our feet, the bacteria that teach plants to conserve water, the fungi that extend roots into untapped reserves, the enzymes that neutralize stress before it can damage yields.
Team One Biotech’s work in bioremediation and bio-solutions represents more than products. It is a recognition that Indian agriculture needs healing before it can become resilient. The degraded soils of Punjab, the saline fields of Gujarat, the heat-stressed farms of Vidarbha, these are not lost causes. They are ecosystems waiting to be reawakened.
Microbial crop resilience is not about returning to pre-modern farming. It is about applying cutting-edge biological science to restore the natural mechanisms that made Indian soils legendary. When PGPR reduces ethylene stress, when mycorrhizae extend water access, when bioremediation clears decades of chemical burden, we are not romanticizing tradition. We are deploying precision biology to solve modern problems.
The farmers who adopt these systems will not do so because of sentiment. They will do so because when the loo winds blow at 47°C, when the monsoon fails for the third year running, their crops will still stand. Their soil will still hold water. Their families will still eat.
Ready to transform your farm’s resilience against climate extremes? Connect with Team One Biotech’s agronomy team for a customized soil health assessment and microbial solution plan tailored to your region’s specific challenges. Because sustainable yields begin with living soil.
Looking to improve your ETP/STP efficiency with the right bioculture? Talk to our experts at Team One Biotech for customised microbial solutions.
Ramesh Patil had done everything right. Or so he thought.
The 48-year-old sugarcane farmer from Sangli district had invested heavily in drip irrigation five years ago, convinced it would solve his water problems and boost yields. He’d followed the advice of every fertilizer dealer in the market, pumping his fields with potassium nitrate, phosphoric acid, and urea through those precision emitters. His soil test reports showed adequate NPK levels. Yet, season after season, his yields plateaued and then began to decline.
The earth had become hard. Unresponsive. Dead.
What Ramesh didn’t know, what thousands of Indian farmers are only now discovering, is that he’d been feeding the plant while starving the soil. His drip system, that marvel of modern agriculture, had become a delivery mechanism for a slow poisoning. The chemical salts had built up. The soil pH had crashed. And most critically, the billions of microorganisms that once made his soil alive had simply disappeared.
This is the hard earth reality facing Indian agriculture today. But it’s also the doorway to a profound transformation, one that begins not with more chemicals, but with restoring the biological intelligence of our soils through bio-fertilizers in drip irrigation.
Let’s speak plainly about what’s happening beneath our feet.
The Punjab breadbasket, which fed the Green Revolution, now suffers from such severe micronutrient deficiency and organic carbon depletion that wheat yields have stagnated for over a decade. In Maharashtra’s grape belt, soil salinity has rendered thousands of hectares marginal. Cotton farmers in Vidarbha pump more DAP every year while watching their input costs devour their profits and their soil structure collapse into powder.
The government’s Soil Health Card scheme has confirmed what traditional farmers always knew: healthy soil is living soil. Current data shows that over 60% of Indian agricultural soils are deficient in organic carbon, with levels below the critical 0.5% threshold. When organic matter dies, so does the soil’s capacity to hold water, cycle nutrients, or support plant immunity.
Chemical fertilizers deliver nutrients, yes, but they’re hardware without software. They don’t build soil structure. They don’t create nutrient banks. They don’t protect roots from pathogens or help crops withstand drought stress. They’re a transaction, not a relationship.
Bio-fertilizers, by contrast, are the soil’s software engineers.
Understanding the Science of Bio-Fertigation
Fertigation, the practice of delivering fertilizers through irrigation systems, revolutionized precision agriculture. When you combine this precision with biological inputs rather than chemical ones, you create something entirely new: a living delivery system that rebuilds soil health while feeding crops.
Here’s how the science works:
Nitrogen Fixation Through the Drip Line
Liquid bio-fertilizers containing Azotobacter and Rhizobium species don’t just supply nitrogen, they colonize the root zone and manufacture it from atmospheric sources. When delivered through drip irrigation, these bacteria establish themselves in the exact zone where root activity is highest. In a properly managed system, these microbes can fix 20-30 kg of nitrogen per hectare per season, reducing chemical nitrogen dependence by up to 25%.
Phosphorus Solubilization at the Emitter Point
Phosphate-solubilizing bacteria (PSB) like Bacillus megaterium and Pseudomonas species work differently than DAP. They don’t add phosphorus, they unlock what’s already there. Indian soils often contain 300-500 kg of bound phosphorus per hectare that plants cannot access. PSB produce organic acids that release this locked phosphate, making it bioavailable exactly where the drip emitter creates that moist, active root zone.
The Potassium Connection
Potash-mobilizing bacteria work on the same principle, transforming insoluble potassium minerals in the soil into plant-available forms. This is particularly crucial for crops like pomegranate and grapes, which are heavy potassium feeders.
The beauty of bio-fertigation is precision meets biology. You’re not broadcasting microbes across a field and hoping they survive. You’re placing them, with water, directly into the active root zone where they can immediately begin their work.
The Technical Challenge: Making Biology Work in Drip Systems
Here’s where many farmers stumble, and understandably so. Drip irrigation systems are engineered for liquid chemicals, inert, stable, predictable. Living organisms are none of these things. They need oxygen. They can clump. They can potentially clog those tiny emitter holes that cost thousands of rupees per acre to install.
But these challenges are entirely solvable with proper technique.
Filtration is Non-Negotiable
Your drip system should already have screen or disc filters for preventing sediment clogging. For bio-fertilizers, these same filters work, but you need to be more vigilant. Use filters in the 120-200 mesh range. After applying bio-fertilizers, flush the system with clean water for 10-15 minutes. This prevents any bacterial biomass from settling in the laterals overnight.
Quality liquid bio-fertilizers formulated for fertigation should have minimal suspended solids. If you’re seeing thick sludge or sediment in the bottle, that’s a red flag about manufacturing quality.
Timing Matters More Than You Think
Apply bio-fertilizers during the cooler parts of the day, early morning before 9 AM or late evening after 5 PM. This isn’t just folklore. UV radiation kills beneficial bacteria. High temperatures stress them. Applying during midday in the Indian summer is essentially sterilizing your product in the field.
Moreover, cooler temperatures mean the irrigation water itself is cooler, and these microorganisms are sensitive to thermal shock. Water temperature above 35°C significantly reduces bacterial survival.
The Farmer’s Manual: Best Practices for Bio-Fertigation
Let me give you a protocol that works, tested across thousands of acres from Nashik’s grape farms to Davangere’s cotton fields.
Pre-Application: The Jar Test
Before you inject any bio-fertilizer into your system, do this simple compatibility test. Take a clean glass jar. Add 100 ml of your irrigation water. Add the recommended dose of bio-fertilizer. If you’re using any other inputs, add them in sequence. Wait 30 minutes.
What you’re looking for: the solution should remain uniformly mixed without precipitation, flocculation, or phase separation. If you see particles settling or layers forming, you have a chemical incompatibility. Bio-fertilizers are generally incompatible with strongly acidic fertilizers (pH below 4) or heavy metal-containing compounds.
Application Protocol
Step 1: Irrigate First Run your drip system with plain water for 15-20 minutes. This primes the soil, creates uniform moisture, and ensures your emitters are functioning properly.
Step 2: Prepare the Bio-Fertilizer Solution In a clean container, mix the liquid bio-fertilizer with water at the manufacturer’s recommended dilution. For most products, this is 2-5 liters per acre diluted in 50-100 liters of water. Never mix concentrated bio-fertilizer directly into your fertilizer tank.
Step 3: Inject and Monitor Using your venturi system or fertilizer tank, inject the bio-fertilizer solution over 30-45 minutes. This slow injection ensures even distribution. Walk your field and check that all emitters are flowing uniformly.
Step 4: Flush the System This is the step farmers skip, and it’s costly. After bio-fertilizer injection, continue irrigation with clean water for another 15-20 minutes. This pushes the solution out of the laterals and into the root zone, preventing microbial buildup in the lines.
Storage Discipline
Liquid bio-fertilizers are living products with shelf lives. Store them in a cool, shaded location, never in direct sunlight or in a tin shed where summer temperatures exceed 40°C. Most products remain viable for 12-18 months if stored properly, but check expiration dates. A dead bio-fertilizer is just expensive water.
Frequency and Dosage
For crops like sugarcane and cotton with 5-6 month growth cycles, apply bio-fertilizers through drip every 20-30 days during active growth phases. For perennials like pomegranate and grapes, monthly applications during the growing season yield best results. The key is consistency, you’re building a microbial community, not delivering a one-time nutrient hit.
Chemical Fertigation vs. Bio-Fertigation: The Real Comparison
This table tells a story. Chemical fertigation is a sprint that exhausts the runner. Bio-fertigation is training that builds endurance.
The Bioremediation Dimension: Healing Damaged Soils
Here’s where we need to talk about soils that are already compromised, and there are millions of hectares in this category across India.
Bioremediation is the use of living organisms to restore degraded environments. In agriculture, it means using specific microbial consortia to reverse chemical damage, break down pesticide residues, and rebuild soil organic matter.
Consider a cotton field in Yavatmal that’s received heavy applications of chemical fertilizers and pesticides for 20 years. The soil is compacted, acidic, and biologically depleted. You can’t fix this overnight with compost or organic matter alone, you need microbial intervention to restart the biological processes that make soil healthy.
This is where specialized bio-fertilizers go beyond simple nutrient provision. Products containing diverse microbial communities, nitrogen fixers, phosphate solubilizers, potash mobilizers, and cellulolytic bacteria, work together to:
Break down accumulated chemical residues
Restore soil pH through organic acid production
Rebuild soil structure through bacterial exopolysaccharides
Restart nutrient cycling that has been dormant
Think of it as rebooting the soil’s operating system. You’re not just adding inputs, you’re restoring function.
The beauty of delivering these bioremediation agents through drip irrigation is precision. You can target specific problem areas. You can monitor recovery through root zone sampling. And because you’re delivering regularly with irrigation, you maintain consistent microbial populations rather than relying on a single broadcast application that degrades over time.
Why This Matters Now: The Economic and Ecological Imperative
Let’s return to Ramesh Patil, our sugarcane farmer. After learning about bio-fertigation, he made a simple calculation.
His annual chemical fertilizer bill through drip: ₹45,000 per acre. His yield: 85 tons per acre, declining. His soil: degraded, requiring increasing inputs each year.
He switched to an integrated approach, 60% of his previous chemical fertilizers plus regular bio-fertilizer applications. First season cost: ₹38,000 per acre. Yield: 87 tons. Soil organic carbon: increased from 0.42% to 0.51% (measured via Soil Health Card).
Second season: ₹35,000 per acre. Yield: 92 tons. Water requirement: reduced by 12% due to improved soil moisture retention.
Third season: ₹32,000 per acre. Yield: 95 tons. Disease pressure: noticeably reduced.
The economics work because biology compounds. Chemical inputs deplete and require more. Biological inputs build and require less.
Moving Forward: Your Soil’s Future Starts Today
The transition to bio-fertigation isn’t about abandoning modern agriculture, it’s about upgrading it. Your drip system isn’t the problem; it’s the solution delivery mechanism. The question is: what are you delivering?
Indian farming stands at an inflection point. We can continue down the path of increasing chemical dependence, declining soil health, and marginal economics. Or we can recognize that the most sophisticated agricultural technology isn’t in a factory, it’s in the soil, waiting to be awakened.
Bio-fertilizers through drip irrigation represent the convergence of precision agriculture and biological intelligence. They’re not a return to the past, but a step into a more sophisticated future where we work with nature’s systems rather than against them.
Your soil is not dead. It’s dormant. And every time you run that drip line, you have a choice: suppress or support, deplete or restore, extract or regenerate.
Ready to transform your soil from hard earth to living ecosystem? Team One Biotech specializes in bioremediation and soil health solutions designed specifically for Indian farming conditions. Our liquid bio-fertilizer range is engineered for drip irrigation systems, combining nitrogen fixers, phosphate solubilizers, and potassium mobilizers in formulations that won’t clog your emitters or compromise your investment. Visit our website or contact our agronomy team for a customized soil restoration plan. Because healthy soil isn’t just about this season’s yield, it’s about the next generation’s inheritance.
Looking to improve your ETP/STP efficiency with the right bioculture? Talk to our experts at Team One Biotech for customised microbial solutions.
There is a conversation happening in farmhouses across Punjab, Haryana, and the Deccan plateau that rarely reaches urban India. It is not about market prices or monsoon delays. It is about exhaustion, the exhaustion of soil that has been asked to produce without pause for over five decades.
An elderly farmer in Bathinda told me last monsoon season that his grandfather’s fields once required only farmyard manure and the wisdom of crop rotation. Today, even with three bags of DAP per acre, his wheat yield plateaus at 45 quintals, the same output his father achieved in 1995 with half the chemical inputs. The land, he said, has become “addicted but never satisfied.”
This is not poetic exaggeration. This is the documented reality of Indian soil health in 2026. The Green Revolution, which saved millions from hunger, came with a hidden invoice. Continuous cropping of rice-wheat systems, reliance on high-analysis NPK fertilizers, and the abandonment of organic amendments have created what soil scientists call “biological desertification.” Soil Organic Carbon levels in the Indo-Gangetic plains have crashed from approximately 1% in the 1960s to a dangerously low 0.3% in many intensive cropping zones. The microbiome, the invisible workforce of billions of bacteria, fungi, and actinomycetes, has been decimated.
The NPK ratio tells the story in numbers. The ideal fertilizer application ratio is 4:2:1 (Nitrogen:Phosphorus:Potassium). In 2026, India’s average application ratio has distorted to 7.7:3.1:1. We are force-feeding nitrogen while creating phosphorus and potassium imbalances. Worse, over 60% of applied phosphorus becomes “locked” in soil through chemical fixation, unavailable to plants despite its presence.
This is where Plant Growth Promoting Rhizobacteria emerges not as a trendy agricultural fad, but as a biological correction to a systemic crisis.
For the Time-Pressed Farmer:
PGPR biofertilizers India are beneficial bacteria that colonize plant roots, fixing nitrogen and solubilizing phosphates naturally
Indian soils have degraded from 1% to 0.3% Soil Organic Carbon in major grain belts, creating a biological crisis
PGPR microbial consortiums offer nitrogen fixation, phosphate solubilization, heavy metal detoxification, and stress resistance
Traditional chemical NPK ratios have shifted from the ideal 4:2:1 to an alarming 7.7:3.1:1, causing nutrient imbalances
Bioremediation in agriculture using PGPR can restore soil health while reducing input costs by 30-40% over three seasons
Team One Biotech solutions combine decades of bioremediation expertise with India-specific microbial formulations
Defining the Hero: What Exactly is PGPR?
Plant Growth Promoting Rhizobacteria are naturally occurring soil bacteria that establish symbiotic or associative relationships with plant roots. They colonize the rhizosphere, the narrow zone of soil directly influenced by root secretions and associated soil microorganisms. Think of the rhizosphere as the plant’s gut. Just as your digestive system relies on beneficial bacteria to break down food and synthesize vitamins, plants depend on rhizosphere microbes to mobilize nutrients, defend against pathogens, and regulate stress responses.
PGPR species include genera such as Azotobacter, Azospirillum, Bacillus, Pseudomonas, Rhizobium, and Paenibacillus. These are not genetically modified organisms. They are indigenous soil inhabitants that modern agriculture has inadvertently suppressed through chemical intensity. Sustainable farming solutions now focus on reintroducing these microbial allies through carefully formulated bio-fertilizers.
The difference between chemical fertilizers and PGPR biofertilizers is fundamental. Chemical fertilizers supply nutrients directly, often in excess, creating dependency and environmental runoff. PGPR biofertilizers restore the soil’s biological capacity to mobilize, cycle, and protect nutrients. They teach the soil to feed itself again.
The 4 Pillars of PGPR Power
1. Nitrogen Fixation: The Atmospheric Harvest
Certain PGPR strains possess the enzymatic machinery to convert atmospheric nitrogen into ammonia through biological nitrogen fixation. Bacteria like Azotobacter and Azospirillum can provide 20-40 kg of nitrogen per hectare per season. For leguminous crops, Rhizobium species form root nodules, fixing up to 100-200 kg N per hectare.
This is nitrogen that costs nothing, produces no greenhouse gases, and requires no fossil fuel synthesis. In a country where urea subsidies strain government budgets and farmer purchasing power alike, biological nitrogen fixation represents economic and ecological liberation.
2. Phosphate Solubilization: Unlocking the Frozen Bank
Indian soils contain vast reserves of phosphorus, but 95% of it is locked in insoluble mineral forms that plant roots cannot access. PGPR species like Bacillus megaterium and Pseudomonas fluorescens secrete organic acids (gluconic acid, citric acid) and phosphatase enzymes that dissolve these mineral phosphates, converting them into plant-available forms.
This is not hypothetical. Field trials across Maharashtra and Andhra Pradesh have demonstrated that phosphate-solubilizing bacteria can reduce the need for DAP by 25-30% while maintaining or improving yields. The phosphorus was always there. It simply needed the right biological mediator.
3. Siderophore Production: The Iron Cavalry
Iron is the fourth most abundant element in soil, yet plants frequently suffer iron deficiency because available iron oxidizes into insoluble ferric forms. PGPR produce siderophores, organic compounds that chelate (grab) iron and transport it to plant roots. This mechanism also competitively starves pathogenic fungi and bacteria of iron, acting as a biological defense system.
4. Phytohormone Regulation: The Stress Resistance Shield
PGPR synthesize plant hormones including indole-3-acetic acid (IAA), cytokinins, and gibberellins. These hormones enhance root architecture, improve water uptake efficiency, and activate stress tolerance pathways. During drought, salinity, or temperature stress, conditions increasingly common in India’s changing climate, PGPR-inoculated crops show measurably higher resilience.
Research from Tamil Nadu Agricultural University documented that cotton plants treated with PGPR microbial consortiums maintained 22% higher relative water content during drought stress compared to untreated controls.
Why Chemical-Only Farming is Failing: The Nutrient Lock-In Trap
The paradox of modern Indian agriculture is this: we apply more fertilizer than ever, yet nutrient use efficiency declines yearly. The average nitrogen use efficiency in Indian agriculture is barely 30-35%. That means for every 100 kg of urea applied, the crop utilizes only 30-35 kg. The remainder volatilizes into the atmosphere, leaches into groundwater, or remains locked in soil complexes.
Continuous chemical application also disrupts soil pH. Overuse of urea acidifies soil, while excess DAP increases soil alkalinity in certain conditions. Both extremes reduce microbial activity and nutrient availability. Soil salinity, already affecting 6.73 million hectares of Indian land, worsens under high-intensity chemical regimes, particularly in canal-irrigated regions.
Chemical fertilizers deliver nutrients but destroy the biological infrastructure needed to cycle them. PGPR biofertilizers rebuild that infrastructure. They are not a replacement for all chemical inputs immediately, but they are the bridge back to biological competence.
Bioremediation: PGPR as Soil Detoxification Agents
One of the least discussed yet most critical functions of PGPR is bioremediation in agriculture. Decades of pesticide application, industrial pollution, and irrigation with contaminated water have left many Indian soils laden with heavy metals (lead, cadmium, chromium) and persistent organic pollutants.
Specific PGPR strains possess remarkable bioremediation capabilities. They can:
Immobilize heavy metals: Bacteria secrete exopolysaccharides that bind heavy metals, preventing plant uptake and groundwater contamination
Degrade pesticide residues: Strains of Pseudomonas and Bacillus enzymatically break down organophosphates and chlorinated pesticides
Reduce soil toxicity: By restoring microbial diversity, PGPR create competitive environments that suppress toxin-producing organisms
Team One Biotech’s expertise in bioremediation positions us uniquely in this space. We do not simply sell bio-fertilizers. We engineer microbial consortiums tested for efficacy in contaminated soils, validated through third-party field trials across diverse Indian agro-climatic zones.
Application Guide: Practical Deployment for Indian Farmers
Seed Treatment Method
For crops like wheat, rice, pulses, and millets:
Mix 10 ml of liquid PGPR formulation per kg of seed
Add a sticking agent (jaggery solution or gum arabica)
Dry seeds in shade for 30 minutes
Sow within 24 hours for maximum bacterial viability
Soil Drenching Method
For transplanted crops (tomato, chili, brinjal, paddy):
Dilute 2-3 liters of PGPR liquid formulation in 200 liters of water
Drench soil near root zone immediately after transplanting
Repeat application at 30-day intervals during vegetative growth
Application Timing
Apply during cooler parts of the day (early morning or late evening)
Ensure adequate soil moisture for bacterial establishment
Avoid application immediately after chemical pesticide use (wait 7-10 days)
Storage Protocols
PGPR formulations are living products. Store in cool, shaded conditions. Do not expose to direct sunlight or temperatures above 35°C. Check expiry dates and viable bacterial counts before purchase.
Traditional Chemical Fertilizers vs. PGPR-Enhanced Bio-fertilizers
Parameter
Traditional Chemical Fertilizers
PGPR-Enhanced Bio-fertilizers
Yield Stability
High initial yield spike followed by plateau or decline over 3-5 years
Gradual yield improvement with sustained stability over long term
Enhanced drought, salinity, and temperature stress tolerance through phytohormone regulation
The Team One Biotech Edge: Scaling Soil Health Restoration for the Modern Indian Farm
Team One Biotech does not approach bioremediation and bio-fertilizer development as a laboratory curiosity. We bring decades of environmental remediation experience, from treating industrial effluents to restoring mining-affected lands, into agricultural applications.
Our PGPR formulations are:
Region-specific: Isolated from Indian soils, adapted to Indian climatic stresses
Multi-strain consortiums: Not single-strain products, but synergistic combinations that address nitrogen fixation, phosphate solubilization, and stress resistance simultaneously
Quality-assured: Minimum viable bacterial counts of 10^8 CFU/ml, validated shelf life, contamination-free production
Field-tested: Demonstrated efficacy across rice, wheat, cotton, pulses, and horticultural crops in over 15 states
We understand that Indian farmers need solutions that work within their economic realities and cropping calendars. Our technical support extends beyond product sales to soil testing, application training, and season-long agronomic guidance.
Restoration, Not Just Production
The future of Indian farming will not be written by those who extract maximum yield from minimum biology. It will be authored by farmers who understand that soil is not a substrate, but a living system. PGPR biofertilizers India represent more than a product category. They are a recognition that the biology we removed in the pursuit of yield must be consciously restored if agriculture is to remain viable.
The transition to sustainable farming solutions is not romantic idealism. It is survival economics. As input costs rise, groundwater depletes, and climate volatility intensifies, the farms that endure will be those that rebuild biological resilience.
Your soil is not dead. It is waiting to be reawakened.
Is your soil ready for the future?
Contact Team One Biotech for a comprehensive soil health assessment and customized PGPR application plan tailored to your crops, region, and soil conditions.
Let us partner in restoring not just your yields, but the biological legacy of your land. The soil remembers. It is time we helped it heal.
Looking to improve your ETP/STP efficiency with the right bioculture? Talk to our experts at Team One Biotech for customised microbial solutions.
Amit Kumar stood at the edge of his fifteen-acre wheat field in Bathinda, Punjab, watching the morning sun illuminate what should have been a promising crop. His grandfather had worked this same land, pulling abundant harvests from soil so rich it crumbled like dark chocolate between your fingers. Now, despite applying more urea, more pesticides, and more money than ever before, Amit’s yields had dropped thirty percent in just five years. The earth beneath his feet had become compacted, lifeless, a pale shadow of what it once was.
This isn’t just Amit’s story. Across India, from the waterlogged fields of the Indo-Gangetic plains to the red laterite soils of Karnataka, commercial farmers are confronting an uncomfortable truth: decades of chemical-intensive agriculture have fundamentally altered the biological foundation of their land. The Green Revolution, which saved millions from hunger and transformed India into a food-surplus nation, came with a hidden cost that’s now coming due.
The question isn’t whether soil degradation is happening, it’s whether we can reverse it before it’s too late.
The Damage: What Pesticides Actually Do to Soil
Before we can restore soil fertility, we need to understand precisely what’s been lost. Chemical pesticides don’t simply kill target pests and disappear. They fundamentally disrupt the underground ecosystem that makes agriculture possible.
The Soil Microbiome Collapse
Healthy soil contains approximately one billion bacteria in a single teaspoon, more living organisms than there are people on Earth. This microscopic world includes nitrogen-fixing bacteria, mycorrhizal fungi that extend root systems by hundreds of meters, and decomposers that convert organic matter into plant-available nutrients. Chemical pesticides, particularly organophosphates and synthetic pyrethroids, don’t discriminate between harmful pests and beneficial soil organisms.
Research from the Indian Agricultural Research Institute demonstrates that continuous pesticide application over fifteen years can reduce bacterial diversity by up to seventy-five percent. When these microbes disappear, so does the soil’s ability to cycle nutrients, retain water, and maintain structure.
The Indian Reality: Region-Specific Degradation
Punjab and Haryana: The Salinity Trap
The intensive wheat-rice rotation system in northwestern India, combined with heavy pesticide use, has created a perfect storm. Excessive irrigation coupled with chemical residues has pushed soil pH levels above 8.5 in many districts. Sodium accumulation creates a cement-like hardpan that prevents root penetration and water infiltration. Farmers apply more water to compensate, which worsens the salinity, a vicious cycle that’s rendering thousands of hectares unproductive.
Deccan Plateau: The Organic Carbon Crisis
Maharashtra, Telangana, and Karnataka face a different challenge. The black cotton soils that once held two to three percent organic carbon now register below 0.5 percent in intensively farmed areas. Without organic matter, these soils lose their water-holding capacity, critical in rain-fed agriculture. Pesticide residues have eliminated the earthworm populations that once turned this organic matter into humus.
Indo-Gangetic Plains: Chemical Accumulation
The alluvial soils of Uttar Pradesh and Bihar show alarming levels of persistent organic pollutants. Studies reveal that DDT metabolites, despite being banned for decades, still contaminate agricultural land. Newer pesticides like neonicotinoids accumulate in soil aggregates, remaining bioactive for years and continuing to suppress beneficial microbial populations long after application.
The Science of Bioremediation: Nature’s Reset Button
Bioremediation represents our most powerful tool for reversing pesticide-induced soil degradation. Rather than adding more chemicals to solve problems created by chemicals, bioremediation harnesses living organisms to detoxify soil and restore biological function.
How Bioremediation Works
Certain bacteria and fungi possess enzymatic pathways capable of breaking down pesticide molecules into harmless compounds. Pseudomonas species can metabolise organophosphates. Bacillus strains degrade carbamate pesticides. These microorganisms literally consume toxic residues as food, converting them into carbon dioxide, water, and mineral salts.
The process operates on three levels:
Degradation: Microbes break down pesticide molecules through enzymatic action, transforming complex synthetic compounds into simpler, non-toxic substances.
Immobilization: Certain organisms bind pesticide residues, preventing them from entering groundwater or being taken up by crops, effectively quarantining the contamination.
Transformation: Beneficial microbes convert toxic metabolites into nutrients that plants can use, turning a liability into an asset.
The Bio-Fertilizer Advantage
Modern bio-fertilizers do more than replace chemical fertilizers, they actively remediate damaged soil whilst providing nutrition. Products containing consortiums of nitrogen-fixers, phosphate solubilizers, and potassium-mobilizing bacteria serve multiple functions simultaneously.
When applied to chemically exhausted soil, these microbial inoculants:
Re-establish beneficial bacterial populations that synthesise plant growth hormones
Produce organic acids that chelate nutrients, making them available to roots
Create soil aggregates that improve water retention and aeration
Accelerate the decomposition of pesticide residues through co-metabolism
The Restoration Roadmap: From Chemical Dependency to Soil Health
Transitioning from chemical-intensive to biologically-based agriculture isn’t an overnight switch. It requires a strategic, phased approach that acknowledges both the biological realities of soil recovery and the economic pressures farmers face.
Phase One: Assessment and Stabilization (Months 1-3)
Soil Health Testing
Begin with comprehensive analysis beyond standard NPK values. Test for organic carbon content, microbial biomass, enzyme activity, and pesticide residue levels. Several government soil testing laboratories now offer biological assay services. Understanding your baseline determines which interventions will prove most effective.
Chemical Input Reduction
Implement integrated pest management protocols that reduce, but don’t immediately eliminate, chemical pesticides. This gradual reduction prevents yield crashes whilst allowing microbial populations to begin recovering. Replace broad-spectrum pesticides with targeted biopesticides derived from Bacillus thuringiensis, neem extracts, or Trichoderma fungi.
Organic Matter Addition
Apply composted farm yard manure or vermicompost at five tonnes per hectare. This provides food for recovering microbial populations and introduces beneficial organisms. Green manuring with Sesbania or Crotalaria species adds both biomass and nitrogen whilst their deep roots break up compacted layers.
Phase Two: Active Bioremediation (Months 4-12)
Microbial Inoculation
Apply consortium-based bio-fertilizers that combine multiple functional groups. Team One Biotech’s formulations, for instance, integrate nitrogen fixers, phosphate solubilizers, and pesticide-degrading strains specifically isolated from Indian soils. Application rates typically range from five to ten kilograms per hectare, mixed with organic carriers.
Crop Selection for Recovery
Plant species that support bioremediation. Legumes like pigeon pea or chickpea host nitrogen-fixing rhizobia whilst their root exudates stimulate beneficial microbes. Brassica species actively absorb certain pesticide residues through their roots. Rotation patterns should break pest cycles naturally, reducing the need for chemical intervention.
Biological Augmentation
Introduce earthworms, nature’s soil engineers. A population of two hundred earthworms per square meter can process tons of organic matter annually, creating water-stable aggregates and distributing microbes throughout the soil profile. In trials across Maharashtra, earthworm-amended fields showed forty percent faster recovery of biological activity.
Phase Three: Biological Maintenance (Year Two Onwards)
Sustained Microbial Support
Continue annual applications of bio-fertilizers, though amounts may decrease as soil populations establish. Monitor microbial activity through simple field tests, healthy soil should smell earthy, form aggregates when moistened, and show visible earthworm activity.
Minimal Chemical Intervention
Reserve synthetic pesticides only for severe outbreaks, using bio-pesticides as first-line defence. This maintains the microbial communities you’ve worked to rebuild. Research from Tamil Nadu Agricultural University shows that once soil biological activity reaches seventy percent of pre-degradation levels, pest pressure naturally decreases due to enhanced plant vigour and predator populations.
Continuous Organic Inputs
Treat organic matter addition as non-negotiable. Whether through compost, crop residues, or cover crops, maintaining organic carbon above 1.5 percent ensures sustained microbial activity. This also improves water use efficiency, critical as climate variability increases.
Measuring Success: What Recovery Looks Like
Soil restoration isn’t abstract. Within eighteen months of implementing bioremediation protocols, farmers typically observe:
Improved soil structure, reduced compaction and better water infiltration
Return of earthworm and beneficial insect populations
Reduced irrigation requirements by fifteen to twenty-five percent
Stabilized, then increasing, crop yields despite reduced chemical inputs
Lower input costs as biological processes replace purchased chemicals
Laboratory analysis should show rising microbial biomass carbon, increased enzyme activities (particularly dehydrogenase and phosphatase), and declining pesticide residue levels.
The Economic Reality: Investing in Long-Term Productivity
Transitioning to bioremediation-based agriculture requires upfront investment. Bio-fertilizers, organic amendments, and technical guidance cost money. However, the economics shift dramatically when viewed over three to five years rather than a single season.
A comparative study from Andhra Pradesh tracked fifty farmers transitioning from conventional to biological farming. Initial costs increased by twelve percent in year one. By year three, input costs had dropped twenty-eight percent below conventional levels whilst yields matched or exceeded previous production. Crucially, soil organic carbon had increased from 0.42 percent to 0.91 percent, a transformation that continues delivering returns for decades.
The calculation changes further when considering environmental costs. Pesticide runoff contaminates water sources that entire communities depend upon. Soil degradation reduces land values and limits options for future generations. Biological restoration addresses these hidden expenses that never appear in traditional farm accounting.
Beyond Individual Farms: The Collective Approach
Soil health operates at landscape scales. When your neighbour’s field serves as a reservoir for pests and chemical runoff, individual efforts face limitations. Progressive farming clusters in Karnataka and Punjab are adopting community-level bioremediation programmes, creating buffer zones of biological agriculture that benefit entire watersheds.
Government schemes like Paramparagat Krishi Vikas Yojana provide financial support for groups of farmers transitioning together. This collective approach reduces risk, shares knowledge, and creates economies of scale for purchasing bio-inputs.
Taking the First Step: Your Soil’s Second Chance
The exhausted soil beneath Amit Kumar’s feet, and perhaps beneath yours, isn’t permanently damaged. The microbiome that once made agriculture possible remains dormant, waiting for conditions that allow its return. Chemical pesticides created the problem, but biological solutions offer the remedy.
Restoration requires patience, knowledge, and commitment. It demands we think beyond the next harvest to consider the land we’ll leave our children. The science is proven. The products exist. The question is whether we’ll act before degradation becomes irreversible.
Your soil spent decades getting into this condition. Giving it two years to recover isn’t asking too much, it’s investing in the next century of productivity.
Restore Your Soil, Reclaim Your Future
Team One Biotech offers scientifically-formulated bioremediation solutions specifically designed for Indian soil conditions. Our consortium-based bio-fertilizers combine pesticide-degrading bacteria with nitrogen-fixers and phosphate solubilizers, addressing multiple restoration needs simultaneously.
Contact our agricultural specialists today for a customized soil restoration plan. We provide comprehensive soil testing, transition protocols, and ongoing technical support to ensure your bioremediation programme succeeds.
Don’t let another season pass watching your yields decline. The recovery starts now, with proven biological science and partners who understand Indian agriculture.
Looking to improve your ETP/STP efficiency with the right bioculture? Talk to our experts at Team One Biotech for customised microbial solutions.