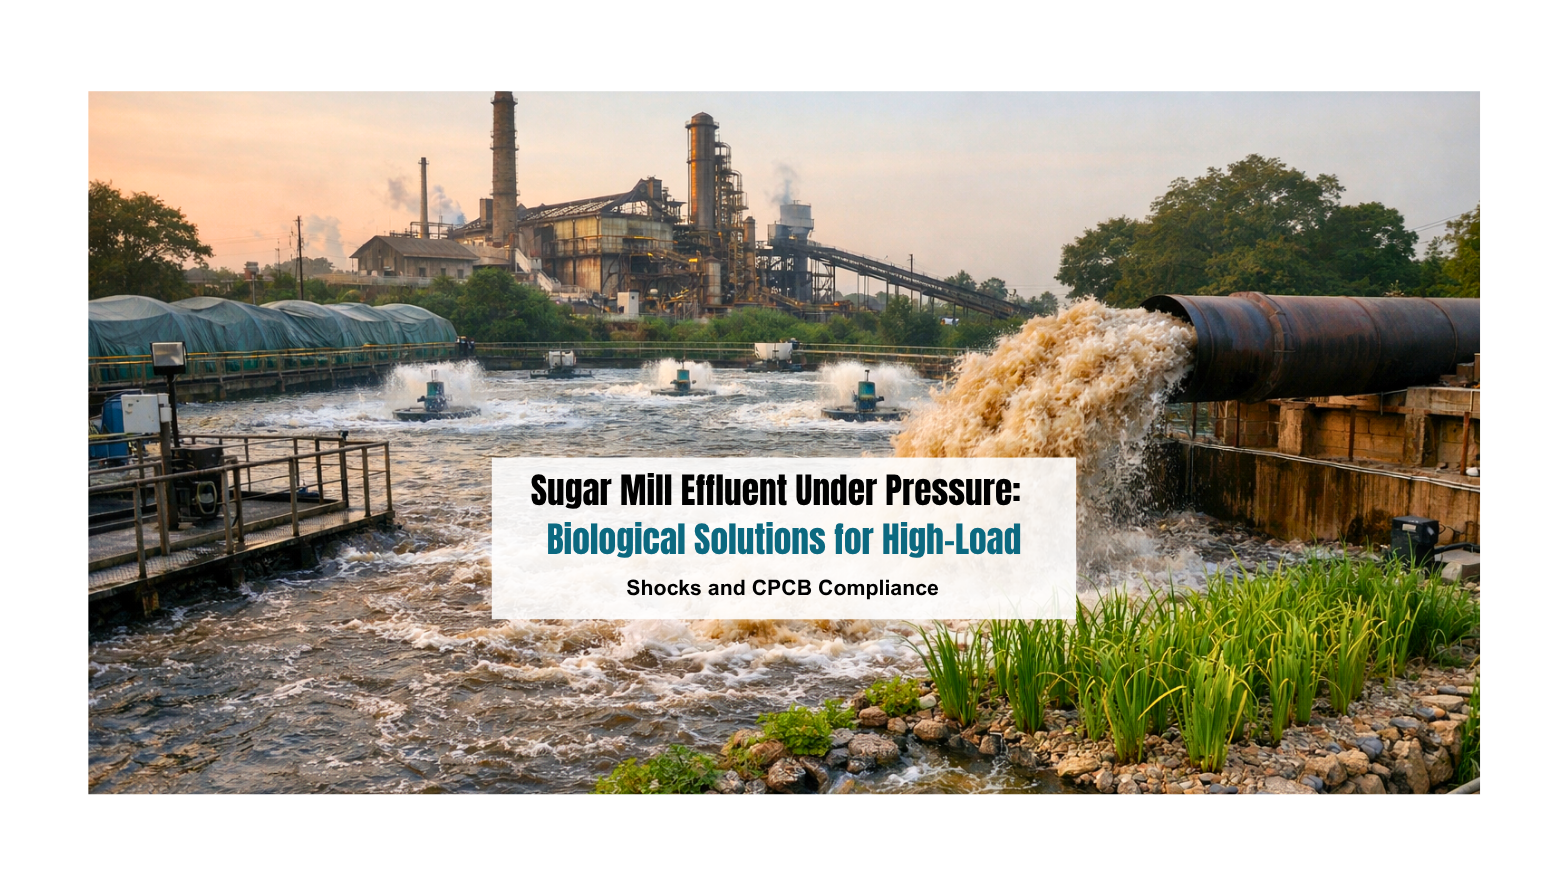
Sugar Mill Effluent Under Pressure: Biological Solutions for High-Load Shocks and CPCB Compliance

Every October, the same alarm starts ringing across sugar belt states,  Uttar Pradesh, Maharashtra, Karnataka, Tamil Nadu. The cane arrives faster than any ETP was designed to absorb. Clarifier overflow. Sludge turning grey. COD spiking to levels that would make an inspector reach for his clipboard before he even finishes his chai.

For an EHS manager standing between a 24-hour production cycle and an SPCB show-cause notice, this is not a theoretical problem. This is a recurring operational crisis,  one that can trigger NGT fines, plant shutdowns, and reputational damage that lingers long after the season ends.

The hidden cost of non-compliance is rarely just the penalty. It is the productivity loss during corrective shutdowns, the cost of emergency chemical dosing, the overtime hours troubleshooting a biological system that was never built for the load it is receiving. And increasingly, with CPCB tightening effluent discharge standards under the Environment Protection Act and NGT maintaining active oversight on Red Category industries, the margin for error has narrowed to almost nothing.

Biological treatment for sugar mills done right is not a backup plan. It is the foundation of a compliant, resilient sugar mill operation.

What Makes Sugar Mill Effluent a Biological Treatment Challenge
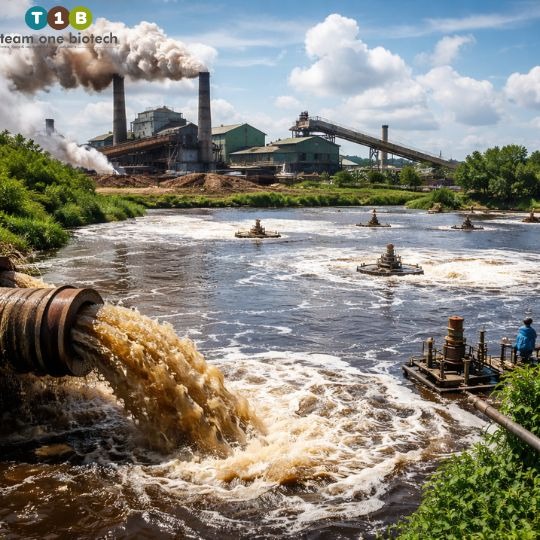
Sugar mill effluent is not ordinary wastewater. It is a concentrated, chemically complex mix that includes washings from cane preparation, barometric condenser water, juice spillage, molasses residues, and floor washdowns from the boiling house. During peak crushing, this mix arrives in volumes and concentrations that fluctuate dramatically,  sometimes hour to hour.

The core parameters that drive treatment difficulty:

COD loads typically range from 2,000–15,000 mg/L depending on the unit operation and dilution, though values outside this range are documented during startup and peak throughput.

BOD values commonly fall in the 800–6,000 mg/L range in raw influent, with significant variation tied to molasses carryover and process leakages.

pH swings across 4.5–9.5 in untreated streams, driven by fermentation of residual sugars in collection channels and alkaline process water from sulphitation.

Suspended solids, including bagasse fines and soil from cane washing, regularly read between 500–3,000 mg/L in raw streams entering primary treatment.

Colour, primarily from melanoidins,  the compounds formed when amino acids react with reducing sugars under heat,  is one of the most persistent treatment challenges and a visible indicator of non-compliance even when COD numbers look acceptable.

All values expressed throughout this article represent general industry ranges. Actual figures vary significantly based on plant-specific machinery, cane variety, feedstock quality, process water management, and ETP/STP design configuration. Site-specific characterisation is essential before any treatment design decision.

The Science Behind Biological Degradation of Sugar Mill Wastewater
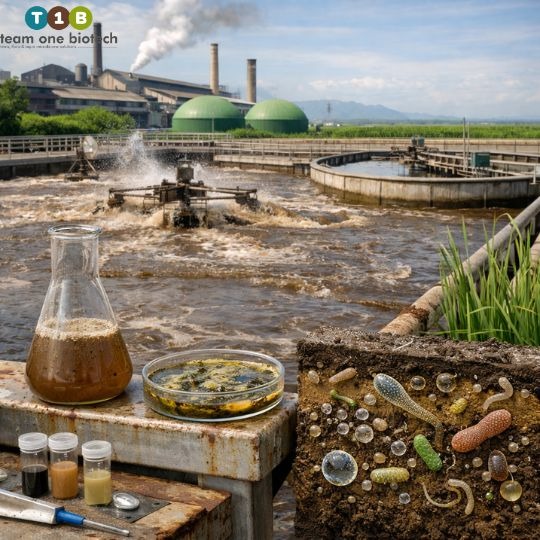
The Science Behind Biological Degradation of Sugar Mill Wastewater

Why Microbial Consortia Outperform Chemical Treatment Alone

Chemical treatment,  coagulation, flocculation, lime dosing,  addresses the physical load. It does not address the dissolved organic fraction that drives your COD reading and determines whether your discharge will pass consent conditions.

That work is done by microorganisms. Specifically, by diverse consortia of aerobic heterotrophs, facultative anaerobes, and specialised fermenters that collectively degrade the complex organic matrix of sugar mill effluent.

The primary substrates these organisms are breaking down include:

Sucrose, glucose, and fructose,  rapidly consumed fermentable sugars that provide a fast-acting BOD spike in the early stages of biological treatment.

Polysaccharides and starches,  from bagasse and cane pith, which require cellulolytic and amylolytic bacterial populations to hydrolyse before further degradation is possible.

Organic acids,  acetic, lactic, and butyric acids formed during fermentation of residual sugars in collection sumps and anaerobic pockets of the treatment system.

Melanoidins,  high-molecular-weight recalcitrant compounds requiring specialised peroxidase-producing fungi and bacteria, such as Phanerochaete-type organisms or ligninolytic populations, that many generic microbial seed cultures simply do not contain in sufficient density.

The Anaerobic-Aerobic Sequence: Getting the Biology Right

Well-designed biological treatment of sugar mill effluent typically follows a staged approach:

Anaerobic pretreatment,  UASB reactors or anaerobic lagoons reduce the gross organic load, converting 55–70% of incoming COD to biogas and reducing the aerobic stage loading. COD reduction across the anaerobic stage typically falls in the 50–65% range.

Aerobic biological treatment,  Extended aeration, activated sludge, or sequencing batch reactors (SBRs) handle the residual BOD and COD. Well-seeded and maintained aerobic systems achieve BOD reductions of 88–96% across the combined treatment train.

Tertiary polishing,  Filtration, constructed wetlands, or advanced oxidation handles colour and residual suspended solids before ZLD or discharge.

The biology only performs at this level when the microbial population is correctly seeded, adequately fed, and protected from shock events.

Where Operations Go Wrong, The Most Common ETP Failures in Sugar Mills
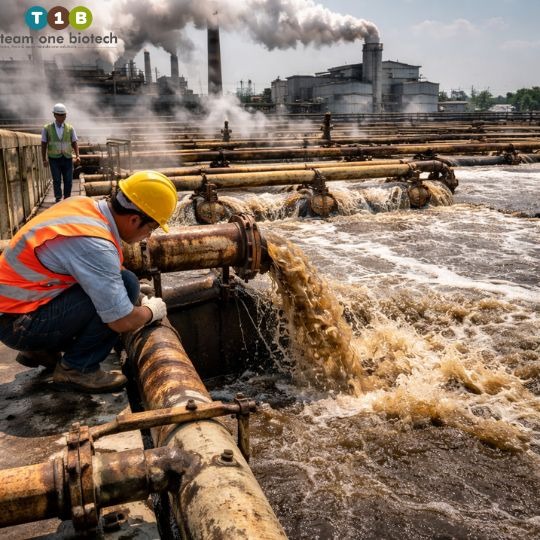
Sludge Bulking and Settleability Collapse

One of the most frequently reported operational failures in sugar mill ETPs is filamentous sludge bulking,  the proliferation of thread-like bacterial species that create a voluminous, poorly settling sludge blanket. This typically occurs when:

Carbon-to-nitrogen ratios are skewed by high sugar loads without proportional nitrogen supplementation. The ideal C:N:P ratio for aerobic biological treatment is approximately 100:5:1, but in sugar mill systems, this ratio can be thrown to 300:5:1 or worse during high-load periods.

Dissolved oxygen sags below 1.5–2.0 mg/L in aeration tanks during peak load, favouring filamentous organisms over floc-forming bacteria.

Hydraulic retention times are shortened during peak production to maintain inlet flow acceptance, starving the biological population of contact time.

The Failure of Generic Microbial Seeding

This is a pattern that repeats across sugar mills that are attempting biological recovery without specialist input. The plant inoculates with cow dung slurry or municipal sludge,  standard practice passed down through operating teams,  and then waits for the biomass to establish.

The problem is selection pressure. The microbial populations in generic seed material were never exposed to the specific substrates in sugar mill effluent,  melanoidins, complex polysaccharides, high-temperature process water. Establishment is slow, COD reduction remains in the 40–60% range instead of the 85–95% range a specialist consortium can achieve, and the plant operates in a perpetual state of marginal compliance.

Monsoon-Season Biomass Instability

Monsoon creates specific problems for sugar mill ETPs in India that are rarely addressed in treatment design documents but are felt acutely by every plant operator.

Temperature drops across aerobic tanks of 8–14°C relative to pre-monsoon conditions can reduce microbial metabolic rates by 30–50%, stretching biological treatment response times and elevating discharge COD.

Stormwater ingress dilutes mixed liquor suspended solids (MLSS),  the active biological mass,  from stable operating ranges of 2,500–4,000 mg/L down to values below 1,000 mg/L in poorly bunded facilities.

Additionally, the crushing season in northern states begins immediately post-monsoon, meaning biomass is already stressed before it faces the season’s peak organic shock.

Regulatory Pressure and ZLD,  What CPCB and NGT Are Actually Demanding
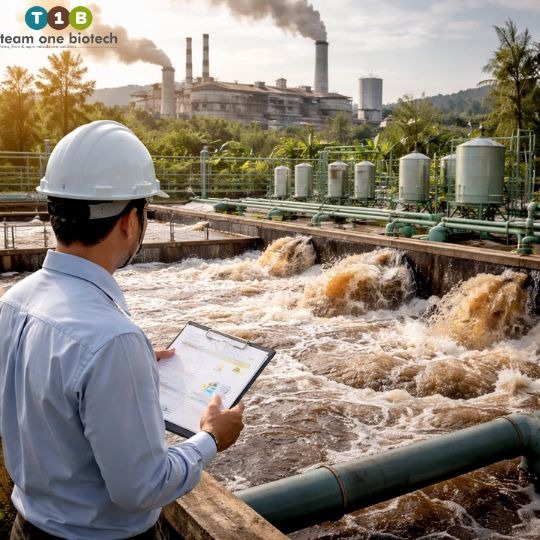
Regulatory Pressure and ZLD,  What CPCB and NGT Are Actually Demanding

Under CPCB’s effluent standards for sugar industries and the downstream pressure from NGT judgments on critically polluted areas, many large sugar mills are now operating under consent conditions that require discharge COD below 250 mg/L,  and in some states, below 150 mg/L,  into inland surface water bodies.

ZLD aspirations are growing. Several state pollution control boards have begun mandating ZLD compliance for sugar mills in water-stressed districts of Maharashtra, Rajasthan, and parts of Uttar Pradesh. ZLD shifts the entire treatment objective from effluent quality to volume reduction, a target that cannot be achieved without a stable, high-performing biological treatment stage at the base of the system.

For EHS managers preparing for SPCB renewals or NGT submissions, the biological treatment performance records , MLSS logs, SV30 data, effluent quality trends,  are no longer optional documentation. They are evidence.

Download Team One Biotech’s ETP Health Checklist for Sugar Mills,  a field-tested audit framework covering biological performance indicators, sludge management, and CPCB compliance documentation.

The Team One Biotech Approach,  Specialised Biology for Specialised Loads

Team One Biotech works with sugar mills not as a chemical supplier, but as a biological treatment partner. The difference is in the specificity of the microbial products and the depth of the technical support behind them.

The core of the approach involves:

Strain-selected microbial consortia formulated specifically for high-sucrose, melanoidin-heavy wastewater streams. These are not general-purpose cultures,  they carry cellulolytic, lipolytic, and ligninolytic populations capable of degrading the recalcitrant organic fraction that generic seed material misses.

Nutrient balancing protocols that accompany every dosing plan, addressing the N:P deficiencies that are almost universal in sugar mill treatment systems.

Biomass protection strategies ahead of the crushing season,  a pre-seeding programme that builds MLSS levels and microbial diversity before the high-load shock arrives, rather than attempting biological recovery in the middle of peak production.

Ongoing monitoring support across aerobic and anaerobic stages, with dosing adjustments tied to incoming load data rather than fixed schedules.

Team One Biotech’s product range spans industrial wastewater treatment, agricultural soil health, and aquaculture water quality,  a breadth of biological expertise that brings cross-sector learning into every site-specific solution.

Request a site audit from Team One Biotech’s technical team,  field diagnostics, effluent characterisation, and a biological treatment gap analysis built around your plant’s specific operational profile.

Moving From Firefighting to Forward Management

The sugar mill operations that achieve consistent CPCB compliance and are positioned for ZLD mandates are not necessarily those with the most capital-intensive infrastructure. They are the ones whose biological treatment is actively managed,  seeded correctly at the start of the crushing season, supported through monsoon transition, monitored through the season’s peak loads, and backed by a technical partner who understands the difference between sugar mill effluent and generic industrial wastewater.

The shift from reactive crisis management to proactive biological stability is not a technology upgrade. It is an operational philosophy, supported by the right microbial science.

Sugar mill effluent treatment has a biological solution. The season does not have to be a crisis every year.

Contact Team One Biotech today for a customised microbial dosage plan built around your mill’s effluent profile, crushing schedule, and compliance targets. Treatment that works with your biology, not against your operational calendar.

Looking to improve your ETP/STP efficiency with the right bioculture?
Talk to our experts at Team One Biotech for customised microbial solutions.

Contact: +91 8855050575

Email:  sales@teamonebiotech.com

Visit: www.teamonebiotech.com

Discover More on YouTube – Watch our latest insights & innovations!-

Connect with Us on LinkedIn – Stay updated with expert content & trends!
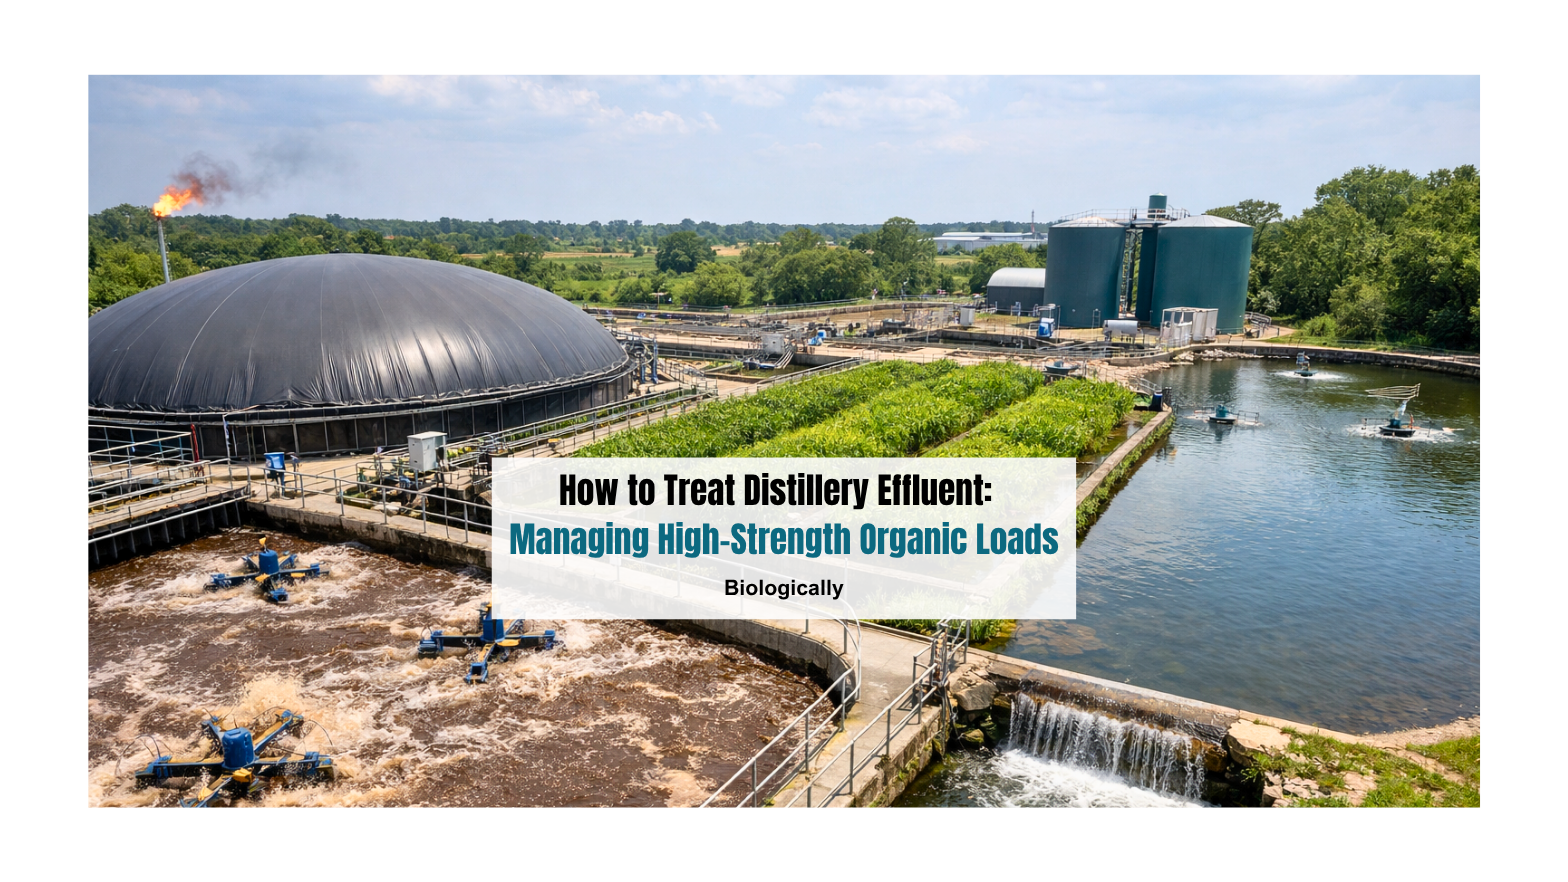
How to Treat Distillery Effluent: Managing High-Strength Organic Loads Biologically

The modern industrial landscape in India has reached a critical juncture. The dual pressures of economic expansion and environmental preservation are no longer negotiable; they are the two pillars upon which any successful enterprise must stand.

For the seasoned plant operator or the Environmental Health and Safety (EHS) manager, the transition from conventional treatment to the current era of Zero Liquid Discharge (ZLD) has been a profound paradigm shift. There is a specific, visceral kind of stress that only a professional in this field truly understands: standing on the catwalk of a treatment plant at two in the morning during a peak monsoon downpour, watching the foam rise in an aeration tank. In those moments, the weight of responsibility is heavy; a single non-compliant discharge could lead to a permanent closure notice from the National Green Tribunal (NGT) or the Central Pollution Control Board (CPCB).

The “hidden” cost of non-compliance is not merely the financial penalty, though those can reach into the crores, but the existential threat to the business itself. In today’s regulatory climate, authorities no longer just issue warnings; they revoke the Consent to Operate (CTO).

To thrive, the industry is moving away from a “hardware-centric” approach of simply building larger tanks. Instead, we are seeing a sophisticated, “biology-first” movement that prioritizes the optimization of microbial systems as the primary engine of detoxification. For the distillery sector, where organic loads are exponentially higher than municipal sewage, mastering this biological wastewater management is the only viable path forward.

The Anatomy of a High-Strength Challenge: Understanding Spent Wash

Distillery effluent, often called spent wash, stillage, or vinasse, is widely considered one of the most difficult industrial waste streams to treat globally. In India, where molasses is the primary feedstock for ethanol, the volumes are staggering. For every liter of alcohol produced, a typical distillery generates between 8.0 to 15.0 liters of spent wash.

The raw effluent is a dark brown, foul-smelling liquid that exits the process at high temperatures (up to 81°C) and with a highly acidic pH. Its organic strength is almost unparalleled. The Chemical Oxygen Demand (COD) and Biological Oxygen Demand (BOD) values are so high that direct discharge into a water body would result in the immediate and total depletion of dissolved oxygen, creating “dead zones” in our aquatic ecosystems.

Typical Characteristics of Raw Distillery Spent Wash

ParameterTypical Value Range (Raw)Units
pH3.8–4.5–
Temperature71.0–81.0°C
Chemical Oxygen Demand (COD)70,000–150,000mg/L
Biological Oxygen Demand (BOD)35,000–60,000mg/L
Total Dissolved Solids (TDS)58,000–76,000mg/L
Potassium (K_2O)5,000–15,475mg/L

The persistent brown color isn’t just an aesthetic problem. It is caused by melanoidins, complex polymers formed during fermentation. These compounds are remarkably resistant to standard treatment; they act as antioxidants that can actually be toxic to the very microorganisms meant to break them down. Furthermore, they block sunlight from entering rivers, halting photosynthesis and disrupting the entire food chain.

The Indian Regulatory Evolution: CPCB, NGT, and the ZLD Mandate

The regulatory landscape in India has evolved from simple “end-of-pipe” standards to a comprehensive, life-cycle approach. The mandate for Zero Liquid Discharge (ZLD) is now a baseline requirement for “Red Category” sectors like distilleries.

Under ZLD, no liquid waste is permitted to cross the plant boundary. Every drop must be treated, recovered, and recycled, leaving only dry solids for disposal. In states like Uttar Pradesh, the state pollution boards have been aggressive in enforcing these rules through Online Continuous Effluent Monitoring Systems (OCEMS).

Digital Surveillance and Continuous Compliance

With OCEMS, regulators have a 24/7 window into your plant’s performance. Parameters like pH, COD, and flow rate are transmitted directly to government servers. Deviations for even short durations can trigger automatic alerts and closure orders. This “digital surveillance” makes the role of specialized microbial cultures even more critical, as they provide the biological resilience needed to handle the “shock loads” that often lead to regulatory red flags.

The Science of Bioremediation: How Microbes Conquer Pollutants

At the heart of a successful distillery Effluent Treatment Plant (ETP) is a complex ecosystem. Bioremediation is the strategic use of microbes to transform toxic substances into harmless forms. This is typically divided into two crucial phases.

1. Anaerobic Digestion: The First Line of Defense

The heavy lifting begins in anaerobic reactors, such as the Upflow Anaerobic Sludge Blanket (UASB). Here, a consortium of bacteria breaks down 60% to 85% of the COD, producing valuable biogas as a byproduct.

However, this stage is a delicate balancing act. If the organic loading rate is increased too quickly, the system can “acidify.” This is where the production of volatile fatty acids outpaces their conversion to methane, leading to a total system crash.

2. Aerobic Polishing and the Challenge of Recalcitrance

The effluent exiting the anaerobic stage still carries a significant organic load and that signature dark color. This is where aerobic treatment, the Activated Sludge Process (ASP), takes over.

To break down the stubborn melanoidins, you need “specialist” microbes like Bacillus, Pseudomonas, and Nitrosomonas. These microbes act like mini-biochemical factories, producing extracellular enzymes that function like chemical scissors to snip apart complex polymers.

EnzymeMechanism of ActionImpact
LaccaseBreaks down aromatic ringsKey for decolourisation
Manganese PeroxidaseDegrades phenolsDeep COD reduction
Lignin PeroxidaseCleaves complex C-C bondsBreaks down recalcitrant matter

Operational Hurdles: The “Pain Points” of the ETP Operator

Operational Hurdles: The "Pain Points" of the ETP Operator

Maintaining a high-load ETP is a constant battle against biological instability. Operators often face three recurring nightmares:

Sludge Bulking

This occurs when the microbial mass becomes less dense and refuses to settle. Often caused by an overgrowth of filamentous bacteria during low oxygen levels, it can lead to a total loss of biological capacity as the biomass washes out of the system.

The Nutrient Imbalance

Microbes need a balanced diet. While distillery effluent is rich in nitrogen, it is often deficient in phosphorus. Without the right BOD:N:P ratio (generally 100:5:1), the microbes produce a “slimy” coating that makes the sludge notoriously difficult to manage.

The Monsoon Shock

In India, the monsoon is the ultimate test. Heavy rains can dilute effluent or cause rainwater ingress that exceeds the plant’s capacity. Power fluctuations during storms can also disrupt aeration, quickly turning a healthy aerobic tank into a foul-smelling swamp.

The Team One Biotech Advantage: Engineering Nature’s Solutions

Team One Biotech was founded on a simple principle: the world’s most significant pollution problems can be solved by its smallest inhabitants, microbes. Founded by Tejas Gathani, a veteran with nearly three decades of hands-on experience, the company addresses the “software” gap in wastewater treatment.

While many companies focus on selling heavy machinery, Team One Biotech positions itself as a strategic partner. They optimize existing infrastructure by enhancing the microbial engine that performs the actual detoxification.

Case Study: A Turnaround in Performance

A distillery struggling with high COD and unstable biomass implemented a targeted bioaugmentation program using the T1B Aerobio consortia. The results were transformative:

  • COD Reduction: Effluent COD fell to a stable range of 650–870 ppm (an 80–89% improvement).
  • Capacity Restoration: The plant returned to its full design capacity of 1,500 KLD from a restricted 500 KLD.
  • Energy Savings: Improved oxygen transfer efficiency led to significantly lower power consumption for aeration.

Beyond Wastewater: A Holistic Ecosystem

The expertise of Team One Biotech extends across the entire environmental spectrum:

  • Agriculture: Products like T1B Soil Biome enhance soil productivity and reduce the need for chemical fertilizers.
  • Aquaculture: Probiotic solutions improve water quality and gut health for shrimp and fish farming without antibiotics.
  • Lake Restoration: Reviving polluted urban water bodies using nano-bubble technology and microbial consortia.
  • Commercial Cleaning: Nature-based enzyme cleaners that provide sanitation without a harsh chemical footprint.

Future-Proofing: The Path to Resource Recovery

As we move toward 2026, “success” is being redefined. The most advanced distilleries are no longer viewing effluent as waste, but as a source of revenue.

  • Bio-CNG: The high organic content of spent wash is ideal for methane production, which can meet up to 60% of a plant’s energy requirements.
  • Potash Recovery: Molasses-based wash is rich in potassium. The salts recovered during the ZLD process can be turned into potash-rich ash, a valuable fertilizer.
  • Water Circularity: By optimizing biological treatment, distilleries can achieve water recovery rates of up to 98%, providing a stable water supply even in water-stressed regions.

A Vision for Sustainable Growth

The era of “dilution as the solution to pollution” is over. For the modern distillery, survival depends on a deep commitment to environmental stewardship. The regulatory pressure from the NGT and CPCB is not a hurdle to be jumped, but a permanent feature of the landscape.

Achieving excellence requires a shift in mindset. A treatment plant is not just a collection of steel and concrete; it is a living, breathing biological entity. By prioritizing the health of your microbial population and leveraging advanced bioaugmentation, you can transform your ETP from a source of stress into a cornerstone of operational stability.

The future of the Indian distillery sector is green, and it is powered by the intersection of science and nature. By embracing these biological solutions, we can ensure long-term viability, providing economic value to the nation and a cleaner environment for generations to come.

Move from compliance stress to process stability. Partner with Team One Biotech for your next biological audit.

Looking to improve your ETP/STP efficiency with the right bioculture?
Talk to our experts at Team One Biotech for customised microbial solutions.

Contact: +91 8855050575

Email:  sales@teamonebiotech.com

Visit: www.teamonebiotech.com

Discover More on YouTube – Watch our latest insights & innovations!-

Connect with Us on LinkedIn – Stay updated with expert content & trends!
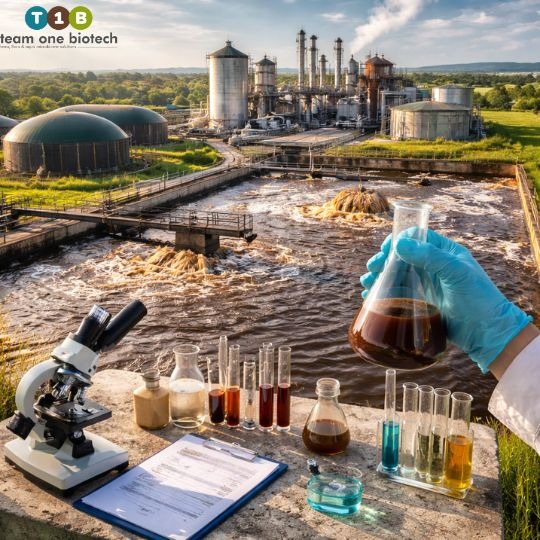
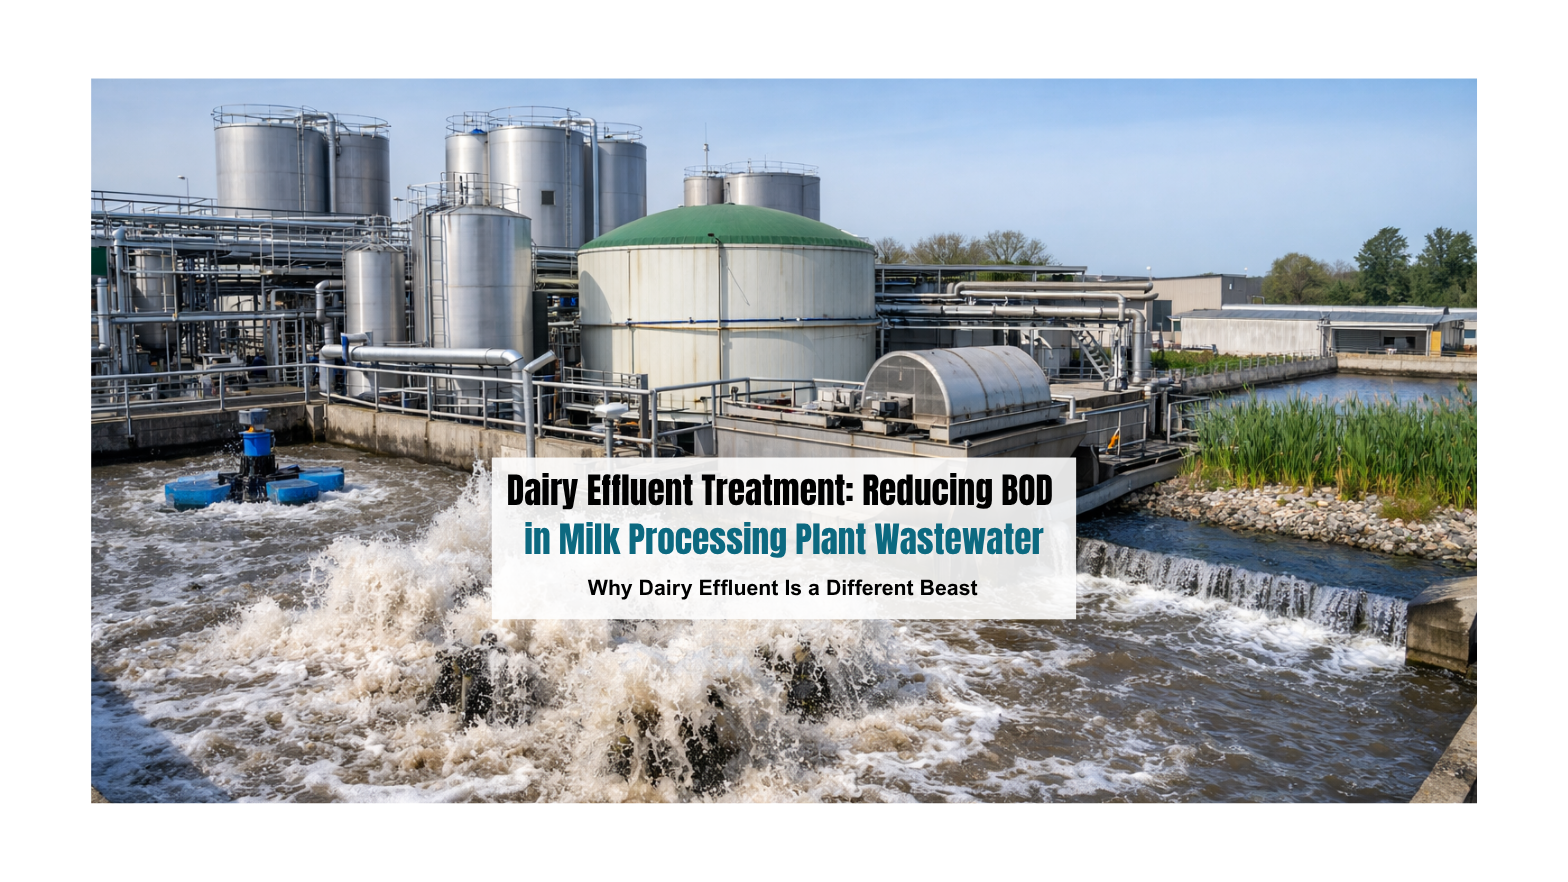
Dairy Effluent Treatment: Reducing BOD in Milk Processing Plant Wastewater

You know the feeling. A notice from the Pollution Control Board lands on your desk, and suddenly your entire week pivots. The ETP that has been “managing” your dairy plant’s effluent is now under a microscope, and the BOD levels in your discharge report are not going to make the conversation easy.

For dairy plant managers across India, this is not a hypothetical. It is Tuesday morning.

The Indian dairy industry is among the country’s most economically vital sectors, processing millions of litres of milk daily across states like Punjab, Rajasthan, Uttar Pradesh, and Maharashtra. But behind every chilled packet and processed dairy product is a wastewater story that does not get told enough. Milk processing generates some of the most organically loaded effluent in the food industry, high in BOD, COD, fats, oils, and suspended solids. Left inadequately treated, it does not just attract regulatory action. It ferments. It smells. It kills aquatic life in nearby water bodies and quietly poisons the groundwater your neighbouring community depends on.

This piece is for the EHS manager who is tired of patching a broken system with chemicals and hoping the next inspection goes smoothly. There is a better way, and it starts with understanding what you are actually dealing with.

Why Dairy Effluent Is a Different Beast

Why Dairy Effluent Is a Different Beast

Most industrial wastewater is complicated. Dairy wastewater is complicated and stubborn.

When your plant cleans processing equipment, rinses pasteurisation lines, flushes out cheese vats, or disposes of off-spec batches, what goes down the drain is a concentrated cocktail of organic matter. Milk proteins, lactose, casein, butter fat, cleaning chemical residues, and in some cases animal waste from nearby collection points, all of it lands in your ETP. BOD levels in untreated dairy effluent routinely range across a broad spectrum, from a few hundred to several thousand mg/L depending on the product mix and plant hygiene practices. COD follows a similar trajectory, often running two to three times the BOD value.

This is what makes dairy effluent treatment technically demanding:

  • FOG (Fats, Oils, and Grease): These float to the surface, coat pipes, clog biological treatment media, and create a suffocating layer over aeration basins that kills the microbial activity you need.
  • High Nitrogen Load: Casein degradation releases ammonia-nitrogen into the effluent stream, complicating secondary treatment and raising Kjeldahl nitrogen values.
  • Fluctuating Organic Load: Seasonal milk procurement peaks, post-monsoon flush milk, festival season production surges, mean your ETP experiences dramatic influent swings, which destabilise conventional treatment systems.
  • Low pH Events: Acidic whey from paneer or curd production can crash your aeration basin’s pH and wipe out your microbial population almost overnight.

When untreated or poorly treated dairy effluent reaches surface water bodies, the consequences are severe. Dissolved oxygen depletes rapidly as microorganisms consume the organic load. Fish kills, algal blooms, and foul odours in surrounding areas follow. For a plant operating near agricultural land or a town water source, the liability, legal and reputational, is immense.

Bioremediation: The Green Future for Dairy Wastewater

Bioremediation: The Green Future for Dairy Wastewater

The conventional approach to dairy effluent treatment has largely relied on coagulation-flocculation, chemical dosing, and extended aeration. These methods work, partially. They are also expensive to run continuously, sensitive to load fluctuations, and generate large volumes of chemical sludge that create their own disposal headache.

Bioremediation offers a fundamentally different model.

At Team One Biotech, we have spent years developing and refining microbial consortia specifically engineered for high-FOG, high-BOD industrial wastewater. The principle is straightforward: instead of fighting the organic load chemically, you deploy the right microbial strains to consume it biologically, faster, more completely, and at a fraction of the residual impact.

Here is what happens when you introduce our specialised bacterial cultures into your ETP:

  • Lipase-producing bacteria break down FOG fractions that would otherwise coat your aeration tank surfaces and reduce oxygen transfer efficiency.
  • Protease-active strains digest milk proteins and casein, reducing nitrogen loading and preventing the build-up of putrefying solids.
  • Facultative and aerobic heterotrophs drive BOD reduction through accelerated organic oxidation.
  • Biosurfactant producers enhance the bioavailability of emulsified fats, allowing microbial attack on compounds that conventional systems simply cannot degrade.

The result is a measurable, consistent reduction in BOD and COD, without the chemical costs, without the sludge volume spike, and with a microbial community that adapts to your plant’s specific effluent fingerprint over time.

This is not a theoretical promise. It is applied microbiology in action.

Reducing BOD Step by Step: A Practical Framework

Reducing BOD Step by Step: A Practical Framework

Step 1, Primary Treatment (Physical Separation First)

Before any biological intervention can work effectively, your ETP needs a clean primary stage:

  • Screening and Grit Removal: Remove coarse solids and packaging remnants.
  • Grease Traps and DAF (Dissolved Air Flotation): Critical for dairy. A well-maintained DAF unit removes a significant fraction of FOG before it reaches biological treatment. This alone reduces the organic load entering secondary treatment substantially.
  • Equalisation Tank: Given the fluctuating nature of Indian dairy plant operations, an adequately sized equalisation basin is non-negotiable. It buffers pH swings and load spikes before they damage your microbial culture in the aeration basin.

Step 2, Secondary (Biological) Treatment

This is where bioremediation does its most important work:

  • Activated Sludge Process (ASP) or Sequential Batch Reactor (SBR): Both are viable platforms for microbial treatment. The key variable is MLSS (Mixed Liquor Suspended Solids), maintaining this within the right operational range ensures your biological community has enough active biomass to handle the load.
  • Sludge Age Management: One of the most overlooked parameters in dairy ETPs. Too short a sludge retention time, and nitrifying organisms wash out. Too long, and you accumulate inert solids that reduce treatment efficiency. Team One Biotech’s bioaugmentation products help stabilise this balance, particularly after a load shock or chemical dosing event that has crashed your native microbial population.
  • Nutrient Dosing: High-carbohydrate, high-protein dairy effluent sometimes lacks sufficient phosphorus for optimal microbial growth. Balancing the BOD:N:P ratio supports a more robust biological community.

Step 3, Tertiary Treatment and ZLD Compliance

Zero Liquid Discharge (ZLD) is increasingly mandated by CPCB and various SPCBs for food processing units in ecologically sensitive zones and those drawing on groundwater. For dairy plants, ZLD means:

  • Treated effluent passing through filtration, ultrafiltration, and Reverse Osmosis (RO) stages before water recovery.
  • The biological quality of effluent entering the tertiary stage directly impacts RO membrane life and fouling rates, which is why effective secondary BOD reduction is not optional, it is foundational.
  • Recovered water can be cycled back into CIP (Clean-in-Place) operations, cooling towers, or utility use, reducing freshwater consumption.

Our bioaugmentation programme reduces the organic burden reaching RO systems, extending membrane replacement intervals and lowering your tertiary treatment operational costs.

Compliance, Climate, and Cost For Dairy Effluent Treatment

Compliance, Climate, and Cost For Dairy Effluent Treatment

CPCB guidelines set discharge standards for food processing industry effluent that include specific BOD, COD, suspended solids, and oil-grease thresholds. State Pollution Control Boards often apply additional, more stringent norms. Non-compliance attracts penalties, closure notices, and in repeat cases, criminal liability under the Environment Protection Act.

But Indian dairy plants face a challenge that CPCB norms do not account for: seasonality. Post-monsoon flush milk production in states like UP, Punjab, and Gujarat significantly increases both milk procurement and processing volumes, and therefore effluent generation, over a relatively short window. Conventional chemical treatment systems, sized for average loads, are overwhelmed. Microbial systems, by contrast, scale biologically. A higher substrate load simply means more microbial growth and accelerated BOD removal, provided the system is seeded with the right culture and given adequate oxygen and nutrients.

Hot-climate fermentation is another reality. Organic matter in Indian dairy ETPs degrades faster in summer months, generating odours that affect community relations and invite complaints to the local SPCB. Deploying odour-control microbial blends alongside your treatment programme addresses this at the source rather than masking it with deodorants.

Team One Biotech: Your Compliance Partner, Not Just a Product Supplier

Team One Biotech’s product portfolio for industrial wastewater treatment India covers the full spectrum of dairy ETP needs:

  • Bioaugmentation cultures for BOD/COD reduction in ASP and SBR systems.
  • FOG-degrading microbial blends for grease trap and DAF system enhancement.
  • Odour management bioproducts for equalisation tanks and sludge handling areas.
  • Sludge volume reduction formulations that lower your dewatering and disposal costs.

Beyond dairy, our solutions are trusted across pharma effluent treatment, paper and pulp, sugar mill wastewater, and food processing sectors, which means if your facility handles multiple product lines or if you manage a diversified portfolio of plants, we have a solution tailored for each.

We do not hand you a product catalogue and leave. Our team conducts site-specific assessments, reviews your current ETP performance data, and recommends a dosing protocol calibrated to your actual effluent characteristics. We stay engaged through the stabilisation period, adjusting the programme as your plant’s operational conditions evolve.

Stop Reacting. Start Treating Properly.

The next PCB inspection is coming. The question is whether you will be explaining a compliance failure or presenting a treatment system that actually works.

BOD reduction in dairy is not a one-time fix, it is an ongoing operational commitment. Bioremediation, done right, makes that commitment sustainable, cost-effective, and genuinely compliant with CPCB wastewater compliance standards.

Ready to get your dairy ETP under control?

Request a Free Site Audit, Let our bio-experts assess your current ETP performance and identify gaps. Consult Our Industrial Wastewater Specialists, Speak with a senior team member about bioremediation for milk plants and get a customised treatment roadmap.

Team One Biotech. Bioremediation that works. Compliance you can stand behind.

Looking to improve your ETP/STP efficiency with the right bioculture?
Talk to our experts at Team One Biotech for customised microbial solutions.

Contact: +91 8855050575

Email:  sales@teamonebiotech.com

Visit: www.teamonebiotech.com

Discover More on YouTube – Watch our latest insights & innovations!-

Connect with Us on LinkedIn – Stay updated with expert content & trends!
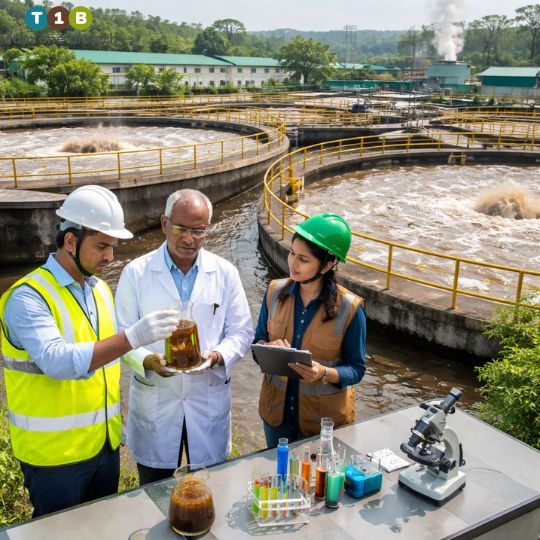
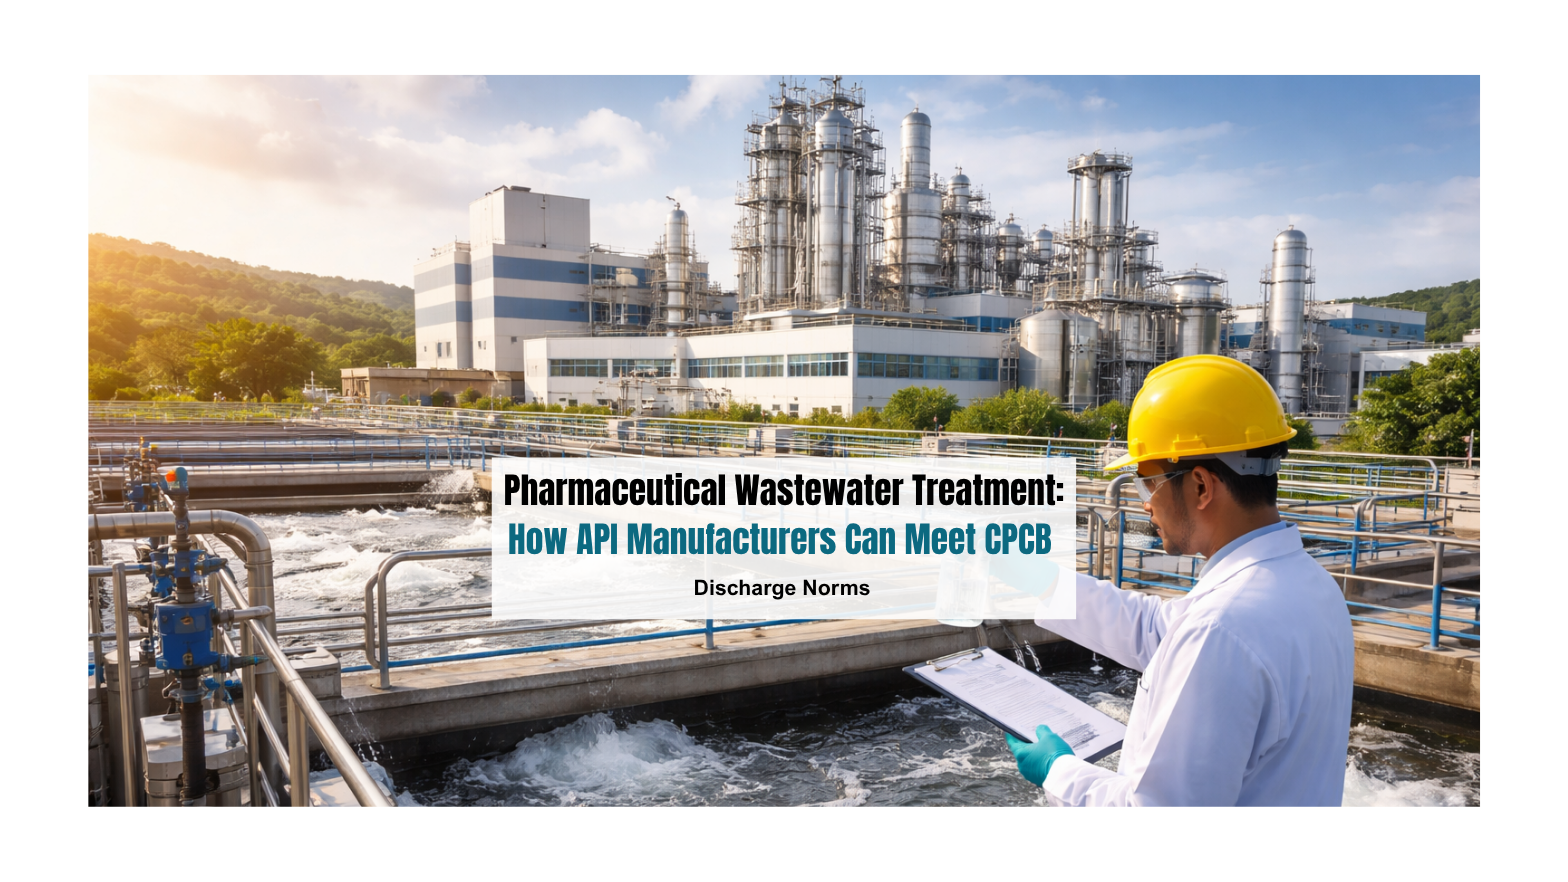
Pharmaceutical Wastewater Treatment: How API Manufacturers Can Meet CPCB Discharge Norms

If your Consent to Operate renewal is coming up in the next six months, this post is worth reading carefully. CPCB and SPCB inspection teams across Baddi, Vapi, Hyderabad, and Ankleshwar have sharpened their scrutiny of API manufacturing units over the past two years. Effluent quality records, real-time monitoring data from OCEMS, and third-party lab reports are being cross-verified with a level of technical rigor that most legacy ETPs were simply not designed to withstand.

The problem is not that plant managers are careless. The problem is that pharmaceutical effluent, particularly from API synthesis, is one of the most technically complex wastewater streams in Indian industry. High chemical oxygen demand (COD) in the range of 8,000 to 25,000 mg/L, sharp TDS spikes during solvent recovery operations, low biodegradability indices (BOD:COD ratios below 0.3 in many cases), and the persistent presence of refractory organics such as sulfonamides, beta-lactam intermediates, and heterocyclic compounds, none of this is manageable through conventional physicochemical treatment alone.

If your plant is still relying on a coagulation-flocculation-filtration sequence as the primary treatment mechanism, you are already operating at a structural compliance deficit. Effective biological wastewater treatment requires adaptive biological management.

What CPCB Discharge Norms Actually Require from API Units

What CPCB Discharge Norms Actually Require from API Units

The Regulatory Baseline You Cannot Negotiate Around

Under the Environment Protection Act and the rules framed thereunder, API manufacturing units classified under the Red Category are subject to stringent effluent discharge standards. The current CPCB general standards for discharge into inland surface water include:

  • COD: Not exceeding 250 mg/L
  • BOD (5-day, 20°C): Not exceeding 30 mg/L
  • Total Suspended Solids (TSS): Not exceeding 100 mg/L
  • pH: 5.5 to 9.0
  • Total Dissolved Solids (TDS): No Universal Fixed Limit

For units operating in ecologically sensitive zones or discharging into coastal waters, state-level norms enforced by SPCBs such as GPCB in Gujarat or TSPCB in Telangana are often more stringent than the national baseline. In Hyderabad’s Patancheru-Bollaram cluster, for example, combined effluent treatment plants have faced closure orders not because individual units violated any single parameter, but because cumulative biological oxygen demand loading breached the receiving water body’s assimilative capacity.

The Shift Toward Biological Stabilization

The regulatory shift over the last five years has been unmistakable. CPCB’s technical guidance documents and NGT-driven action plans have increasingly moved away from the notion that physicochemical treatment alone constitutes adequate ETP design for pharmaceutical and bulk drug units. The current compliance expectation, whether stated explicitly in your CTO conditions or implied through inspection scoring rubrics, is biological stabilization, the treatment of effluent to the point where residual organic load is not merely precipitated or filtered out, but metabolically degraded.

This is where the operational gap is widest for most API plants, and where bioremediation-led solutions have moved from being a niche option to a mainstream compliance necessity.

Why Standard Activated Sludge Processes Fail in API Effluent

Why Standard Activated Sludge Processes Fail in API Effluent

The Refractory Organic Problem

Conventional activated sludge processes (ASP) depend on a mixed microbial community adapted to biodegrade organic matter using dissolved oxygen. These microbial communities perform adequately on domestic sewage, food processing wastewater, and moderate-strength industrial effluent. They are not equipped, by design or by acclimatization, to degrade the complex aromatic structures, halogenated compounds, and nitrogen-rich organics that characterize API manufacturing effluent.

When your aeration tank receives a batch discharge containing synthesis intermediates or solvent residues, two outcomes are typical. Either the MLSS concentration crashes due to biological toxicity, or the sludge becomes bulky with SVI values exceeding 200 mL/g, causing blanket carryover into the secondary clarifier and a direct spike in effluent TSS.

The Hydraulic and Seasonal Loading Variable

There is a complicating factor that rarely gets discussed in ETP audits but has a measurable impact on biological treatment performance: hydraulic loading variability driven by monsoon infiltration. In industrial clusters across Himachal Pradesh, Gujarat coastal belt, and Telangana, groundwater ingress into underground sewer networks during heavy rainfall months can dilute influent COD by 30 to 60%, disrupting the food-to-microorganism (F:M) ratio in aeration basins and destabilizing the biological equilibrium your system took weeks to establish.

Designing treatment responses around a static influent quality assumption is a common ETP design flaw.

Bioremediation in ETP: The Science Behind Specialized Microbial Cultures

Bio-Augmentation vs. Bioaugmentation-Plus-Acclimatization

Team One Biotech’s approach to pharmaceutical effluent treatment is grounded in targeted bio-augmentation, the introduction of specialized, pre-screened microbial consortia capable of degrading specific classes of refractory organics that the indigenous mixed liquor cannot metabolize.

These are not generic bacterial cultures. The strains developed and deployed by Team One Biotech for API manufacturing effluent are selected for:

  • Tolerance to high solvent concentrations and low BOD:COD ratios
  • Capacity to degrade aromatic ring structures including benzimidazole, pyrimidine, and chlorinated phenol intermediates
  • Stability under fluctuating pH (5.5 to 9.5) without requiring biological system restart
  • Compatibility with existing SBR, MBR, and extended aeration configurations without requiring capital modifications

Operational Performance Metrics

In bio-augmented systems treating pharmaceutical and API effluent, the following operational improvements are typically observed:

  • COD reduction efficiency: 75% to 92% across aeration and secondary treatment stages
  • BOD:COD ratio improvement in treated effluent: from a pre-treatment range of 0.15–0.30 to post-treatment values of 0.05–0.10
  • MLSS stabilization: 2,500 to 4,500 mg/L maintained without the sludge bulking events common in uninoculated systems
  • SVI normalization: typically brought within 80 to 150 mL/g range within 3 to 6 weeks of consistent dosing
  • Sludge volume reduction: 15% to 35% depending on influent organic load and existing digestion capacity

Note: These are general performance values. Specific results and operating parameters vary depending on the unique characteristics of each individual ETP and influent quality.

Cross-Sector Applicability, Dairy, Food Processing, Sugar, Tannery, and Paper Industries

Cross-Sector Applicability, Dairy, Food Processing, Sugar, Tannery, and Paper Industries

The biological treatment challenges described above are not exclusive to pharmaceutical units. Plant managers and EHS heads across several other high-load sectors face structurally similar compliance pressures.

Dairy and Food Processing

Dairy effluent carries high BOD loads (typically 1,500 to 4,500 mg/L) from fats, lactose, and cleaning chemical residues. The challenge here is less about refractory organics and more about rapid organic loading variability tied to production schedules. Bio-augmentation with lipase-producing and lactose-degrading microbial consortia accelerates treatment kinetics significantly in extended aeration systems.

Sugar and Distillery

Distillery spent wash remains one of the most challenging effluents in Indian industrial wastewater management, with COD values routinely between 80,000 and 120,000 mg/L. Melanoidin compounds, the dark-colored refractory polymers formed during fermentation, are highly resistant to conventional biological treatment. Specialized ligninolytic and melanoidin-degrading cultures can meaningfully reduce color and residual COD in the post-anaerobic treatment stage. 

Tannery Sector

In tannery clusters across Kanpur and Tamil Nadu, effluent contains sulphide, chromium, and protein degradation products in combination. Bio-augmented systems using sulphide-oxidizing and chromium-tolerant microbial consortia have demonstrated effective secondary treatment performance where standard ASP systems have repeatedly failed SPCB inspections.

Paper and Pulp

Lignocellulosic effluent from paper mills, with COD loads of 5,000 to 15,000 mg/L and high color values driven by lignin derivatives, responds well to fungal-bacterial consortium-based bioaugmentation, particularly in CETP-linked secondary treatment stages.

Note: These are general performance values. Specific results and operating parameters vary depending on the unique characteristics of each individual ETP and influent quality.

Next Steps for EHS Managers and Plant Technical Heads

If your ETP is consistently producing treated effluent with COD above 350 mg/L, if your sludge is bulking intermittently, or if your next CTO renewal is within the next 12 months, the time for remediation is before the inspection, not after the notice.

Team One Biotech provides:

  • On-site technical ETP audits covering biological process assessment, influent characterization, and CPCB compliance gap analysis
  • Customized microbial dosing charts specific to your effluent composition, ETP configuration, and seasonal hydraulic loading profile
  • Ongoing technical support through dosing adjustment, performance monitoring, and pre-inspection documentation review

To schedule a technical ETP audit or request a customized microbial dosing recommendation for your pharmaceutical, dairy, sugar, or tannery unit, contact Team One Biotech’s technical team directly. Bring your last three months of ETP monitoring data to the first consultation. The more specific the input, the more precise the solution.

Looking to improve your ETP/STP efficiency with the right bioculture?
Talk to our experts at Team One Biotech for customised microbial solutions.

Contact: +91 8855050575

Email:  sales@teamonebiotech.com

Visit: www.teamonebiotech.com

Discover More on YouTube – Watch our latest insights & innovations!-

Connect with Us on LinkedIn – Stay updated with expert content & trends!
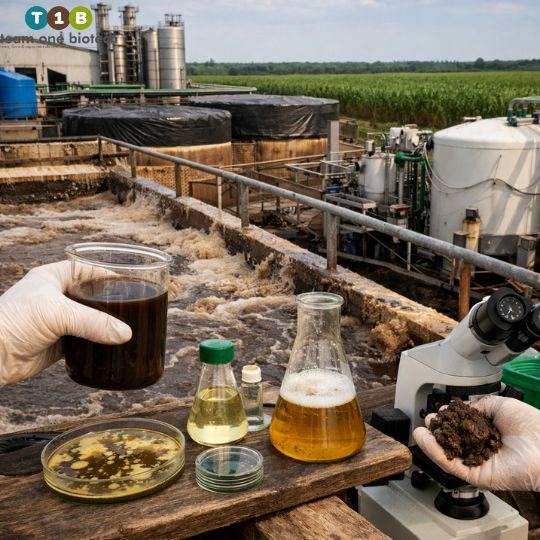
Cost-Benefit Analysis: Why ZLD is a Long-Term Asset for Water-Stressed Regions

Walk into any plant manager’s office in Tiruppur right now and you will likely find two things on the desk: a production schedule and a borewell depth report. Ten years ago, only one of those documents mattered for daily operations. Today, both carry equal weight.

That shift, quiet, gradual, and now impossible to ignore, is reshaping how India’s industrial leadership thinks about water. Not as a utility that flows from a tap and exits through a drain, but as a finite resource that entire communities, ecosystems, and production lines are competing for simultaneously.

In Tamil Nadu, Gujarat, and Maharashtra, the pressure is no longer theoretical. Groundwater levels in key industrial corridors have been declining for years. The National Green Tribunal has shut down hundreds of units for non-compliance. CPCB and SPCB enforcement is no longer occasional, it is systematic. And the question facing every C-suite executive, plant manager, and sustainability officer who depends on water-intensive processes is no longer “should we invest in better water management?” It is “how much longer can we afford not to?”

Zero Liquid Discharge is the answer that keeps coming up. Not because it is fashionable, and not simply because regulators are pushing for it, but because implementing Zero Liquid Discharge (ZLD) Systems ensures that the economics, when looked at honestly and in full, are becoming increasingly difficult to argue against.

This article is that honest look.

What ZLD Actually Means in the Indian Industrial Context

From Treatment to Recovery: A Fundamental Shift in Thinking

For decades, effluent treatment was designed around one core assumption: the water leaves. You treat it to an acceptable standard, you discharge it into a drain or waterbody, and your obligation ends at the boundary wall. The entire infrastructure of conventional ETPs, equalization tanks, aeration basins, secondary clarifiers, was built to service that assumption.

Zero Liquid Discharge tears that assumption up entirely.

In a zero liquid discharge plant, the target is exactly what the name suggests. No liquid waste leaves the facility. Every litre of wastewater that enters the treatment system either comes out the other end as clean, reusable process water, or it gets concentrated down to a solid or semi-solid waste that can be managed, and in some cases, monetized. The drain is no longer the destination. Recovery is.

Making that shift work demands a much more granular understanding of water quality parameters than a conventional ETP ever required. You are no longer just treating to a discharge standard, you are managing a recovery system. And that system is sensitive to everything in the water.

The parameters that ZLD operations must track and control include:

  • Total dissolved solids (TDS) in water, the single most operationally critical parameter in most ZLD systems, because TDS concentration governs how hard your membranes have to work and how much energy your evaporators consume
  • COD and BOD, organic load that must be substantially reduced before water reaches membrane or thermal concentration stages
  • Suspended solids, fine particulates that foul membrane surfaces and reduce system life if not adequately managed upstream
  • pH, conductivity, and specific ionic concentrations, sulfates, chlorides, calcium, heavy metals, all of which influence scaling behavior in evaporation systems
  • Temperature, relevant for both biological activity in pre-treatment and thermal efficiency in concentration stages

Of all these, high TDS in water is what stops most Indian industrial effluent treatment systems in their tracks. Whether you are running a textile dyeing unit in Surat, a pharmaceutical API plant in Hyderabad, a distillery in Uttar Pradesh, or a chemical processing facility in Ankleshwar, managing TDS economically, without sacrificing water recovery, is the central engineering and financial challenge of ZLD implementation.

The Technology Stack Behind a Zero Liquid Discharge Plant

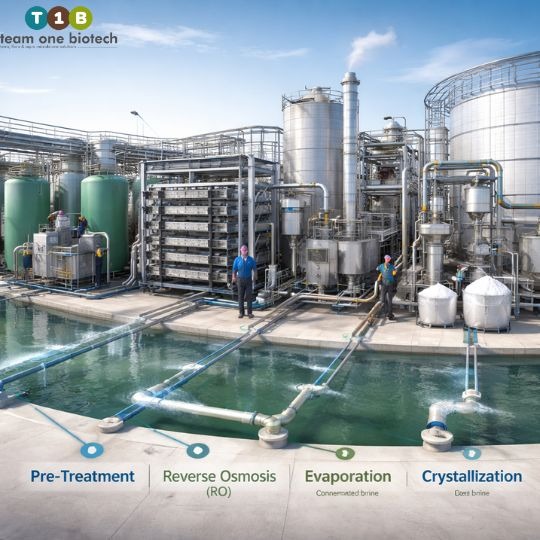
A full-scale ZLD system is not a single piece of equipment. It is a treatment train, a carefully sequenced set of processes, each dependent on the one before it performing to specification:

  • Primary Treatment: Screening, equalization, neutralization, and primary settling to remove gross solids and stabilize the flow
  • Biological Treatment: Aerobic and/or anaerobic systems to reduce organic load before the water reaches membranes
  • Tertiary Polishing: Ultrafiltration or multimedia filtration to remove residual suspended solids and protect downstream membrane systems
  • Reverse Osmosis: Membrane-based concentration to separate clean permeate water from a high-TDS reject stream
  • Evaporation: Multi-effect evaporators (MEE) or mechanical vapor recompression (MVR) systems to concentrate the RO reject further
  • Crystallization or Drying: Final stage to convert concentrated brine into a dry, manageable solid

Each of these stages must be designed for the specific effluent it will handle. A textile mill running reactive dye effluent has a completely different ZLD design requirement than a pharma plant managing solvent-laden process wastewater. That specificity is not a complication, it is a quality marker. Any ZLD proposal that does not begin with detailed effluent characterization is not a proposal worth accepting.

The Cost-Benefit Deep Dive

The Cost-Benefit Deep Dive

CAPEX: Understanding What You Are Actually Paying For

Let us be direct about something that often gets smoothed over in vendor conversations: ZLD systems cost more to build than conventional ETPs. Depending on the industry, effluent volume, and TDS levels involved, the capital expenditure for a zero liquid discharge plant can run 2x to 4x higher than a comparable conventional treatment system. That is a real number, and pretending otherwise does not serve anyone well.

These are general values and estimates; actual performance and costs vary based on the specific ETP/STP configuration and influent characteristics.

Where does that CAPEX go?

  • Membrane systems, UF and RO arrays are precision equipment with significant procurement costs, and they need to be sized generously to handle peak loads without sacrificing recovery
  • Evaporation systems, the MEE or MVR unit is typically the most expensive line item in the entire ZLD capital budget, driven by the materials, engineering complexity, and energy infrastructure required
  • Pre-treatment upgrades, in most Indian facilities, the existing ETP was not built to feed a ZLD system, and bringing it up to standard requires meaningful investment
  • Automation and instrumentation, ZLD systems cannot be run on manual checks and periodic grab samples; they require real-time monitoring, automated dosing controls, and SCADA integration to operate reliably

That CAPEX number is often where the internal conversation stalls. A finance committee sees the figure, compares it to the cost of continuing with existing treatment, and questions whether the investment is justified. That question is valid, but it is only answerable if the comparison includes the full financial picture, not just the build cost.

OPEX: Where the Long-Term Argument Lives

ZLD systems do carry higher operating costs than conventional ETPs. The energy consumption of evaporation systems is the primary driver of this, and it is a legitimate operational cost that any honest analysis must account for.

But here is what that same honest analysis must also account for:

Water recovery in a well-designed ZLD system can reach 80% to 95% of the total inlet volume. That recovered water goes back into the production process as clean, reusable supply. In a district where groundwater extraction is restricted, borewell levels are declining, or industrial water tariffs are rising, which describes a growing number of industrial zones across India, that recovery is not a convenience. It is a direct replacement for freshwater that would otherwise need to be purchased, transported, or extracted. The procurement savings compound over time.

Newer MVR-based evaporation technology is also shifting the energy equation. MVR systems recover and reuse the thermal energy from the evaporation process itself, substantially reducing the power consumption that made older MEE-based ZLD systems expensive to run. For facilities investing in ZLD today, the long-term OPEX profile looks meaningfully better than it did five years ago.

Some industries also recover tangible value from the solid or concentrated byproducts of ZLD processing. Distilleries can recover potassium-rich condensate from evaporation stages. Certain chemical processes generate concentrated salt streams that can be refined and resold. These recoveries are industry-specific and should not be assumed without technical analysis, but where they exist, they directly improve the ZLD business case.

These are general values and estimates; actual performance and costs vary based on the specific ETP/STP configuration and influent characteristics.

The Hidden Costs of Non-Compliance: The Number Nobody Puts in the Spreadsheet

Here is the calculation that most facilities skip, because it involves acknowledging a scenario nobody wants to plan for:

What does it actually cost when things go wrong?

Regulatory fines are the visible tip. The deeper damage runs much further:

  • A single SPCB closure notice, even a temporary production suspension pending compliance verification, can cost more in lost output, missed shipments, and broken contracts than an entire year of ZLD OPEX. Fixed costs do not pause while the legal process runs its course.
  • Legal battles to reverse environmental enforcement orders are slow, expensive, and rarely clean. They consume management bandwidth, legal budgets, and board attention for months, sometimes years.
  • Water procurement costs in genuinely water-stressed districts are already escalating and will continue to do so. Facilities running on tanker water or unreliable borewells are not operating on a stable cost base, they are absorbing an inflation risk that gets worse every dry season.
  • Global buyers in apparel, pharmaceuticals, agrochemicals, and food processing are conducting supplier environmental audits with increasing seriousness. A facility with a non-compliance record risks losing export contracts, failing ESG due diligence reviews, and becoming ineligible for the institutional supply chains that offer the best margins.
  • Operating license renewals in several Indian states are now directly tied to environmental compliance history. A poor track record introduces structural uncertainty into long-term capital planning that no amount of operational efficiency can fully offset.

None of these costs appear in the CAPEX-versus-OPEX comparison that gets presented to the finance committee. They should.

The Hidden Gains: What ZLD Gives You That Nobody Markets Loudly Enough

Beyond avoiding the downside, ZLD adoption creates real, measurable value that pre-implementation analysis consistently undercounts:

  • Water independence is perhaps the most strategically significant. A facility that recycles 80% to 95% of its process water is not merely compliant, it has fundamentally de-risked its operations against water scarcity. That resilience has a value that grows every year as regional water stress intensifies.
  • Reduced freshwater draw lowers exposure to tariff increases and regulatory restrictions on industrial groundwater extraction, both of which are accelerating across multiple states.
  • ESG and sustainability reporting value is real and growing. Companies reporting under BRSR, GRI, or preparing for international ESG disclosures benefit from documented water recovery metrics. For businesses seeking institutional investment or public market access, this is increasingly material.
  • The narrative shift from “compliance obligation” to “resource stewardship” matters in ways that are difficult to put on a spreadsheet but very easy to see in stakeholder conversations, investor presentations, and community relations.

Bioremediation and ZLD: The Upstream Partnership That Changes the Economics

Bioremediation and ZLD: The Upstream Partnership That Changes the Economics

Why the Quality of Pre-Treatment Determines the Fate of Your ZLD Investment

This is the part of the ZLD conversation that does not get enough attention, and it is directly relevant to why so many Indian facilities see worse-than-expected performance from ZLD systems they have invested heavily in.

Membrane systems and evaporators are the most capital-intensive components of any zero liquid discharge plant. They are also the most sensitive. Feed them effluent that is too high in COD, too loaded with biological material, or carrying specific contaminants that drive scaling and fouling, and they will underperform, require more frequent cleaning, consume more chemicals, and degrade faster than the design life you were promised.

The performance of your ZLD system is, in very large part, a downstream consequence of the quality of your upstream biological treatment.

This is where advanced bioremediation changes the economics of ZLD at a system level, not just a pre-treatment level.

Team One Biotech’s bioaugmentation formulations introduce highly specialized microbial consortia into industrial effluent streams, targeting the organic compounds, specific contaminants, and biological load that standard biological treatment either handles poorly or cannot manage at all. In practice, this translates to:

  • COD reductions of 60% to 85% upstream of membrane systems, directly reducing fouling frequency, extending membrane replacement intervals, and lowering cleaning chemical costs
  • Improved management of TDS load by degrading certain organic dissolved solids before they reach the concentration stages, reducing the thermal energy burden on evaporators
  • Sludge volume reduction through more efficient biological activity, lowering the handling and disposal costs that are an often-underestimated component of ZLD OPEX
  • Targeted degradation of complex, recalcitrant molecules, pharmaceutical compounds, reactive dye intermediates, pesticide residues, that physical-chemical treatment alone cannot efficiently address

These are general values and estimates; actual performance and costs vary based on the specific ETP/STP configuration and influent characteristics.

The integration of bioremediation upstream of ZLD infrastructure is not a supplementary add-on for facilities that want to go the extra mile. It is an economic optimization that improves the cost-per-litre-recovered across the full operational life of the plant. The membrane lasts longer. The evaporator runs cleaner. The overall system performs closer to its designed recovery targets.

Meeting CPCB and SPCB Standards Through Biological Intelligence

There is another dimension to bioremediation in the ZLD context that matters specifically for Indian regulatory compliance. Facilities operating in red-category industry classifications, textiles, pharmaceuticals, chemicals, distilleries, tanneries, are expected to demonstrate water quality parameter management that goes well beyond volume control. CPCB and SPCB compliance inspections look at the full profile of what is in the water, not just how much of it there is.

Biological treatment offers something that chemical dosing cannot: adaptive capacity. Microbial systems respond to changes in influent load and composition in ways that chemical systems cannot, without the proportional increase in reagent cost and secondary waste generation. For Indian industrial facilities dealing with seasonal production variation, changing raw material inputs, and the inherent variability of complex effluent streams, that adaptability is not a minor technical advantage. It is operational resilience built into the treatment process itself.

Is ZLD the Right Decision for Your Facility Right Now?

Is ZLD the Right Decision for Your Facility Right Now?

Asking the Right Questions Before You Ask About the Price

ZLD adoption is not one-size-fits-all, and the right answer depends on your specific situation, not on a general industry position. Before any serious investment conversation begins, a facility needs clear answers to:

  • What does your current effluent look like, volume, COD, TDS, specific contaminants, and seasonal variability?
  • What is the condition and capacity of your existing ETP or STP infrastructure?
  • Are you operating under an active CPCB or SPCB compliance notice, or planning proactively?
  • How water-stressed is your specific location, what do borewell trends, district water availability data, and local regulatory signals tell you about your five-year supply risk?
  • What is your production growth plan, and what does that mean for your water demand trajectory?

The worst implementation of ZLD is a rushed one, driven by a regulatory deadline, executed without adequate site characterization, and optimized for speed rather than performance. Those systems underdeliver on recovery, overspend on OPEX, and create the impression that ZLD is more expensive than it needs to be. Proactive planning changes that outcome fundamentally.

The Facilities That Will Thrive Are Not the Ones That Spent the Least on Compliance

There is a version of this decision where a facility waits. It manages the existing ETP, addresses enforcement notices reactively, and defers the ZLD conversation until the regulatory or operational pressure becomes unavoidable. That is a coherent short-term position.

It is also, in the vast majority of water-stressed industrial contexts across India, a strategically costly one.

The facilities that will operate with confidence through the next decade of industrial growth are the ones that made the decision early enough to do it right. They designed their zero liquid discharge plant with adequate pre-treatment. They integrated bioremediation upstream to protect their membranes and optimize their recovery rates. They used the transition to reduce their freshwater dependence, improve their compliance standing, and build the kind of water resilience that turns a potential shutdown risk into a genuine competitive advantage.

Water stewardship, at this scale and in this moment in Indian industrial history, is not just good environmental practice. It is good business.

Talk to Team One Biotech Before the Next Dry Season Forces the Conversation

If your facility is in a water-stressed district, running under compliance scrutiny, or expanding operations in a zone where groundwater availability is declining, the right time for a ZLD feasibility analysis is now, not after the next enforcement notice arrives.

Team One Biotech works with industrial clients across India to design and optimize integrated wastewater treatment systems that combine advanced bioremediation with ZLD-ready infrastructure. A site audit from our team means a detailed look at your actual effluent profile, a clear-eyed assessment of your treatment gaps, and a realistic investment framework, CAPEX, OPEX, and recovery projections, built around your specific industry, volume, and regulatory environment.

No generic proposals. No theoretical frameworks that do not account for what is actually in your water.

Contact Team One Biotech today to schedule your site-specific water and compliance audit. The cost of that conversation is zero. The cost of the alternative is something most facilities only calculate once, after it is already too late.

Looking to improve your ETP/STP efficiency with the right bioculture?
Talk to our experts at Team One Biotech for customised microbial solutions.

Contact: +91 8855050575

Email:  sales@teamonebiotech.com

Visit: www.teamonebiotech.com

Discover More on YouTube – Watch our latest insights & innovations!-

Connect with Us on LinkedIn – Stay updated with expert content & trends!
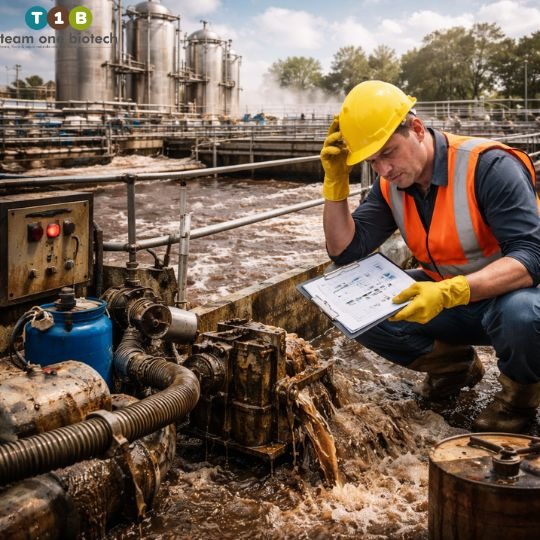
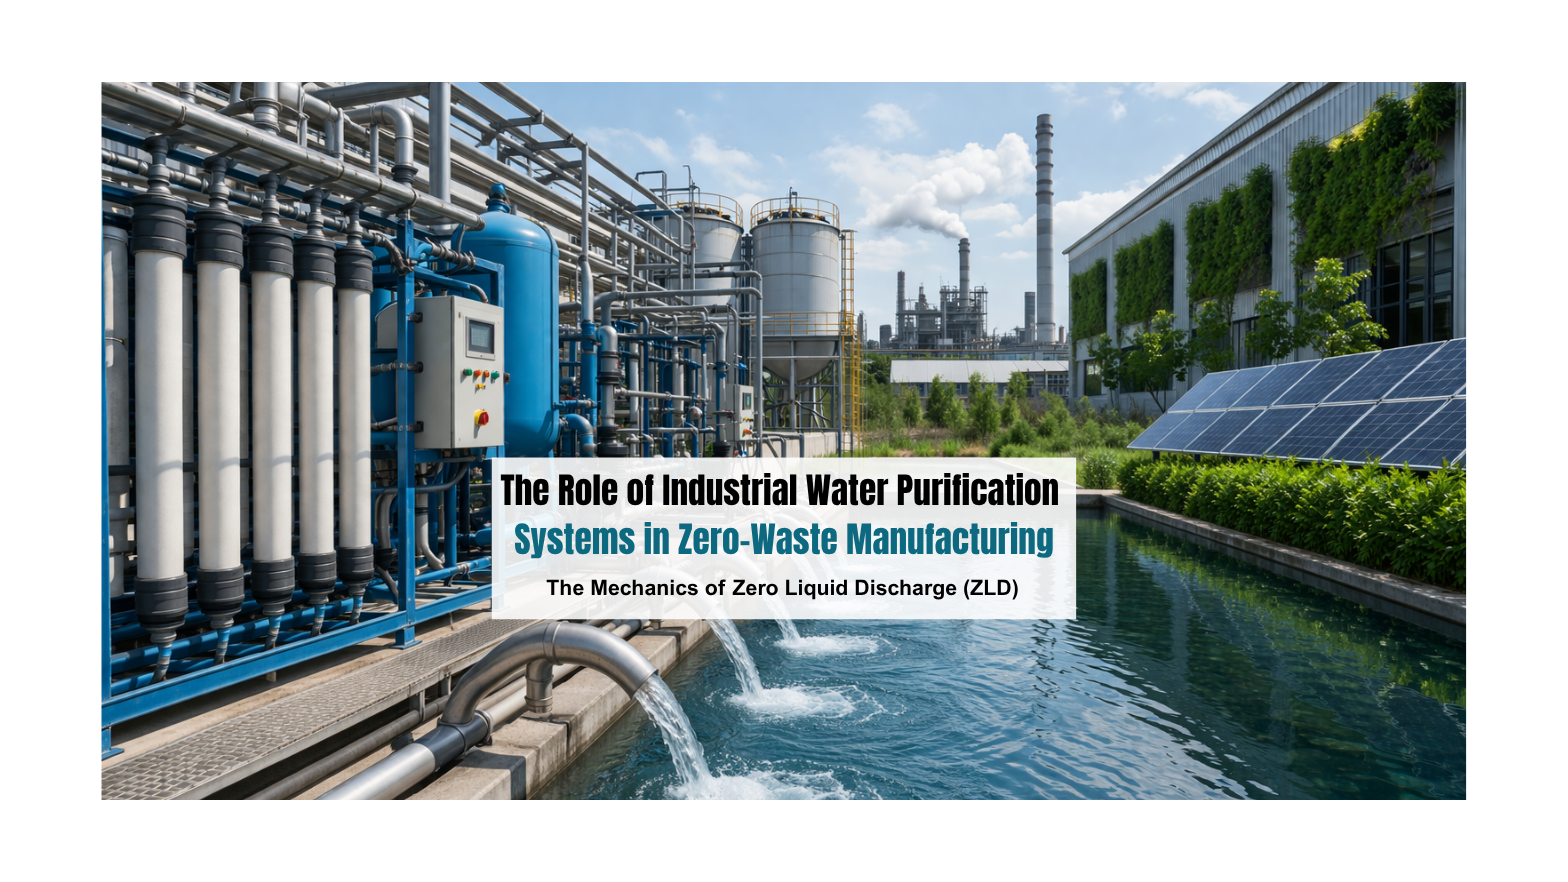
The Role of Industrial Water Purification Systems in Zero-Waste Manufacturing

India stands at a critical crossroads where industrial expansion meets an escalating hydrological crisis. As groundwater levels deplete and the Central Pollution Control Board (CPCB) tightens its grip on discharge norms, the “business as usual” approach to wastewater is no longer viable. For plant managers and environmental stakeholders, the transition to zero-waste manufacturing via Zero Liquid Discharge (ZLD) Systems isn’t just an ethical choice, it is a prerequisite for operational survival.

The paradigm shift toward Zero Liquid Discharge (ZLD) represents the pinnacle of industrial water stewardship. By viewing effluent not as a liability to be discarded, but as a resource to be reclaimed, industries can insulate themselves against water scarcity while ensuring absolute environmental compliance.

The Mechanics of Zero Liquid Discharge (ZLD)

The Mechanics of Zero Liquid Discharge (ZLD)

A Zero Liquid Discharge plant is a sophisticated engineering ecosystem designed to ensure that no liquid waste leaves the facility boundaries. Rather than a single machine, think of it as a symphony of mechanical, chemical, and biological treatments that work in harmony to recover purified water and reduce contaminants to a solid, manageable form.

The typical ZLD lifecycle follows a rigorous progression:

  • Pre-treatment: This is the first line of defense, utilizing chemical precipitation and biological oxidation to remove suspended solids and heavy organic loads.
  • Filtration and Concentration: Advanced membrane technologies, such as Reverse Osmosis (RO), act as a high-tech sieve. This stage concentrates the waste stream, recovering a significant portion of the water for immediate reuse.
  • Evaporation and Crystallization: The final stage deals with the “brine.” Thermal evaporators drive off the remaining moisture, leaving behind solid crystals that can be safely handled or, in some cases, repurposed for industrial use.

Note: These are general values provided for illustrative purposes and vary significantly based on specific ETP configurations, local discharge norms, and influent characteristics.

The Science of TDS: Managing the Silent Barrier to Recovery

One of the most persistent hurdles in ZLD water treatment is the management of Total Dissolved Solids (TDS) in water. TDS represents the inorganic salts and organic matter trapped in solution. In an industrial setting, high TDS levels act like sandpaper on your equipment, they are corrosive to machinery and can quickly ruin expensive recovery membranes.

Effective TDS management requires a dual-pronged strategy:

  • Source Reduction: Analyzing the manufacturing line to minimize the intake of salts before they even reach the water.
  • High-Recovery Membranes: Utilizing specialized RO systems specifically engineered to handle high osmotic pressures without failing.

When TDS is managed with precision, the recovery rate of a plant can reach between 75% to 95%, drastically reducing the volume of water that must undergo the more expensive thermal evaporation process.

Critical Water Quality Parameters

Critical Water Quality Parameters

To achieve consistent water recovery goals, plant operators must move beyond “guesswork” and maintain a granular understanding of their effluent’s chemistry. Monitoring these water quality parameters is the difference between a smooth operation and a compliance nightmare:

  • pH Levels: Maintaining a neutral range is vital. Extreme acidity or alkalinity can “kill” the helpful bacteria in your biological stages and corrode your infrastructure.
  • Chemical Oxygen Demand (COD): This measures the total oxidation required. A high COD is a red flag, indicating a heavy load of industrial pollutants.
  • Biochemical Oxygen Demand (BOD): This measures how much oxygen bacteria consume while breaking down organic matter. Lowering BOD is the primary goal of any effective bioremediation stage.
  • Total Suspended Solids (TSS): These are the physical particles that must be caught early to prevent “fouling” or clogging downstream filters.

Is your system hitting these benchmarks? Consult with the experts at Team One Biotech today to schedule a comprehensive audit of your water quality metrics.

Challenges in the Indian Industrial Landscape

Implementing industrial effluent treatment in India isn’t a “one-size-fits-all” task. Local manufacturers face unique hurdles that international blueprints often overlook:

1. Monsoon Variability

The sudden, massive influx of rainwater during the monsoon can dilute influent characteristics, often “shocking” the biological balance of an Effluent Treatment Plant (ETP). Systems must be designed to stay resilient despite these fluctuating concentrations.

2. Regulatory Pressure

State Pollution Control Boards (SPCBs) are no longer flexible. For “Red Category” industries, like textiles, pharmaceuticals, and tanneries, ZLD is increasingly a mandatory “license to operate.”

3. The CAPEX vs. OPEX Balance

Mechanical ZLD systems are a significant investment. The challenge for Indian businesses is finding a way to balance high initial costs with biological interventions that lower long-term power and chemical consumption.

Bioremediation: The Intelligent Engine of Modern ZLD

Bioremediation: The Intelligent Engine of Modern ZLD

While steel tanks and filters handle the physical separation, bioremediation serves as the “brain” of the operation. At Team One Biotech, we specialize in integrating advanced biological solutions that work alongside mechanical hardware to make the whole system more efficient.

By introducing specialized microbial strains, we can drastically reduce the organic load (BOD/COD) before the water hits the membranes. This “pre-conditioning” acts like a protective shield, preventing the scaling and fouling of RO units and reducing the energy needed for final evaporation.

Why Bio-Augmentation Matters:

  • Better Settling: Enhanced flocculation helps solids settle faster, taking the pressure off your primary clarifiers.
  • Toxic Resilience: Tailored microbes are “tougher” and can survive the chemical shocks common in industrial waste.
  • Reduced Waste: Efficient biological digestion can actually shrink the volume of secondary sludge by 20% to 40%.

Note: These are general values provided for illustrative purposes and vary significantly based on specific ETP configurations, local discharge norms, and influent characteristics.

Building a Circular Future

The ultimate goal of a Zero Liquid Discharge plant is to move away from the old “take-make-waste” mindset. In a truly zero-waste facility, water is treated as a revolving asset. Purified effluent is cycled back into cooling towers, boilers, or process lines. Even the recovered salts can sometimes find a second life in the chemical supply chain.

By investing in high-end purification today, companies aren’t just following the law, they are securing their operational future against rising water costs and dwindling resources.

Securing Your Operational Future

The journey to zero-waste manufacturing is a complex one, but you don’t have to navigate it alone. Team One Biotech provides the technical depth and biological innovation needed to turn environmental compliance from a burden into a competitive advantage.

Is your facility ready for the next generation of water recovery?

Contact Team One Biotech for a bespoke compliance roadmap and ETP optimization strategy. Let’s work together to turn your wastewater into a sustainable asset.

Don’t wait for a compliance notice. Our technical team is ready to perform on-site system audits to identify bottlenecks and implement high-efficiency biological upgrades immediately.

Looking to improve your ETP/STP efficiency with the right bioculture?
Talk to our experts at Team One Biotech for customised microbial solutions.

Contact: +91 8855050575

Email:  sales@teamonebiotech.com

Visit: www.teamonebiotech.com

Discover More on YouTube – Watch our latest insights & innovations!-

Connect with Us on LinkedIn – Stay updated with expert content & trends!
Understanding Water Quality Parameters: How to Manage TDS and COD for High-Recovery ZLD Systems

Walk into any large textile plant in Surat or a distillery on the outskirts of Lucknow, and you will find the same conversation happening in the plant manager’s office. It usually starts with a compliance notice pinned to a file, a membrane replacement quote that seems too high, and someone asking why the RO system is not delivering the recovery numbers it promised on paper.

The answer, almost always, comes back to two things: TDS and COD. Get those wrong, and nothing downstream works the way it should. By implementing efficient Zero Liquid Discharge (ZLD) Systems, these challenges are mitigated. Get them right, and a zero liquid discharge plant stops being a burden and starts behaving like an asset.

But before we get into the engineering of it, let us be honest about the situation Indian industry is actually operating in.

The Pressure Is Real, And It Is Not Going Away

Water scarcity in India is no longer a distant environmental concern. It is a present operational reality. Industries in Red Category classifications, textiles, pharma, chemicals, distilleries, are under closer CPCB and SPCB scrutiny than at any point in the last two decades. Consent renewals are being held up. Effluent discharge violations are triggering shutdowns, not just warnings. And in several industrial clusters, the message from regulators has shifted from “comply by this date” to “you should have complied already.”

For plant managers and sustainability heads navigating this environment, the stress is not just regulatory. It is financial. A shutdown costs more than a compliance upgrade. A membrane array replaced two years ahead of schedule costs more than the biological treatment that could have protected it. The economics of inaction, when you lay them out clearly, are far worse than the economics of investment.

This is the context in which Zero Liquid Discharge has to be understood, not as a government imposition, but as the smarter industrial strategy for anyone serious about long-term operations in India.

What ZLD Actually Demands From Your System

Zero Liquid Discharge means exactly what it says. No treated or untreated effluent crosses your plant boundary. Every drop of process water, cooling water, boiler blowdown, and wash water is captured, treated, and returned to your operations.

In practice, a ZLD water treatment system works in stages. Biological treatment in your ETP handles the bulk of the organic load. Advanced physico-chemical polishing follows. Then comes Reverse Osmosis for water recovery, and finally, thermal evaporation, Multi-Effect Evaporators or Mechanical Vapor Recompression systems, to manage the concentrated reject that RO cannot recover.

Each of these stages has a tolerance ceiling. Feed water that exceeds those tolerances does not just reduce efficiency. It degrades equipment, accelerates fouling cycles, and compresses the operational life of assets that cost crores to install.

And the two water quality parameters that most often push systems past those ceilings are Total Dissolved Solids and Chemical Oxygen Demand. They are distinct problems, but they share one consequence when mismanaged: they make every downstream stage of your ZLD system work harder, cost more, and fail sooner.

Total Dissolved Solids, What the Numbers Actually Mean for Your Plant

Total Dissolved Solids, What the Numbers Actually Mean for Your Plant

Understanding TDS in Industrial Effluent

Total dissolved solids in water is the aggregate of everything dissolved in your effluent, salts, minerals, ionic compounds, dissolved organics, trace metals. In a laboratory, it shows up as a single number. In an actual industrial plant, it is the cumulative signature of every chemical used, every salt addition made, and every process event that has touched the water before it reaches your ETP inlet.

The TDS profile varies sharply by industry. Textile dyeing units, particularly those processing reactive dyes, regularly generate raw effluent with TDS concentrations in the range of 8,000 to 25,000 mg/L. This is driven largely by the volumes of salt used in dye fixation, and it does not wash out easily. Pharmaceutical plants running multi-product batch operations typically see TDS in the range of 5,000 to 15,000 mg/L, with significant variation depending on which API is being synthesized at any given time. Distilleries sit at the most challenging end of the spectrum, spent wash streams can carry TDS concentrations ranging from 80,000 to 1,00,000 mg/L before any treatment has occurred.

These are not abstract figures. They are the incoming reality that your ZLD equipment has to handle.

Disclaimer: These values are general benchmarks and can vary significantly based on specific Effluent Treatment Plant (ETP) configurations and influent characteristics.

What High TDS Does to Your RO and Evaporation Assets

Here is where the engineering gets personal for anyone managing a zero liquid discharge plant.

Reverse Osmosis membranes operate within a defined osmotic pressure envelope. When TDS in the feed water climbs beyond the membrane’s design tolerance, typically somewhere in the 5,000 to 10,000 mg/L range for standard industrial RO configurations, the physics of the situation turns against you. The osmotic pressure required to push water through the membrane rises. You either reduce recovery rates to compensate, increase operating pressure and absorb the energy cost, or accept that your membranes will foul faster and need replacement sooner.

A TDS spike of 20% to 30% above design values can pull your membrane recovery down from a target band of 70% to 80% to somewhere between 50% and 60%. That gap in recovery represents water you are not reclaiming, and energy you are spending without return.

The effect carries through to your evaporation stage as well. When the RO reject entering your MEE or MVR unit carries a higher-than-designed TDS load, scaling on heat exchanger surfaces accelerates. Cleaning cycles become more frequent. Steam consumption rises. What was planned as a scheduled maintenance event becomes a reactive one, and reactive maintenance in a ZLD context is always more expensive than the problem it was supposed to prevent.

Most SPCBs mandate TDS limits in treated effluent as a condition of consent renewal, inland surface water discharge norms generally specify TDS not exceeding 2,100 mg/L, though many state boards apply tighter standards to specific industrial clusters. But within a ZLD framework, meeting the discharge limit is almost a secondary concern. The primary concern is protecting the recovery infrastructure you have invested in.

Disclaimer: These values are general benchmarks and can vary significantly based on specific Effluent Treatment Plant (ETP) configurations and influent characteristics.

Managing COD Through Bioremediation, The Case for Getting the Biology Right First

Managing COD Through Bioremediation, The Case for Getting the Biology Right First

Why COD Is Where ZLD Economics Are Won or Lost

Chemical Oxygen Demand tells you how much oxygen it would take to chemically oxidize all the organic and inorganic matter in your effluent. In the context of a ZLD water treatment system, COD is the single most consequential parameter upstream of your membrane stage.

The reason is straightforward. Most industrial RO systems are designed to receive feed water with COD in the range of 100 to 250 mg/L. Raw effluent from textile, chemical, and pharmaceutical operations regularly arrives at the ETP inlet at 2,000 to 15,000 mg/L. Distillery spent wash, in untreated form, can present COD concentrations of 80,000 to 1,20,000 mg/L.

When COD is not adequately reduced before the RO stage, what follows is predictable and expensive. Organic fouling takes hold on membrane surfaces. Biofilm establishes itself. Chemical precipitation events become more frequent. Membranes that should last several years are being pulled and replaced in under two. And each replacement cycle adds to an operating cost burden that was never part of the original ZLD business case.

Disclaimer: These values are general benchmarks and can vary significantly based on specific Effluent Treatment Plant (ETP) configurations and influent characteristics.

What Bioremediation Actually Does, and Why Generic Products Fail in Indian Plants

This is where biological treatment, and specifically bioremediation, enters the picture. The principle is not complicated: you deploy specialized microbial consortia, naturally occurring bacteria and enzyme complexes, or bio-augmented cultures developed for specific effluent profiles, to break down complex organic molecules before they reach your expensive downstream equipment.

What makes bioremediation genuinely valuable in a ZLD context is not just that it reduces COD. It is that it reduces COD at a fraction of the cost of thermal or chemical intervention. Every kilogram of COD that a well-configured biological system eliminates in the ETP stage is a kilogram that does not need to be managed by your RO membranes, your evaporators, or your chemical dosing systems. In a well-functioning biological treatment stage, COD reduction can range between 70% to 92%, depending on effluent composition, hydraulic retention time, and the specificity of the microbial cultures deployed.

But here is where a lot of Indian plants fall short, and it is worth being direct about this. Generic microbial products purchased off a catalogue and applied without any real understanding of the plant’s specific effluent matrix rarely deliver consistent results. Indian industrial environments are genuinely complex. Effluent quality shifts with seasonal variation in raw materials. Production schedules are irregular. Multi-product facilities create effluent compositions that can look completely different from one week to the next. A biological treatment strategy that does not account for this variability will underperform precisely when you need it most, during a high-load period, a product changeover, or a regulatory inspection cycle.

If your RO membranes are fouling faster than their design life, or if COD is breaking through into your membrane feed despite what looks like adequate ETP operation, the answer is almost certainly in the biology, and the biology needs to be understood at the site level, not guessed at from a product datasheet.

This is exactly what Team One Biotech’s site-specific bioremediation audits are designed to address. Our environmental engineers work alongside your ETP operators, analyze your actual effluent matrix, and develop microbial intervention strategies that are calibrated to your plant’s real operating conditions, not a theoretical average. Reach out to Team One Biotech to schedule an audit and find out where your biological treatment is leaving performance on the table.

How Managing Both Parameters Builds a High-Recovery System

The most effective zero liquid discharge plant configurations operating in Indian industry today are not the ones with the most expensive equipment. They are the ones where each treatment stage is configured to protect the one that follows it.

When TDS and COD are both managed deliberately, a cascade of operational benefits follows:

  • Biological Treatment Stage: A well-augmented ETP reduces COD from inlet concentrations of 3,000 to 10,000 mg/L down to the 200 to 500 mg/L range, while TSS reduction through settling reduces the suspended load carried forward. TDS is not significantly changed at this stage, but the organic fouling potential of the water drops substantially.
  • Physico-Chemical Polishing: Coagulation, flocculation, pH correction, and media filtration refine what the biological stage has already improved. This stage is cheaper and more reliable to operate when the upstream biology has done its job.
  • RO Membrane Stage: With COD managed upstream and TDS within the membrane’s design tolerance, recovery rates hold in the 70% to 85% range. Membrane life extends toward design specifications. Energy consumption stays within the operating budget rather than creeping above it.
  • Thermal Evaporation (MEE/MVR): The concentrate arriving at the evaporator carries a predictable TDS load. Scaling is controlled. Cleaning cycles are planned events rather than emergency interventions. The system delivers consistent ZLD compliance without the operational firefighting that characterizes poorly integrated plants.

None of this happens by accident. It happens because someone took the time to understand each water quality parameter and its downstream consequences, and then built a treatment strategy around that understanding rather than around the lowest upfront cost.

Disclaimer: These values are general benchmarks and can vary significantly based on specific Effluent Treatment Plant (ETP) configurations and influent characteristics.

Water Independence Is a Strategy, Not Just a Compliance Target

The industries that will be in the strongest operational position five years from now are not those that installed a ZLD system to satisfy a regulatory condition and moved on. They are the ones that understood what their ZLD water treatment system actually needed to perform well, and invested in managing total dissolved solids in water and COD upstream, so the expensive hardware downstream could do its job reliably.

The compliance pressure from CPCB and state boards is real, and it is intensifying. But the smarter frame for this conversation is not “how do we avoid a shutdown.” It is “how do we build a water treatment architecture that gives us operational continuity, cost predictability, and genuine water independence.”

That architecture starts with getting the biology right.

Team One Biotech works with large-scale Indian industries, textile, pharma, chemical, distilleries, to deliver site-specific bioremediation strategies that protect ZLD infrastructure, reduce operating costs, and strengthen compliance standing. If your plant is navigating the challenges of TDS management, COD reduction, or ZLD system optimization, our team is ready to conduct a detailed on-site audit and help you build a treatment approach grounded in your actual operating conditions. Get in touch with Team One Biotech and take the first step toward water independence that is engineered, not improvised.

Looking to improve your ETP/STP efficiency with the right bioculture?
Talk to our experts at Team One Biotech for customised microbial solutions.

Contact: +91 8855050575

Email:  sales@teamonebiotech.com

Visit: www.teamonebiotech.com

Discover More on YouTube – Watch our latest insights & innovations!-

Connect with Us on LinkedIn – Stay updated with expert content & trends!
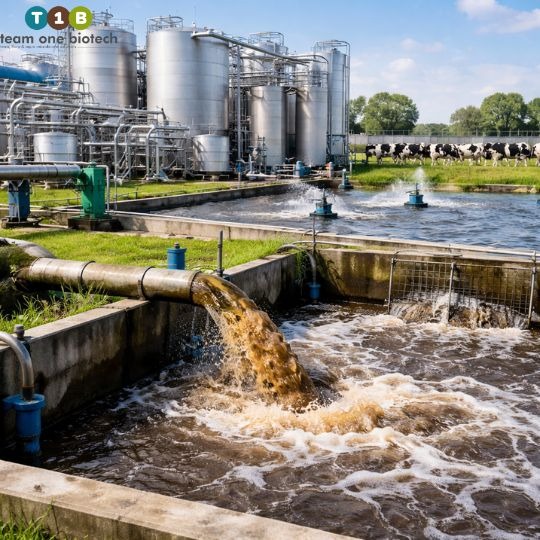
What is Zero Liquid Discharge? A Guide to ZLD Process and ROI for Indian Factories

There is a quiet crisis running beneath the surface of India’s industrial heartland, literally. Groundwater tables are dropping across Gujarat, Maharashtra, Tamil Nadu, and Punjab. Rivers that once absorbed decades of industrial discharge are now under the microscope of an increasingly assertive regulatory regime. The Central Pollution Control Board and State Pollution Control Boards are no longer issuing warnings, they are issuing closure notices.

For plant managers and factory owners in textiles, pharmaceuticals, power generation, and specialty chemicals, the question is no longer “Do we need a Zero Liquid Discharge plant?” The question has become “How long can we operate without one?”

This is not only a story of fear and compliance. Increasingly, it is a story of competitive advantage, of factory leaders who moved early by implementing Zero Liquid Discharge (ZLD) Systems: Achieving Sustainability and Regulatory Compliance, recovered water they were previously paying to procure, and turned a regulatory burden into a balance sheet win.

This guide explains what zero liquid discharge actually means, how the ZLD process works in an Indian industrial context, and how to think about the return on investment with clarity and honesty.

Why Standard ETPs Are No Longer Enough

Why Standard ETPs Are No Longer Enough

Most large Indian factories built their effluent treatment infrastructure during an era when the primary benchmark was visible cleanliness, reducing colour, odour, and suspended solids before discharge. Conventional Effluent Treatment Plants were designed to meet those benchmarks. Many still do, on paper.

The problem is that the regulatory goalposts have shifted, and they are continuing to shift.

Modern ZLD mandates, particularly for industries in ecologically sensitive zones or those drawing from shared water bodies, require something fundamentally different: no liquid discharge at all. Not reduced discharge. Not treated discharge. Zero.

This is where the concept of Total Dissolved Solids (TDS) in water becomes central to the conversation.

The ZLD Process, Stage by Stage

The ZLD Process, Stage by Stage

A well-engineered Zero Liquid Discharge plant works by sequentially concentrating and separating dissolved solids from water until the water is recovered for reuse and the solids are left as a manageable solid waste. The process typically moves through three major phases.

Stage 1, Pre-Treatment and Biological Reduction

Before water enters any membrane or thermal system, it must be conditioned. This stage involves:

  • Screening and equalization to stabilize flow and concentration
  • pH correction and chemical dosing to prevent scaling in downstream equipment
  • Biological treatment (activated sludge, MBBR, or SBR) to reduce organic load, BOD and COD, as far as possible
  • Clarification and multimedia filtration to remove suspended solids and protect membranes

The quality of pre-treatment directly determines the efficiency and longevity of everything downstream. Factories that underinvest here pay disproportionately higher operating costs in the evaporation stage.

Stage 2, Reverse Osmosis and Membrane Concentration

Once pre-treated, the effluent passes through Reverse Osmosis (RO) systems. RO membranes apply pressure to force water molecules through a semi-permeable barrier, leaving dissolved solids behind in a concentrated reject stream.

A typical ZLD-grade RO train will recover 60% to 80% of the feed water as clean permeate suitable for reuse in the factory.

Please note that these are general values and ranges; actual performance and costs vary based on specific Effluent Treatment Plant (ETP) configurations and influent characteristics.

The remaining 20% to 40% is a high-TDS concentrate. This is where many older ZLD designs stall, because concentrating this reject stream further requires significantly more energy. Advanced systems layer multiple RO passes, or introduce intermediate softening steps, to push recovery rates higher before handing off to thermal processes.

Stage 3, Evaporation, Crystallization, and Solid Recovery

The RO concentrate enters the Multiple Effect Evaporator (MEE) or Mechanical Vapour Recompression (MVR) system, where heat is used to evaporate remaining water, concentrating the dissolved solids into a slurry. This slurry then proceeds to an Agitated Thin Film Dryer (ATFD) or crystallizer, which produces a dry solid cake.

This solid waste is either sent to a TSDF facility for disposal or, in certain cases, recovered as a saleable byproduct, common in the case of sodium sulphate or sodium chloride-heavy textile effluents.

The recovered water from the evaporation stage loops back into the factory’s utility water supply, completing the zero-discharge cycle.

The Indian Context, High Salinity, High Stakes

The Indian Context, High Salinity, High Stakes

ZLD is not a European concept transplanted onto Indian soil. In practice, Indian industrial effluents present specific challenges that a generic ZLD design may not adequately address.

Textile clusters in Tirupur, Surat, and Bhilwara generate effluents saturated with reactive dyes, sodium chloride, and sodium sulphate, a combination that accelerates membrane fouling and demands aggressive pre-treatment chemistries.

Pharmaceutical hubs in Hyderabad and Ahmedabad produce complex organic matrices with variable TDS, often combined with solvents and APIs that interfere with biological treatment at the pre-treatment stage.

Thermal power plants face high-TDS cooling tower blowdown alongside fly ash leachate, streams that require separate segregation before any ZLD chain can be applied efficiently.

Localization of the ZLD design, accounting for raw effluent TDS, seasonal temperature variation, water table sensitivity, and the specific regulatory directives of state-level SPCBs, is not optional. It is the difference between a system that performs and one that consumes budget while failing inspections.

The ROI of ZLD, Beyond Compliance, Into Profitability

The ROI of ZLD, Beyond Compliance, Into Profitability

The most common objection to ZLD investment is upfront capital cost. It is a legitimate concern. ZLD infrastructure is not cheap. But the financial analysis changes significantly when you account for all the variables on both sides of the ledger.

What ZLD Recovers for You

  • Freshwater procurement costs: Industries in water-stressed districts are paying increasingly significant sums for tanker water or bore-well deepening. A functional ZLD system can recycle 60% to 85% of process water, dramatically reducing this dependency.
  • Chemical input recovery: In certain textile and chemical applications, the crystallized byproduct stream can be partially recovered and reused as a process input, reducing raw material costs.
  • TSDF disposal reduction: When biological treatment at the pre-treatment stage is optimized, sludge volumes entering the ZLD chain are lower, which reduces TSDF disposal costs and frequency.

Please note that these are general values and ranges; actual performance and costs vary based on specific Effluent Treatment Plant (ETP) configurations and influent characteristics.

What Non-Compliance Costs You

This part of the calculation is frequently underestimated. The financial exposure from regulatory non-compliance in India’s wastewater sector now includes:

  • CPCB/SPCB-imposed penalties and environmental compensation orders
  • Production shutdowns enforced by closure notices, some lasting months during legal proceedings
  • Bank and insurance risk escalation, as lenders increasingly scrutinize environmental compliance status during credit reviews
  • Reputational cost with global buyers, particularly in textiles and pharma, who now conduct supplier environmental audits as standard procurement practice

When the true cost of non-compliance is placed alongside the annualised cost of ZLD ownership, the ROI case strengthens considerably for any factory operating at meaningful scale.

Where Bioremediation Fits, The Biological Edge in ZLD Systems

This is an area that most engineering-focused ZLD vendors do not discuss, but it is one of the most significant levers available for reducing operating costs in a ZLD chain.

The evaporator is the most energy-intensive component of any ZLD plant. The higher the organic and dissolved load entering the evaporator, the more energy and maintenance the system consumes. Every unit of BOD, COD, or biological oxygen demand that is destroyed in the pre-treatment stage is a unit that the evaporator does not have to handle.

This is where biological augmentation, the deliberate introduction of high-performance microbial cultures to enhance biological pre-treatment, creates measurable value. By deploying specialised bacterial consortia that accelerate the breakdown of complex organics, refractory compounds, and high-strength industrial wastewater, it is possible to significantly reduce the load reaching the membrane and thermal stages.

The downstream impact: reduced evaporator run-time, lower energy consumption, and extended membrane life, all of which affect operating cost directly.

At Team One Biotech, this biological optimisation of the ZLD pre-treatment chain is a core area of specialisation. Our formulations are developed for the specific organic profiles and TDS ranges common to Indian industrial effluents, not generic products, but targeted biological solutions calibrated to your plant’s chemistry.

The Next Step, A Compliance Audit Built for Your Industry

ZLD is not a product you purchase off a shelf. It is an engineered system that must be aligned with your effluent characteristics, your water recovery targets, your regulatory timeline, and your capital structure.

The industrial leaders who are ahead of this curve did not get there by waiting for a closure notice. They initiated a structured review of their current ETP performance, identified the gaps between where they are and where regulations require them to be, and built a roadmap with clear financial logic.

If you are operating in textiles, pharmaceuticals, power, or specialty chemicals, and you are not yet certain whether your current ETP infrastructure is ZLD-ready, the most valuable conversation you can have today is a Compliance and System Readiness Audit.

Team One Biotech offers site-specific ZLD readiness assessments that evaluate your current water quality parameters, TDS profile, treatment gaps, and biological pre-treatment potential. We translate technical findings into financial terms, because compliance decisions at this level are investment decisions.

Contact Team One Biotech today to schedule your Compliance Audit or System Optimisation Consultation. Our industrial wastewater specialists work across India’s major manufacturing hubs and understand the ground-level realities of both CPCB mandates and plant operations.

The question is not whether ZLD is coming for your industry. It already has. The question is whether you are positioned to meet it, or caught off guard by it.

Looking to improve your ETP/STP efficiency with the right bioculture?
Talk to our experts at Team One Biotech for customised microbial solutions.

Contact: +91 8855050575

Email:  sales@teamonebiotech.com

Visit: www.teamonebiotech.com

Discover More on YouTube – Watch our latest insights & innovations!-

Connect with Us on LinkedIn – Stay updated with expert content & trends!
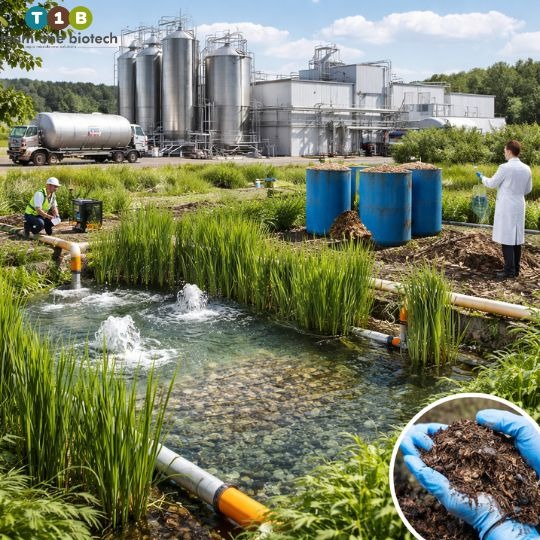
Scan the code