How to Meet CPCB Discharge Norms Without Increasing Chemical Dosage

It’s 7 AM, and before your coffee’s even gone cold, you’re staring at last night’s lab report. COD spiked again. You don’t know why yet, but you already know how this goes, someone from the SPCB office calls, or worse, shows up. You explain, you scramble, and somewhere in the back of your mind is the thought you’ve had a dozen times this year: “What if this is the time we actually get a closure notice?”

If that scenario feels a little too familiar, you’re not alone. Every ETP manager, every HSE officer, every factory head who’s ever had to sign a compliance report knows this exact flavor of dread. And the usual response, dose more coagulant, add more flocculant, push the oxidizer levels up, works today. Maybe tomorrow too. But it’s a patch, not a fix, and patches have a way of costing more every time you apply them.

There’s a better path. Instead of chasing compliance numbers with chemistry, you can build a treatment system that actually performs, biologically, mechanically, and operationally, so the numbers take care of themselves. This is what we do every day at Team One Biotech, and this article walks through exactly how it works.

Why Chemical Overdosing Isn’t a Sustainable Compliance Strategy

Why Chemical Overdosing Isn't a Sustainable Compliance Strategy

Chemical dosing has its place. Coagulants, flocculants, and oxidizers are legitimate tools in wastewater treatment. The problem isn’t that they exist, it’s when they become the default answer to every compliance scare instead of a targeted, occasional intervention.

Here’s what overdosing actually does to your operation over time:

  • It masks the real problem. A COD or BOD spike is usually a symptom, of poor aeration, a dying microbial population, or hydraulic overload. Chemicals can suppress the number on the report without touching the underlying cause, which means the same spike will return, often worse.
  • It inflates operating costs quietly. Chemical dosing costs don’t announce themselves as a single alarming line item. They creep, a little more coagulant this month, a little more oxidizer next month, until someone finally asks why the treatment budget has crept up so much year over year.
  • It generates more sludge, not less. Chemical precipitation tends to produce higher sludge volumes than biological treatment, which means higher disposal costs and more frequent desludging cycles.
  • It can destabilize your biology. Overdosing, especially with oxidizers, can kill off the very microbial populations your ETP depends on for baseline treatment, making your system more fragile, not more resilient.
  • It doesn’t scale with growing production. As output increases, chemical-dependent systems usually need proportionally more chemical input, while a well-tuned biological system tends to scale more efficiently with better retention and process design.

None of this means abandon chemical dosing altogether. It means treating it as a supporting tool, not a crutch you lean on every time a report comes back looking rough.

A quick gut-check: if your chemical dosing has been trending upward over the last several months without a corresponding increase in production volume, that’s usually a sign the root cause hasn’t been addressed, only masked.

Understanding What CPCB/SPCB Actually Expects

Understanding What CPCB/SPCB Actually Expects

Let’s step back and get plain about what regulators are actually measuring and why, without getting lost in numbers that vary by state and industry category anyway.

BOD (Biochemical Oxygen Demand) measures how much oxygen microorganisms need to break down organic matter in your effluent. Put simply, it’s a proxy for how much biodegradable pollution load you’re releasing. Higher BOD means more organic load, which can deplete oxygen in receiving water bodies and harm aquatic life.

COD (Chemical Oxygen Demand) measures the total amount of oxygen needed to chemically oxidize both biodegradable and non-biodegradable material in your effluent. COD is often higher than BOD in industrial effluent because industrial waste streams tend to include more complex, harder-to-break-down compounds.

TSS (Total Suspended Solids) measures the particulate matter floating or suspended in your discharge, the physical “stuff” that doesn’t dissolve. High TSS can clog waterways, smother aquatic habitats, and interfere with disinfection processes downstream.

Regulators expect all three parameters to sit within a permissible range that’s considered safe for the receiving environment, whether that’s a river, a municipal sewer, or land for irrigation. What counts as acceptable varies considerably depending on your industry category, the sensitivity of the receiving water body, and your state’s specific notification.

A note on numbers: You’ll notice we’re not quoting specific mg/L thresholds anywhere in this article, and that’s intentional. Actual CPCB and SPCB limits vary by state, by industry classification, and by the receiving water body your effluent discharges into. Some parameters that fall within a “moderate” range for one facility might be considered significantly higher than permissible for another operating under a stricter category. Always verify your applicable limits directly against your current SPCB/CPCB notification, or consult with an environmental compliance specialist who has visibility into your specific classification.

Where Most ETPs Lose Compliance Without Realizing It

Where Most ETPs Lose Compliance Without Realizing It

Here’s something we see constantly when we walk into a facility for the first time: the treatment system isn’t fundamentally broken. It’s just quietly underperforming in ways that don’t show up until a spike hits and everyone’s scrambling to explain it.

Common culprits include:

  • Inadequate aeration. If dissolved oxygen levels in your aeration tank aren’t sufficient, your aerobic microbial population can’t do its job efficiently, and BOD/COD removal suffers.
  • Insufficient hydraulic retention time. If effluent is moving through your system faster than your biology can process it, often because production volumes have grown without a matching upgrade to tank capacity, you’re essentially asking your ETP to do more work in less time.
  • Poor sludge health. An aging or imbalanced microbial community (measured loosely through sludge volume index and MLSS trends) is less effective at breaking down organic load, and this decline often happens gradually enough that nobody notices until performance craters.
  • Hydraulic and organic shock loading. Sudden spikes in flow or concentrated waste batches (common in facilities with irregular production schedules) can overwhelm a system that’s only calibrated for steady-state conditions.
  • Nutrient imbalance. Microorganisms need more than just organic matter to thrive, they need a balanced nutrient profile (commonly framed around nitrogen and phosphorus ratios). Without it, biological treatment efficiency drops even if everything else looks fine on paper.
  • Neglected mechanical maintenance. Clogged diffusers, worn-out blowers, or poorly calibrated dosing pumps quietly erode performance over months, long before anyone connects the dots to a compliance failure.

Here’s a useful exercise: take five minutes this week and map your last three “unexplained” compliance scares against this list. More often than not, at least one of these factors was already trending in the wrong direction before the spike showed up on a report.

Optimizing Biological Treatment Before Reaching for Chemicals

Optimizing Biological Treatment Before Reaching for Chemicals

This is where the real, durable fix lives, and it’s the part of the process we spend the most time on with our clients.

Biological treatment, done well, is remarkably efficient at reducing BOD and COD without the recurring cost and instability of heavy chemical dosing. The goal is to give your microbial community everything it needs to do the job it’s biologically built to do.

Bioremediation and microbial augmentation. Introducing targeted microbial cultures, engineered or selected specifically to break down the organic and industry-specific pollutants present in your effluent, can dramatically improve treatment efficiency, especially in systems where the native microbial population has been struggling or where waste composition is complex.

Rebuilding microbial balance. A healthy microbial ecosystem in your aeration tank isn’t just “more bacteria.” It’s the right mix of organisms suited to your specific waste stream, operating at population levels your tank can actually support. Overloading or underfeeding this population in either direction reduces effectiveness.

Nutrient dosing, done correctly. Rather than chemical coagulants, targeted nutrient supplementation (calibrated to your specific effluent characteristics) supports microbial health and activity, improving natural breakdown rates.

Aeration efficiency improvements. This doesn’t always mean bigger blowers, sometimes it means better diffuser placement, optimized run cycles, or simply cleaning and recalibrating existing equipment to actually deliver the oxygen levels your system was designed around.

Retention time tuning. Adjusting flow patterns or tank configuration to give your biology adequate contact time with the waste stream, rather than pushing effluent through faster than it can be processed.

The core idea here is simple: your biology is a living system, and living systems perform best when supported, not overridden. Chemical dosing overrides the system temporarily. Biological optimization strengthens it permanently.

Mechanical and Process Fixes That Reduce Chemical Dependency

Biology does the heavy lifting, but it needs the right mechanical environment to actually perform. A few process-level fixes we consistently see move the needle:

  • Diffuser and blower maintenance schedules. Fouled or damaged diffusers reduce oxygen transfer efficiency, forcing systems to compensate with more chemical intervention. A regular maintenance cadence prevents this silent decline.
  • Flow equalization. Installing or better utilizing equalization tanks smooths out the shock loading that comes from irregular production, giving your biological system consistent conditions to work with instead of unpredictable surges.
  • Sludge management optimization. Regular, appropriately timed desludging keeps your microbial population healthy and prevents the kind of sludge bulking that tanks treatment efficiency.
  • Instrumentation and monitoring upgrades. Real-time dissolved oxygen, pH, and flow monitoring lets you catch a developing problem days before it becomes a reportable spike, giving you time to make a process adjustment instead of an emergency chemical dose.
  • Process sequencing review. Sometimes the fix isn’t new equipment at all, it’s re-sequencing existing treatment stages (primary, biological, tertiary) to reduce the load hitting any single stage.

These fixes tend to have something in common: they’re investments that pay down over time, rather than recurring costs that climb every quarter.

Building a Sustainable, Cost-Effective Compliance Strategy

For the factory heads and executives reading this, here’s the budget-level version of everything above: chemical overdosing is an operating expense that grows with your compliance anxiety. Biological and process optimization is closer to a capital investment that reduces both your operating costs and your regulatory risk over time.

A sustainable compliance strategy typically includes:

  • A baseline audit of your current ETP performance, biological health, mechanical condition, and chemical dosing patterns, so you know exactly where the gaps are instead of guessing.
  • A phased optimization plan that addresses the highest-impact gaps first (often aeration and microbial health), rather than attempting a full overhaul at once.
  • A reduced, targeted chemical dosing protocol used for genuine edge cases, not as a daily crutch.
  • Ongoing monitoring and adjustment, since effluent characteristics shift as production changes, and a system tuned once needs periodic recalibration.
  • Documentation and reporting practices that give you confidence walking into an inspection, rather than dread.

This is a strategy that protects your margins and your compliance standing at the same time, which is exactly the pitch that tends to land well with a board asking why the treatment budget keeps rising.

Frequently Asked Questions

Can biological treatment alone meet CPCB discharge norms, or do I still need chemicals?

For many industrial waste streams, a well-optimized biological system can meet discharge norms with minimal chemical support, used only for specific edge cases rather than routine dosing. The right balance depends on your waste characteristics and current system design, an assessment is the fastest way to know for certain.

How long does it take to see results after switching from chemical-heavy dosing to biological optimization?

Timelines vary by facility, but many operations see measurable improvement within a few weeks of microbial and process optimization, with full stabilization typically following over a couple of months as the biological population adjusts and matures.

Will reducing chemical dosage put my compliance at risk during the transition?

A properly managed transition is phased, not abrupt, chemical dosing is reduced gradually as biological performance improves, with monitoring at every step to ensure discharge parameters remain within acceptable range throughout.

How do I know if my ETP’s biological system is underperforming?

Common indicators include recurring unexplained BOD/COD spikes, rising sludge volumes without a production increase, and a growing reliance on chemical dosing just to maintain the same compliance outcomes you used to hit with less. A professional assessment can confirm what’s actually happening beneath the surface.

The ranges and descriptions used throughout this article are general and indicative only. Actual CPCB and SPCB discharge limits vary significantly by state, industry category, and the specific receiving water body your facility discharges into. Please verify your current applicable limits against your relevant SPCB/CPCB notification, or consult with a qualified environmental compliance professional before making operational decisions.

Stop Managing Around Compliance Anxiety, Start Solving It

If you’re tired of watching your chemical costs rise while the same compliance scares keep coming back, it might be time to look at what’s actually happening inside your ETP, not just what the lab report says on the surface.

Team One Biotech works with industrial facilities every day to build biological treatment systems that meet discharge norms reliably, without the recurring cost and fragility of chemical overdosing. If you’d like a clear-eyed assessment of where your system stands and what it would take to get it performing the way it should, get in touch with our team. Contact Us, We’ll walk your process with you, not just your paperwork.

Looking to improve your ETP/STP efficiency with the right bioculture?
Talk to our experts at Team One Biotech for customised microbial solutions.

Contact+91 8855050575

Email:  sales@teamonebiotech.com

Visit: www.teamonebiotech.com

Discover More on YouTube – Watch our latest insights & innovations!-

Connect with Us on LinkedIn – Stay updated with expert content & trends!
STP Operation and Maintenance Cost in India 2026, Breakdown by Plant Capacity

It usually arrives at the worst possible time. A show-cause notice from the State Pollution Control Board, citing non-compliance with treated effluent parameters. Or worse, an AMC vendor standing at your gate with an “emergency repair” invoice that wasn’t in any quote you signed. For society management committees, factory owners, and procurement heads across India, the sewage treatment plant sitting in the basement or utility yard isn’t just mechanical equipment, it’s the single asset standing between your facility and its legal right to operate.

Your Consent to Operate (CTO), issued under the Water (Prevention and Control of Pollution) Act, is not a one-time formality. It is a continuing obligation, and the STP is how you fulfil it. When people ask about STP operation maintenance cost India-wide, they’re really asking a more pointed question: what does it actually cost to stay compliant, avoid penalties, and stop being surprised by vendor invoices? This guide breaks that down honestly, by capacity, so you can budget for 2026 with your eyes open.

Why the CPCB Framework Makes This Non-Negotiable

Why the CPCB Framework Makes This Non-Negotiable

The Central Pollution Control Board, through respective SPCBs, mandates that any facility discharging sewage or trade effluent maintain treatment infrastructure in continuous functional condition. This isn’t a suggestion buried in fine print, it’s a licensing condition tied directly to your CTO renewal. A malfunctioning STP, discovered during a routine inspection or a citizen complaint, can trigger:

  • Show-cause notices and compliance deadlines
  • Monetary penalties under environmental compensation provisions
  • In repeated or severe cases, closure directions or CTO suspension

Framing your STP budget as “optional maintenance” is where most facilities go wrong. It should be framed as a compliance line item with the same seriousness as fire safety or electrical certification.

The Anatomy of an STP Bill: Five Pillars of Monthly Cost

The Anatomy of an STP Bill: Five Pillars of Monthly Cost

Before looking at capacity-specific numbers, it helps to understand what actually drives a monthly STP running cost. Nearly every invoice, fair or inflated, breaks down into these five components:

  1. Electricity, Aeration blowers, pumps, and UV/ozone disinfection units are the biggest power draws, often 40-50% of running cost.
  2. Manpower, Trained operators for daily monitoring, log maintenance, and adjustment of dosing systems.
  3. Chemicals and consumables, Coagulants, chlorine tablets, pH correction chemicals, and antifoam agents.
  4. Sludge management, Dewatering, storage, and tanker-based removal to authorized disposal sites.
  5. Lab testing and compliance documentation, Periodic BOD, COD, TSS testing required for CPCB/SPCB reporting, plus record-keeping for inspections.

Every fair AMC quote should let you see these five pillars separately, not buried into one vague “maintenance fee.”

Capacity-Wise Cost Breakdown (2026 Ranges)

Capacity-Wise Cost Breakdown (2026 Ranges)

Cost per KLD (kiloliters per day) doesn’t scale linearly, smaller plants carry a higher relative burden because fixed costs like manpower and lab testing don’t shrink proportionally with capacity. Here’s how the numbers generally look for 2026 across three common capacity bands.

Parameter50 KLD STP100 KLD STP500 KLD STP
Monthly AMC charges (2026)₹35,000 – ₹55,000₹55,000 – ₹90,000₹1,80,000 – ₹3,20,000
Power cost (monthly, approx.)₹15,000 – ₹25,000₹28,000 – ₹45,000₹1,20,000 – ₹2,00,000
Manpower (operator visits/shifts)Part-time / visit-based1 dedicated operator2-3 shift operators
Chemical & dosing cost (monthly)₹4,000 – ₹8,000₹8,000 – ₹15,000₹35,000 – ₹60,000
Sludge handling & tanker removal₹3,000 – ₹6,000₹6,000 – ₹12,000₹25,000 – ₹45,000
Lab testing & compliance reporting₹2,500 – ₹4,000₹3,500 – ₹6,000₹8,000 – ₹15,000
Approx. running cost per KLD/month₹700 – ₹1,100₹550 – ₹900₹360 – ₹640

Note: These are general values and operational outcomes will vary based on the specific design, technology used, microbial load, and unique parameters of individual Effluent Treatment Plants (ETPs) and Sewage Treatment Plants (STPs).

If you’re evaluating a 100 KLD STP maintenance cost India quote and it falls well below the lower end of this range, that’s not necessarily good news, it usually means something’s been left out.

Reviewing a quote that looks too good to be true? A quick audit from Team One Biotech can tell you exactly what’s missing before you sign.

Understanding the “Per KLD” Equation

This is the part most procurement teams miss when comparing quotes across different-sized facilities. A 50 KLD plant doesn’t cost half of what a 100 KLD plant costs, it often costs 70-80% as much, because:

  • One operator visit costs roughly the same whether the plant treats 50 KLD or 100 KLD
  • Lab testing frequency and reporting obligations don’t reduce with smaller volume
  • Statutory compliance documentation is a fixed administrative burden regardless of scale

This is why the sewage treatment plant running cost per KLD is consistently higher for smaller societies and factories than for larger industrial campuses. If you’re benchmarking your AMC quote against a neighbouring facility of a different size, adjust your expectations accordingly, direct comparison without capacity context is one of the most common budgeting mistakes RWAs make.

Evaluating AMC Quotes: What’s Fair vs. What’s a Red Flag

A comprehensive, honest AMC for 2026 should transparently include:

  • Scheduled operator visits with defined frequency (daily, alternate-day, or weekly depending on capacity)
  • Water sample lab testing at a defined periodicity, with reports shared proactively
  • Blower and pump preventive maintenance, not just breakdown repair
  • Microbial/bio-culture dosing as part of routine treatment, not an add-on
  • Clearly stated inclusions for diffuser servicing, membrane cleaning, and sludge tanker costs

Watch for these red flags in unusually cheap quotes:

  • A base price that excludes diffuser overhauls or membrane replacement, items that surface as “surprise” costs six months in
  • No mention of sludge tanker removal frequency or disposal documentation
  • Vague or absent lab testing schedules (a compliance risk in itself)
  • Manpower listed as “on-call” rather than scheduled visits, especially for 100 KLD and above

If a vendor’s number seems dramatically lower than the ranges above, ask them directly which of the five cost pillars they’ve reduced or removed. The answer usually reveals the trade-off.

The Biotech Advantage: Lowering Cost Without Cutting Corners

The Biotech Advantage: Lowering Cost Without Cutting Corners

This is where facility owners often assume the only lever available is choosing a cheaper vendor. In reality, the more durable lever is improving what happens inside the tank.

Advanced microbial cultures and targeted bio-augmentation change the cost equation in three concrete ways:

  • Faster organic breakdown reduces hydraulic retention time strain and improves consistent BOD/COD reduction, lowering the risk of non-compliance during inspections.
  • Reduced sludge volume from optimized microbial digestion directly cuts tanker removal frequency, one of the more variable and often underestimated line items in an AMC.
  • Optimized aeration demand means blowers run more efficiently rather than longer, trimming the largest single cost pillar: electricity.

Team One Biotech’s bioremediation approach is built specifically around this principle, treating cost reduction as a byproduct of better biological performance, not a trade-off against compliance.

From Reactive Firefighting to Predictable Budgets

The facilities that struggle most with STP costs are usually the ones managing it reactively, reacting to breakdowns, surprise SPCB notices, and unplanned tanker calls. The facilities that budget confidently for 2026 are the ones that have moved to a planned, transparent AMC structure with a clear view of all five cost pillars, backed by microbial optimization that keeps running costs predictable month to month.

If you’re currently reviewing a quote, budgeting for a new CPCB compliant STP installation, or simply want a second opinion on whether your current AMC charges reflect fair 2026 market rates, don’t wait for the next inspection to find out.

Visit the Team One Biotech Contact Us page today for a customized facility audit and a transparent quote verification, before you sign anything.

Looking to improve your ETP/STP efficiency with the right bioculture?
Talk to our experts at Team One Biotech for customised microbial solutions.

Contact+91 8855050575

Email:  sales@teamonebiotech.com

Visit: www.teamonebiotech.com

Discover More on YouTube – Watch our latest insights & innovations!-

Connect with Us on LinkedIn – Stay updated with expert content & trends!
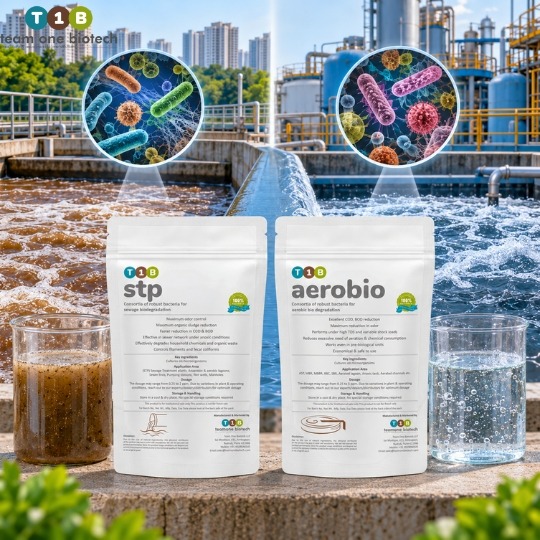
EU and US Buyers Rejecting Your Shrimp for Antibiotic Residues ,  What You Can Do Right Now

There is a particular kind of silence that falls over an export office when the email arrives. A consignment that left Kakinada or Nellore three weeks ago, fully paid for, fully documented, sailing toward what should have been a routine handover, has been flagged. Detained. Pending residue analysis.

What follows is not a single cost. It’s a cascading one. The container itself becomes a ticking demurrage clock, accumulating port storage fees by the day. The product inside, if confirmed positive, faces destruction or mandatory re-export at the exporter’s expense. The buyer, understandably, begins looking elsewhere for their next order. And the exporter’s name gets logged, quietly, permanently, into a heightened-surveillance category that means every future consignment from that facility gets pulled aside for extra scrutiny, whether or not anything is actually wrong with it.

This is the reality facing a growing number of Indian shrimp exporters right now. Search any industry forum, any trade bulletin, and the phrase shrimp export rejection antibiotic India shows up with uncomfortable regularity. The EU antibiotic residue shrimp India story isn’t a one-off scandal anymore, it’s becoming a structural risk baked into how international buyers evaluate Indian suppliers as a category.

The frustrating part is that this is almost entirely preventable. The regulatory bar hasn’t moved unpredictably; it has moved consistently, and in one direction, tighter. Detection technology has gotten more sensitive, traceability expectations have gotten stricter, and buyers in Brussels, Hamburg, and Seattle have gotten considerably less patient with “occasional” residue findings. Indian shrimp rejected EU market headlines aren’t going away until the industry’s underlying farm practices catch up to where detection science already is.

This guide is written for the people standing in that gap right now, farm managers, quality heads, and operators who need a clear-eyed look at what’s actually triggering rejections, and a realistic path toward antibiotic free shrimp export India status that doesn’t just chase compliance, but builds a genuinely more resilient operation underneath it.

The Compliance Landscape: What the EU and US FDA Are Actually Looking For

The Compliance Landscape: What the EU and US FDA Are Actually Looking For

It helps to understand that EU and US inspection regimes aren’t designed around catching exporters out, they’re designed around statistical assurance. Under the framework that traces back to EU Regulation EC 854/2004, the European Union requires that imported aquaculture products originate from a country with an approved residue monitoring system, not just an approved individual farm. That’s a crucial distinction. The EU isn’t only checking your shipment; it’s checking whether India’s entire control architecture, including the Export Inspection Council (EIC) National Residues Control Programme (NRCP), is functioning credibly enough to justify routine market access.

The US FDA approaches it from a different angle but lands in a similar place. US FDA HACCP import requirements obligate exporters to demonstrate documented, verifiable control points across the supply chain, not just clean test results at the end. A processor can have a pristine final-product report and still face import alerts if their Hazard Analysis and Critical Control Points documentation can’t show where contamination risk was actually managed upstream, at the farm and hatchery level.

What this means practically: a single residue violation rarely stays a single-shipment problem. It becomes evidence in a larger pattern that regulators use to decide whether an entire exporting region needs intensified, mandatory pre-export testing, the kind that slows every shipment, not just the flagged one.

The Blacklisted Substances: Why Nitrofurans and Chloramphenicol Are the Immediate Tripwires

The Blacklisted Substances: Why Nitrofurans and Chloramphenicol Are the Immediate Tripwires

Two categories of compounds account for a disproportionate share of Indian shrimp export rejection antibiotic India cases, and it’s worth understanding exactly why.

Nitrofurans and Their Persistent Metabolites

Nitrofurans (furazolidone, furaltadone, and related compounds) were once common in shrimp farming for controlling bacterial infections. The problem is that nitrofurans themselves break down quickly in tissue, but they leave behind stable metabolites, AOZ (from furazolidone) and AMOZ (from furaltadone), that persist in shrimp muscle tissue long after the parent compound is undetectable. Modern liquid chromatography-mass spectrometry (LC-MS/MS) testing doesn’t look for the drug; it looks for these metabolite “fingerprints,” and it finds them at extraordinarily low concentrations, often in the range of 0.3 to 1.0 parts per billion. At that sensitivity, there is effectively no margin for “a little bit” of legacy use anywhere in the supply chain.

Chloramphenicol: Zero Tolerance in Practice

Chloramphenicol is treated with similar severity. It’s banned outright in food-producing animals across both EU and US jurisdictions because of its association with serious human health risks, including aplastic anemia, even at trace exposure. Detection thresholds sit in a comparably narrow band, often identifiable down to roughly 0.1 to 0.3 parts per billion depending on the testing lab’s calibration.

The unforgiving part of both cases is that contamination doesn’t require deliberate misuse on the exporting farm. Antibiotic drift through shared water channels, contaminated seed stock from an unverified hatchery, or even residue carried in feed ingredients sourced from a supplier further up the chain can all introduce these compounds without the processing plant ever directly applying them.

Why Traditional Farm Management Fails Under Modern Scrutiny

Why Traditional Farm Management Fails Under Modern Scrutiny

Indian aquaculture’s traditional operating model evolved around reactive disease management, watch for signs of stress or mortality, then treat. That model made sense when testing technology lagged behind farm practice. It does not survive contact with current detection capability.

In farming clusters across Andhra Pradesh, Odisha, West Bengal, and Gujarat, several structural vulnerabilities keep resurfacing:

  • Fragmented seed sourcing, where post-larvae move through multiple unregulated hatcheries and aggregators before reaching a farm, making it nearly impossible to trace a single point of antibiotic exposure.
  • Shared water inlets and canal systems across clustered ponds, which means a single upstream farm’s chemical use can drift into a dozen “clean” downstream operations.
  • Informal feed and input suppliers, where formulations aren’t always fully disclosed, and antibiotic-laced growth promoters can enter a farm’s system without the farm manager’s direct knowledge.
  • Treat-first instincts under disease pressure, where the financial panic of a Vibrio outbreak or early mortality event pushes operators toward whatever was used successfully “last time,” regardless of withdrawal periods or residue persistence.

None of this reflects bad faith. It reflects an industry built for a different regulatory era, now operating inside one that has fundamentally changed its tolerance for ambiguity.

The Bioremediation Blueprint: Actionable Steps to Go Antibiotic-Free

Moving away from prophylactic antibiotic use isn’t about removing a tool and hoping disease pressure stays manageable. It’s about replacing reactive chemical control with a proactive biological system that prevents the conditions pathogens need to take hold in the first place.

Phase 1: Soil and Source Water Remediation Before Stocking

The work begins before a single post-larva enters the pond. Pond bottoms accumulate organic sludge, ammonical nitrogen, and sulfide compounds across grow-out cycles, creating exactly the anaerobic micro-pockets where pathogenic bacteria thrive. Pre-stocking bioremediation using targeted microbial inoculants breaks down this organic load and resets the pond’s baseline microbial balance, typically over a 10 to 14 day conditioning window before stocking begins.

Note: These are general values and operational outcomes will vary based on the specific pond ecosystem, initial microbial load, stocking density, and the unique design parameters of localized Effluent Treatment Plants (ETPs) or waste management setups.

Phase 2: Competitive Exclusion of Pathogens in the Water Column

Once stocked, the strategy shifts to maintaining dominance of beneficial bacterial populations over pathogenic ones, primarily species of Vibrio that cause early mortality syndrome and related outbreaks. Beneficial strains compete directly for nutrients and attachment sites, effectively crowding out pathogens rather than chemically eliminating them. Operations that maintain consistent probiotic dosing schedules through the water column report improving survival rates by roughly 20% to 35% compared to reactive-treatment-only ponds.

Note: These are general values and operational outcomes will vary based on the specific pond ecosystem, initial microbial load, stocking density, and the unique design parameters of localized Effluent Treatment Plants (ETPs) or waste management setups.

Phase 3: Strengthening Immune Response Through Gut Microflora Optimization

The final layer addresses the shrimp itself. A healthy, diverse gut microbiome improves feed conversion and strengthens natural immune response, reducing the animal’s vulnerability to opportunistic infection even under stress conditions like temperature swings or density crowding. This is where the entire rationale for “just in case” antibiotic dosing starts to dissolve, a shrimp with strong baseline immunity simply doesn’t present the same disease pressure that drove prophylactic use in the first place.

Introducing T1B™ Acqua S: Engineering Residue-Free Harvests

Introducing T1B™ Acqua S: Engineering Residue-Free Harvests

This is precisely the gap T1B™ Acqua S was engineered to close. Vannamei prawn farming thrives with T1B™ Acqua S, a high-performance probiotic formulation designed to enhance pond ecosystems naturally. This bio-accelerator, derived from natural vegetable sources through advanced fermentation technology, is rich in macro, micro, and secondary nutrients essential for aquatic life.

By promoting beneficial microbial growth, T1B™ Acqua S helps maintain water quality, reduces harmful compounds like ammonia and nitrites, and supports a balanced aquatic environment across all three phases above simultaneously. By maintaining a dominant, well-managed microbial population, it supports the natural competitive exclusion of pathogenic bacteria, including problem Vibrio strains, helping the pond ecosystem stay balanced from the floor up through the water column.

For an operator under pre-shipment testing pressure, this isn’t an incremental tweak. It’s a structural shift away from needing antibiotics in the rotation at all.

If your pond management is still reactive rather than preventive, the next disease cycle is not a matter of if, it’s when. The time to rebuild your biosecurity foundation is before your next stocking cycle begins, not after your next consignment gets flagged at a foreign port. Talk to Team One Biotech about a pond-specific Acqua S implementation plan before you stock again.

The Role of the EIC and MPEDA: Aligning Farm Audits With National Standards

India’s regulatory bodies aren’t adversaries in this process, they’re the structure that keeps Indian shrimp competitive in markets that could otherwise close entirely. The Export Inspection Council, through the National Residues Control Programme, sets the monitoring framework that EU authorities rely on to maintain India’s approved-exporter status at a country level. MPEDA guidelines complement this by setting farm-level traceability and registration standards intended to catch problems before they reach the processing plant, let alone the port.

Forward-looking operations are now treating these frameworks as a floor, not a ceiling, running internal audits that mirror NRCP sampling logic on their own ponds well ahead of any official testing cycle. This means:

  • Maintaining verified hatchery sourcing records for every stocking batch
  • Running internal residue screening at key growth intervals, not just pre-harvest
  • Documenting every chemical and biological input applied to a pond, including from third-party suppliers
  • Cross-training farm staff on withdrawal periods for any approved treatment that is used

Aligning internal practice with MPEDA and EIC expectations before an external audit ever happens is, in practical terms, the single highest-leverage compliance investment a mid-sized operation can make.

Antibiotic Reliance vs. Probiotic-Led Bioremediation: A Direct Comparison

FactorAntibiotic-Reliant ModelProbiotic-Led Bioremediation
Export compliance riskHigh — vulnerable to residue detection at parts-per-billion levelsLow — eliminates the source compounds entirely
Cost trajectoryLower upfront, but rises sharply with rejection/destruction riskModerate upfront investment, more predictable long-term
Pond ecosystem healthDegrades over repeated cycles; disrupts beneficial microbial balanceImproves cumulatively across cycles
Disease response styleReactive — treat after outbreak beginsPreventive — maintains conditions hostile to pathogens
Buyer relationship stabilityVulnerable to sudden blacklisting after a single violationBuilds long-term trust through consistent clean test history
Regulatory audit readinessRequires constant vigilance to avoid violationNaturally aligned with NRCP/MPEDA documentation expectations
Long-term sustainabilityRisk of resistant pathogen strains, declining pond productivitySupports stable, reusable pond ecosystems season over season

Turning Compliance Into Competitive Advantage

The exporters who treat residue compliance as a box-checking exercise will keep finding themselves on the wrong side of a rejection notice, because the global testing environment isn’t softening, it’s getting more precise, not less. But the exporters who treat it as an operational redesign opportunity are finding something unexpected: clean, traceable, antibiotic-free product is becoming a genuine market differentiator, not just a regulatory minimum. Buyers in the EU and US are increasingly willing to pay a premium for verified clean supply chains, precisely because so much of the market still can’t reliably offer one.

The choice facing every farm manager and processing quality head right now isn’t really about whether to comply. It’s about whether compliance becomes something done to your operation under pressure, or something built into it by design.

Secure Your Next Harvest Before You Need To

If your facility has faced a residue flag, an FDA import alert, or simply wants to get ahead of the next round of tightening EU inspection criteria, the conversation needs to start at the pond, not at the port. Team One Biotech works directly with export farm managers and processing plant quality heads across India’s coastal aquaculture clusters to run on-site biosecurity audits, map pond-specific bioremediation plans, and implement T1B™ Acqua S protocols built around your actual stocking density and water conditions, not generic recommendations.

Contact Team One Biotech today to schedule a biosecurity audit and build the kind of supply chain your next buyer won’t think twice about.

Looking to improve your ETP/STP efficiency with the right bioculture?
Talk to our experts at Team One Biotech for customised microbial solutions.

Contact+91 8855050575

Email:  sales@teamonebiotech.com

Visit: www.teamonebiotech.com

Discover More on YouTube – Watch our latest insights & innovations!-

Connect with Us on LinkedIn – Stay updated with expert content & trends!
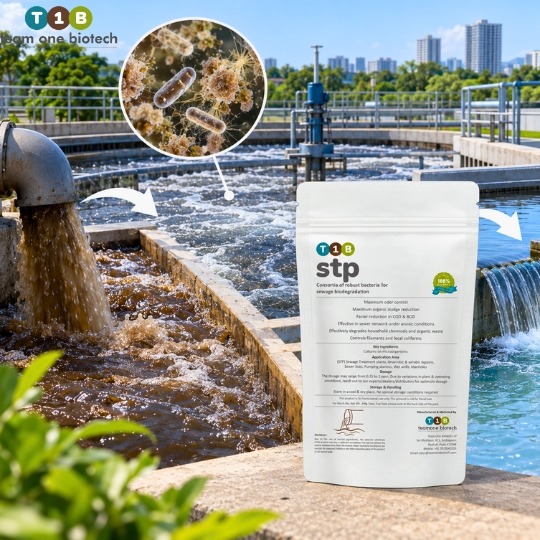
STP Plant Failing BOD/COD Tests, Causes and How to Get Back into Compliance Before Your Next Inspection

The lab report lands on your desk on a Tuesday morning, and within thirty seconds your stomach drops. BOD reading: out of range. COD: worse. And taped to your mental calendar is a date you cannot move, the State Pollution Control Board inspection, now less than two weeks away.

You already know what this means if the numbers don’t correct themselves. Closure notices. Penalty assessments that eat into budgets you’ve already spent. The very real possibility of explaining to your facility director, your tenants, or your corporate office why operations might grind to a halt. This is not an abstract compliance exercise. This is your plant, your job, and your facility’s reputation sitting on the line.

Take a breath. A failing STP report is a solvable engineering problem, not a verdict. But solving it requires understanding exactly why your biological treatment system stopped performing, and what to do about it before the inspector’s car pulls into your parking lot.

Why STP BOD COD Not Meeting Standards Is a Five-Alarm Problem

Why STP BOD COD Not Meeting Standards Is a Five-Alarm Problem

Under CPCB general standards for discharge into inland surface waters, treated effluent is expected to keep Biochemical Oxygen Demand within the 20 to 30 mg/L spectrum, with Chemical Oxygen Demand levels safely below the 200 to 250 mg/L threshold, depending on your specific consent conditions and state-level variations.

Note: These are general values and operational outcomes will vary based on the specific design, hydraulic load, and unique configuration parameters of individual Sewage and Effluent Treatment Plants (STPs/ETPs).

These aren’t arbitrary numbers bureaucrats picked to make your life difficult. BOD and COD are direct proxies for how much organic and chemical load your treated water is still carrying when it leaves your premises. When those numbers spike, it tells the SPCB, and anyone downstream of your discharge point, that your biological treatment process broke down somewhere along the line.

The legal exposure here is immediate, not theoretical. A failed consent renewal, a show-cause notice, or in repeat-offense scenarios, a closure direction under the Water (Prevention and Control of Pollution) Act. For commercial complexes, hospitals, and industrial campuses, this can mean disrupted operations, stalled occupancy certificates, and damage to relationships with regulators that takes years to repair.

The Diagnostics Room: Three Reasons Your STP Is Failing

The Diagnostics Room: Three Reasons Your STP Is Failing

Most BOD/COD failures trace back to one of three root causes. Rarely is it just one in isolation.

Aeration System Bottlenecks

Your biological treatment process depends entirely on aerobic bacteria having enough dissolved oxygen to metabolize organic matter. When DO levels drop, typically falling below a working range of 2 to 4 mg/L in the aeration tank, those bacteria slow down or stop breaking down waste entirely.

Note: These are general values and operational outcomes will vary based on the specific design, hydraulic load, and unique configuration parameters of individual Sewage and Effluent Treatment Plants (STPs/ETPs).

Common culprits include clogged or worn-out diffusers, undersized blowers struggling against actual hydraulic load, and fouled membrane discs that can no longer transfer oxygen efficiently into the liquid. In many Indian installations, aeration equipment runs continuously for years with minimal preventive maintenance, and by the time anyone notices reduced output, the biomass has already been gasping for weeks.

Sludge Health and MLSS Imbalances

Mixed Liquor Suspended Solids represent your active biological workforce. When MLSS concentrations drift too far outside an optimal working band, often somewhere between 2,000 and 3,500 mg/L depending on process design, you get either an underfed, struggling biomass or an overloaded system that simply cannot keep pace with incoming waste.

Note: These are general values and operational outcomes will vary based on the specific design, hydraulic load, and unique configuration parameters of individual Sewage and Effluent Treatment Plants (STPs/ETPs).

Poor sludge settling in the secondary clarifier is the visible symptom here. If sludge volume index climbs and your settled sludge becomes light, fluffy, or prone to floating, biomass washes out with your final effluent, taking your treatment capacity with it.

Microbial Shock and Toxicity Events

This is the silent killer of STP performance, and it is brutally common across Indian commercial and institutional facilities. Housekeeping staff or contracted cleaning crews pour concentrated disinfectants, acidic descalers, or bleach-heavy formulations down floor drains and washroom outlets, with zero awareness that this drainage eventually reaches the STP’s biological tanks.

A sudden toxic or pH shock load can kill off a meaningful percentage of your active microbial population within hours. Once that biomass dies, BOD and COD removal efficiency collapses, and recovery without intervention can stretch across several weeks of natural regrowth, a timeline most facilities facing an imminent inspection simply do not have.

Note: These are general values and operational outcomes will vary based on the specific design, hydraulic load, and unique configuration parameters of individual Sewage and Effluent Treatment Plants (STPs/ETPs).

The Rapid Troubleshooting Matrix

SymptomRoot CauseImmediate Corrective Action
Low DO readings, foul odor near aeration tankAeration bottleneck, fouled diffusers, undersized blowerInspect and clean diffusers, verify blower capacity against actual flow, check for air leaks in distribution piping
Cloudy or turbid final effluentPoor sludge settling, biomass washoutCheck sludge volume index, reduce wasting rate temporarily, inspect clarifier weirs for uneven flow
Sudden spike in BOD/COD after a specific dateToxic or chemical shock loadTrace drainage source, halt harsh chemical disposal into STP-connected drains, initiate bio-augmentation dosing
Floating or rising sludge in clarifierDenitrification gas formation, septic conditions upstreamIncrease sludge wasting frequency, verify adequate DO is maintained throughout aeration cycle
Persistent high COD despite normal BODNon-biodegradable chemical contaminationInvestigate industrial or cleaning chemical inputs, consider pretreatment or source segregation
Inconsistent readings across daysPower fluctuation disrupting continuous aerationInstall or test backup power continuity for blowers, log aeration downtime against lab result timing

The India Factor: Monsoon Surges, Heat, and Power Realities

The India Factor: Monsoon Surges, Heat, and Power Realities

Indian STPs face structural stressors that textbook treatment models rarely account for. Summer ambient temperatures pushing tank water well above comfortable biological operating ranges accelerate oxygen depletion, since warmer water holds measurably less dissolved oxygen even as microbial metabolic demand increases.

Monsoon season brings the opposite challenge: sudden hydraulic shock loads as stormwater infiltrates aging sewer networks, diluting influent in some cases while overwhelming hydraulic retention time in others. Your biomass simply doesn’t get adequate contact time with incoming waste, and treatment efficiency drops accordingly.

Then there is the power supply question that every Indian facility manager knows intimately. Erratic grid supply causing intermittent aeration blower shutdowns, even gaps lasting a relatively short window, can meaningfully depress DO levels and stress your biological culture, especially if outages cluster during peak loading hours.

The Emergency Revival Plan: How to Improve STP Effluent Quality Fast

The Emergency Revival Plan: How to Improve STP Effluent Quality Fast

When your inspection window is measured in days rather than months, here is the tactical sequence that delivers the fastest, most reliable BOD COD reduction sewage treatment plant performance recovery.

Step One: Stabilize aeration immediately. Verify blower runtime, clean accessible diffusers, and confirm DO readings across multiple points in the aeration tank, not just one probe location.

Step Two: Audit sludge wasting and return rates. Adjust your return activated sludge ratio to bring MLSS back toward an optimal working range, and reduce excessive wasting that may be depleting your biological workforce.

Step Three: Trace and eliminate toxic inputs. Walk the drainage network, talk to housekeeping supervisors, and identify any recent change in cleaning chemical usage or disposal practice.

Step Four: Deploy bio-augmentation immediately. This is the single most effective lever available when your biomass has been compromised and you do not have weeks to wait for natural regrowth. Seeding your system with advanced, targeted microbial cultures, specifically engineered consortiums designed for rapid acclimatization, can jumpstart organic load breakdown far faster than waiting on the native population to recover on its own.

Note: These are general values and operational outcomes will vary based on the specific design, hydraulic load, and unique configuration parameters of individual Sewage and Effluent Treatment Plants (STPs/ETPs).

Step Five: Increase monitoring frequency. Daily DO and pH checks, not weekly, until your numbers stabilize comfortably within target range across multiple consecutive readings.

From Reactive Crisis to Proactive Compliance

Here is the uncomfortable truth most facility managers eventually face: a plant that only gets attention during a crisis will keep generating crises. Emergency interventions buy you time for this inspection, but they don’t fix the underlying operational gaps that caused the failure in the first place.

Structured bioremediation, paired with a maintenance calendar that accounts for seasonal stressors, power reliability, and chemical handling protocols, transforms your STP from a recurring liability into a system you can actually trust. Permanent compliance isn’t about heroics before every inspection. It’s about building a biological process resilient enough that the inspection becomes a formality rather than a threat.

Don’t Wait for the Inspector to Walk In

If your STP is failing BOD/COD tests right now, every day that passes without corrective action narrows your options and raises your risk. Team One Biotech specializes in exactly this scenario: rapid-response biological health audits, emergency microbial dosing strategies, and engineered bio-augmentation cultures built to revive a struggling plant under real deadline pressure.

Every hour you spend deliberating is an hour your biomass continues to struggle and your inspection date continues to approach. The plants that pass their next SPCB review aren’t the ones that waited for a miracle, they’re the ones that brought in the right diagnostic and microbial expertise the moment the lab report came back red. Contact Team One Biotech now for an emergency STP compliance audit and let our team assess your specific aeration, sludge, and biological health parameters before your deadline arrives, not after. Compliance is still within reach, but only if you act on it today. 

Reach out to Team One Biotech today for an immediate STP biological health audit. Your inspection date isn’t moving. Your compliance status still can.

Looking to improve your ETP/STP efficiency with the right bioculture?
Talk to our experts at Team One Biotech for customised microbial solutions.

Contact+91 8855050575

Email:  sales@teamonebiotech.com

Visit: www.teamonebiotech.com

Discover More on YouTube – Watch our latest insights & innovations!-

Connect with Us on LinkedIn – Stay updated with expert content & trends!
Improving Wheat Yield with PGPR: Field Application Guide for Rabi Season

Every October, as soil temperatures dip across the Indo-Gangetic plains and tractors start turning the post-paddy stubble, a quiet dread settles over wheat-farming communities from Ludhiana to Lucknow. The costs are already locked in before a single seed goes into the ground. DAP prices have climbed steadily. Urea allocations remain unpredictable. And the soil itself, compacted by years of heavy combine harvester traffic and drenched in synthetic chemistry, is beginning to push back. Yields are plateauing even when inputs increase.

This is the Rabi tightrope. Push harder on chemicals, and you erode the very biological foundation that makes productive farming possible. Pull back, and you risk yield losses you cannot afford.

The conversation in progressive farming circles, among sharp crop consultants and forward-thinking agri-input dealers, has been shifting toward a more intelligent approach: restoring the biological workforce that already exists in the soil. This is exactly where a high-quality biofertilizer for wheat enters the picture, specifically, formulations built around PGPR, or Plant Growth-Promoting Rhizobacteria.

These are not trendy supplements. PGPR are a scientifically validated group of soil bacteria that have co-evolved with cereal crops for millennia. When reintroduced into degraded soils at meaningful concentrations, they fundamentally change how a wheat plant feeds, roots, and responds to stress.

The Rhizosphere: Where the Real Farming Happens

The Rhizosphere: Where the Real Farming Happens

Most agronomic attention is focused above the soil line, canopy color, tiller count, flag leaf health. But the most consequential activity in wheat production happens invisibly, in the narrow cylinder of soil surrounding every root hair. This is the rhizosphere, and it is where PGPR earn their value.

Here is what is actually happening when healthy PGPR populations are active in your wheat field:

Phosphorus Solubilization A staggering proportion of the phosphorus applied to Indian wheat fields over decades is not available to the plant. It has been fixed, chemically locked, into insoluble compounds with calcium, iron, and aluminum. Phosphate-solubilizing bacteria within PGPR consortia secrete organic acids, primarily gluconic and citric acids, that break these bonds and release the phosphorus back into plant-available form. This is not just supplementation. It is remediation of your existing soil chemistry.

Nitrogen Fixation and Cycling Certain PGPR strains, particularly free-living Azospirillum and Azotobacter species, fix atmospheric nitrogen directly in the root zone, making it available to the wheat plant without the energy cost of synthetic urea. This is agricultural bioremediation India’s degraded soils desperately need, reactivating biological nutrient cycles that intensive monoculture has suppressed.

Phytohormone Secretion and Wheat Root Development This is the mechanism that most surprises farmers when they first see it in action. PGPR strains produce indole-3-acetic acid (IAA), a plant hormone that directly stimulates root elongation and lateral root branching. The result is a measurably denser root system that accesses moisture and nutrients from a larger soil volume. In the context of moisture stress during late-season heatwaves, a growing concern across MP and UP wheat belts, improved wheat root development may be one of the most valuable outcomes of PGPR application.

Stress Resilience Compounds Under heat stress and drought conditions, PGPR-inoculated plants have demonstrated a greater capacity to maintain cell membrane integrity and regulate water loss. The bacteria trigger the plant’s own stress-response pathways, essentially preparing it for adversity before adversity arrives.

Step-by-Step PGPR Application Guide for Rabi Wheat

Successful PGPR application for wheat is not complicated, but sequencing and handling protocols matter enormously. Live bacterial populations are sensitive. Here is how to ensure maximum field efficacy.

Phase 1, Seed Treatment (Inoculation Before Sowing)

This is the most critical and cost-efficient application window. Coating the seed ensures the PGPR bacteria are positioned precisely where the emerging root system will develop.

  • Spread the required quantity of wheat seed on a clean, shaded surface. Avoid direct sunlight and any residual chemical contamination on the surface.
  • Mix the PGPR formulation with a small quantity of jaggery solution or rice starch paste to act as a sticking agent.
  • Apply the slurry evenly to the seed, ensuring complete coating, then allow to air-dry in shade for 20 to 30 minutes before sowing.
  • Typical seed treatment rates for PGPR liquid formulations fall in the range of around 200 to 500 grams or milliliters per acre, depending on product concentration and target bacterial load. Note: These are general values and field outcomes will vary based on specific soil health profiles, existing microbial load, climate conditions, and unique irrigation parameters of individual farm plots.
  • Never mix PGPR seed treatment with chemical fungicide seed treatments in the same slurry. If a chemical seed treatment is agronomically necessary, apply it first, allow it to dry completely, and then apply the PGPR coating separately.

Phase 2, Soil Application During Field Preparation or First Irrigation

A secondary soil-drench application, especially at or just after the first irrigation (crown root initiation stage), reinforces the rhizosphere population and compensates for any seed-treatment losses during germination.

  • Mix the PGPR soil application product with a carrier material, well-decomposed farmyard manure or vermicompost works exceptionally well, and broadcast uniformly before the pre-sowing irrigation or the first post-sowing watering.
  • In fields with severe post-paddy soil compaction, pairing PGPR application with a light soil aeration pass significantly improves bacterial penetration and colonization depth.
  • For best results in improving soil microbial health over the season, this phase should ideally happen within 15 to 20 days of sowing. Note: These are general values and field outcomes will vary based on specific soil health profiles, existing microbial load, climate conditions, and unique irrigation parameters of individual farm plots.

Phase 3, Fertigation Considerations for Irrigated Wheat

For farms operating drip or sprinkler systems, increasingly common in progressive wheat operations across Haryana and parts of MP, PGPR fertigation is a viable third application window.

  • Use only specifically formulated liquid PGPR products rated for fertigation compatibility. Wettable powder formulations may clog emitters.
  • Apply through fertigation at the jointing stage, when tiller formation and root system expansion are at their peak demand for nutrients.
  • Coordinate fertigation timing to avoid peak-heat hours. Early morning application preserves bacterial viability in the irrigation lines.

Why This Matters for Agri-Dealers: The ROI Conversation

Why This Matters for Agri-Dealers: The ROI Conversation

For agri-input dealers recommending PGPR application for wheat to their farmer networks, the conversation cannot stay purely biological. It has to be economic.

Here is the frame that resonates with progressive farmers: PGPR bio-inputs do not replace chemical fertilizers in one season. They progressively reduce the threshold at which chemical inputs become necessary. Fields that have seen consistent PGPR use over two to three Rabi cycles typically show measurably improved organic carbon levels, better water-holding capacity, and reduced compaction, which means DAP and urea requirements can be recalibrated downward without sacrificing yield stability.

Yield improvements in PGPR-integrated Rabi crop bio-inputs programs often range between 10% to 18% over untreated controls, particularly in fields with documented phosphorus fixation problems and low organic carbon. Note: These are general values and field outcomes will vary based on specific soil health profiles, existing microbial load, climate conditions, and unique irrigation parameters of individual farm plots.

For a dealer, this is a product that sells itself on demonstrable field results within a single season, and then retains customers through a multi-season soil improvement story.

If you are an agri-input dealer looking to add a scientifically credible, high-margin bio-input line to your portfolio for the Rabi season, connect with Team One Biotech now to discuss dealership pricing, demo product allocation, and technical training support.

Addressing the Indian Soil Crisis Directly

Addressing the Indian Soil Crisis Directly

Let us be frank about what decades of intensive wheat-rice rotation have done to the soils of Punjab, Haryana, and western UP. Soil organic carbon levels across large stretches of the Indo-Gangetic plains have dropped to a fraction of what healthy agricultural soil requires. The native microbial populations, the bacteria, fungi, and actinomycetes that once made these soils among the most productive in the world, have been systematically suppressed by the cumulative antibiotic effect of synthetic pesticide and herbicide regimens.

Agricultural bioremediation in India’s wheat belt is not an abstract concept. It is the practical work of rebuilding microbial biomass, restoring biological nutrient cycling, and reducing the soil’s dependency on external chemical inputs. PGPR-based Rabi crop bio-inputs are among the most direct and field-validated tools available for this work.

The farmers who are already doing this, and there are thousands across MP, UP, and Haryana running multi-year bio-input trials, are not doing it out of ideology. They are doing it because their per-acre input costs are coming down while their grain quality scores are improving. Wheat grain protein content, a key determinant of market price in quality-premium procurement systems, consistently trends upward in PGPR-integrated cropping programs.

Conclusion: The Biological Dividend of the Rabi Season

Indian wheat farming is entering a period of genuine reckoning. Soil degradation, input cost inflation, and shifting weather patterns during the grain-filling stage are not seasonal problems. They are structural ones, and they demand structural solutions.

PGPR-based biofertilizer for wheat is not a silver bullet. It is something more durable, a biological investment that pays compound returns across seasons, progressively reducing your exposure to input cost volatility while rebuilding the soil capital that determines the long-term productivity of your land.

The science is solid. The application protocol is straightforward. The economics are favorable. What remains is the decision to act, before the sowing window opens and the season’s outcome is already half-determined.

Connect with Team One Biotech, Before the Season Closes

Whether you are a progressive farmer scouting for a science-backed approach to this Rabi season, a crop consultant building a bio-input recommendation program for your clients, or an agri-input dealer ready to expand into high-performance biological products, Team One Biotech is your technical and supply partner.

Reach out to Team One Biotech today for bulk product scheduling, field trial support, agronomist consultations, and dealer partnership programs tailored for the Rabi wheat-growing belt. Our team works directly with farmers and dealers at the field level, not just from a catalog.

The soil is ready to work with you again. Give it the biological foundation it needs.

Looking to improve your ETP/STP efficiency with the right bioculture?
Talk to our experts at Team One Biotech for customised microbial solutions.

Contact+91 8855050575

Email:  sales@teamonebiotech.com

Visit: www.teamonebiotech.com

Discover More on YouTube – Watch our latest insights & innovations!-

Connect with Us on LinkedIn – Stay updated with expert content & trends!
Biofertilizers for Rice Cultivation: How Nitrogen-Fixing Bacteria Reduce Urea Costs

Ask any paddy farmer in Punjab or Andhra Pradesh what keeps them up at night, and the answer rarely changes: input costs that climb every season while farm-gate prices refuse to keep pace. The price of a 45 kg bag of urea has risen consistently over the past decade, and farmers, particularly those growing premium Basmati or high-value non-Basmati varieties, are quietly absorbing losses that never appear on any government report.

The cruel irony of urea dependency is this: the more you apply, the less it seems to work. Farmers who once got a visible response from a single top-dressing now find themselves applying two or three rounds just to maintain the same tiller count or canopy colour. Soils that were once dark, crumbly, and alive with microbial activity have gradually turned hard, pale, and exhausted. 

Yet the compulsion to keep applying chemical nitrogen continues because the biological alternatives were never explained clearly enough, or trusted enough, to replace it.

This is precisely the gap that biofertilizer for rice is built to close, not as a replacement for all agronomic inputs overnight, but as an intelligent, science-backed system that allows progressive farmers to partially restore soil biology, reduce their chemical fertilizer burden, and protect their margins in a way that compounds over seasons.

The Hidden Damage of Urea Over-Application

The Hidden Damage of Urea Over-Application

Urea is not inherently a villain. Applied correctly, in balanced ratios alongside phosphorus and potassium, it does what it is supposed to do. The problem lies in how it is actually used across major rice-growing belts in India.

Data from multiple state agricultural departments consistently shows that the NPK application ratio in high-intensity paddy states like Punjab, Haryana, and Uttar Pradesh is severely skewed in favour of nitrogen. Instead of the ideal 4:2:1 NPK ratio recommended for rice, many fields receive ratios closer to 10:2:1 or worse. This nitrogen overload creates a cascade of problems:

  • Soil acidification that suppresses beneficial microbial populations
  • Soil compaction from the breakdown of organic matter structure under chemical loading
  • Phosphorus and zinc lockup, where these nutrients are chemically bound and unavailable to the plant even when present in the soil
  • Nitrate leaching into groundwater, with environmental consequences that are increasingly difficult to ignore
  • Yield plateau or stagnation, where incremental increases in urea application no longer produce incremental increases in yield

In West Bengal and Andhra Pradesh’s deltaic rice zones, the problem takes a different form, waterlogged soils with already-fragile microbial counts are further depleted by chemical overloading, making each successive crop more expensive to protect. Farmers are effectively running faster just to stay in place.

How Biofertilizers for Rice Work Under the Surface

How Biofertilizers for Rice Work Under the Surface

The concept behind a quality liquid biofertilizer for paddy is straightforward, even if the biology operating beneath the soil is quietly complex.

Certain strains of bacteria, particularly Azospirillum and phosphate-solubilizing organisms like Phosphobacter, have developed a remarkable ability to perform critical nutrient cycling functions that chemical fertilizers simply cannot replicate.

Nitrogen Fixation: The Underground Factory

Azospirillum for rice is perhaps the most practically important bacterial group in this conversation. These free-living, associative nitrogen-fixing bacteria colonize the root zone of the rice plant and fix atmospheric nitrogen, which is abundantly available in the air above every field, converting it into ammoniacal nitrogen that is directly absorbable by the plant root system.

The atmosphere above one acre of land contains millions of kilograms of nitrogen in its inert gaseous form. Azospirillum strains essentially unlock this resource, acting as a continuous, low-cost nitrogen delivery mechanism operating from within the soil itself.

Phosphate Solubilization: Unlocking Trapped Wealth

Most Indian soils, particularly those under long-term intensive cultivation, are not actually deficient in phosphorus. They are deficient in available phosphorus. Years of chemical application have left vast reserves of fixed, insoluble phosphorus compounds in the soil, nutrients that are chemically present but biologically locked away.

Phosphobacter strains produce organic acids that dissolve these fixed compounds, releasing phosphorus into plant-available forms. Farmers who begin using these bio-inputs often notice that their phosphatic fertilizer requirement decreases gradually over two to three seasons, even as plant phosphorus nutrition improves.

Together, these microbial groups function as a 24/7 underground nutrient management system, reducing the farmer’s dependence on purchased chemical inputs while actively improving soil health over time.

The Economics of Shifting to Bio-Inputs

The Economics of Shifting to Bio-Inputs

This is where abstract biology becomes compelling financial reality for the paddy farmer.

A typical progressive farmer growing premium Basmati in Haryana or Pusa 44 in Uttar Pradesh currently spends a significant share of their input budget on chemical nitrogen fertilizers across the kharif cycle. Integrating a quality biofertilizer programme does not eliminate this expense overnight. What it does is allow a structured, partial replacement of chemical urea that becomes more effective as soil biology recovers over seasons.

In practical terms, farmers integrating biofertilizers alongside a reduced chemical fertilizer programme have reported:

  • A reduction in urea consumption of roughly 20% to 35% per acre in the first full season of adoption
  • Consequent input cost savings in the range of ₹1,500 to ₹3,500 per acre per crop cycle, depending on the baseline chemical programme and current urea pricing
  • Improved soil moisture retention and root architecture, which supports yield stability especially during dry spells between irrigation cycles
  • Gradual improvement in soil organic carbon, which begins to show yield dividends from the second or third season onward

Note: These are general values and actual field outcomes will vary based on specific soil profiles, regional climatic conditions, water management practices, and individual field parameters.

If you are a progressive paddy farmer and want to understand exactly how much your farm can save based on your specific input programme, Team One Biotech offers customized soil health consultations. Reach out to our agronomic support team to schedule an on-field assessment before your next kharif season begins.

A Clear Breakdown for Agri-Dealers and Distributors

The shift toward biologicals is not a passing trend in Indian agriculture, it is a structural, policy-driven, and agronomically validated transition that is already reshaping the input market across progressive farming districts.

For regional dealers and distributors, stocking a credible range of biofertilizers represents a significant revenue opportunity for several reasons:

  • Growing farmer demand: Progressive farmers, particularly those selling into export or premium domestic markets, are actively seeking alternatives to reduce chemical dependency and improve produce quality metrics
  • Government push: State and central schemes promoting bio-inputs, including subsidized distribution in several states, are creating policy tailwinds that support adoption
  • Repeat purchase cycles: Unlike one-time machinery investments, biofertilizers generate season-on-season purchase behaviour, building a reliable recurring revenue stream
  • Differentiation from commodity dealers: Dealers who can explain the agronomic rationale behind biologicals, and back it up with field data from their own geography, build the kind of farmer trust that is nearly impossible for online-only competitors to replicate

Agri-dealers and distributors: Team One Biotech is currently onboarding regional distribution partners ahead of the upcoming kharif season. Contact our commercial team to discuss bulk stocking arrangements, product demonstrations, and farmer training support for your territory.

Chemical vs. Bio-Input Management: A Practical Comparison

ParameterChemical Urea (Conventional)Biofertilizer Programme (Integrated)
Application MethodTop-dressing or basal broadcastingSeed treatment, root dipping, or soil application
Nutrient AvailabilityImmediate but short-lived pulseGradual, sustained release over crop cycle
Soil Microbial ImpactSuppresses native microbial populations over timeRestores and amplifies soil microbial diversity
Environmental Runoff RiskHigh, nitrate leaching into waterwaysLow, fixes atmospheric nitrogen in situ
Cost Per Acre (Seasonal)Higher baseline, increases with soil degradationLower over time as soil health improves
Long-Term Yield TrendPlateau or decline without dose escalationStable to improving as soil biology recovers
Residual Soil BenefitMinimal, next crop starts at same baselinePositive carry-over into subsequent seasons

Best Practices for Indian Paddy Fields

Best Practices for Indian Paddy Fields

Integrating a biofertilizer programme into your paddy cultivation does not require complex changes to your existing field operations. The following practices are the most commonly adopted across Indian rice-growing conditions:

Seed Treatment (Pre-Sowing) Coat paddy seeds with a slurry of liquid biofertilizer containing Azospirillum strains before sowing. Allow the coating to dry in shade before sowing. This establishes the beneficial bacterial population at the earliest possible stage of plant development.

Seedling Root Dipping (For Transplanted Paddy) For farmers following the transplanting method, common across West Bengal, Andhra Pradesh, and parts of Uttar Pradesh, dipping seedling roots in a diluted biofertilizer solution for 20 to 30 minutes before transplanting ensures early root zone colonization. This is one of the most cost-effective application methods available.

Main Field Soil Application (For fields with severely depleted microbial counts), a direct soil drench application of liquid biofertilizer after primary tillage helps establish a viable microbial population in the rhizosphere before the crop establishes.

Integration with Reduced Chemical Programme Always integrate bio-inputs as part of a balanced reduction strategy, not a complete elimination of chemical fertilizers. The recommended approach is to reduce your chemical nitrogen application by roughly 20% to 25% in the first season while maintaining full phosphorus and potassium inputs. Monitor plant canopy colour and tiller development. Adjust in subsequent seasons based on observed crop response.

Note: These are general values and actual field outcomes will vary based on specific soil profiles, regional climatic conditions, water management practices, and individual field parameters.

Securing the Future of Indian Paddy Farming

The most resilient agricultural systems in the world are not built on any single input or technology. They are built on the intelligent integration of what science makes available with what farmers know from generations of cultivating the same land.

Indian paddy farming sits at an inflection point. The economics of urea-intensive cultivation are increasingly difficult to defend. The soil science behind nitrogen-fixing and phosphate-solubilizing bacteria is mature, well-documented, and practically deployable at the farm level today. The regulatory and market environment is actively supportive of the transition to sustainable paddy farming.

What remains is the bridge, between laboratory efficacy and field reality, between agronomic recommendation and farmer trust, between the promise of soil health improvement and the actual seasonal savings that show up in a farm’s input ledger.

Team One Biotech’s biofertilizer programme for rice is designed to be that bridge.

Take the Next Step With Team One Biotech

For progressive farmers: If you are cultivating premium Basmati, Pusa, or high-value non-Basmati varieties and want to reduce your urea dependency while protecting yield quality, connect with our agronomic team for a field-specific bio-input consultation. We will assess your soil baseline, current input programme, and recommend an integrated plan tailored to your land.

For agri-dealers and regional distributors: The kharif window for biologicals is short. Dealers who stock early, train their teams on the science, and support farmer adoption in their territory will lead this market in their district. Reach out to Team One Biotech’s commercial partnerships team today to discuss product range, pricing, margin structure, and farmer demonstration support.

Contact Team One Biotech to begin building a more profitable, more resilient paddy farming future, for your fields, for your customers, and for Indian agriculture.

Looking to improve your ETP/STP efficiency with the right bioculture?
Talk to our experts at Team One Biotech for customised microbial solutions.

Contact+91 8855050575

Email:  sales@teamonebiotech.com

Visit: www.teamonebiotech.com

Discover More on YouTube – Watch our latest insights & innovations!-

Connect with Us on LinkedIn – Stay updated with expert content & trends!
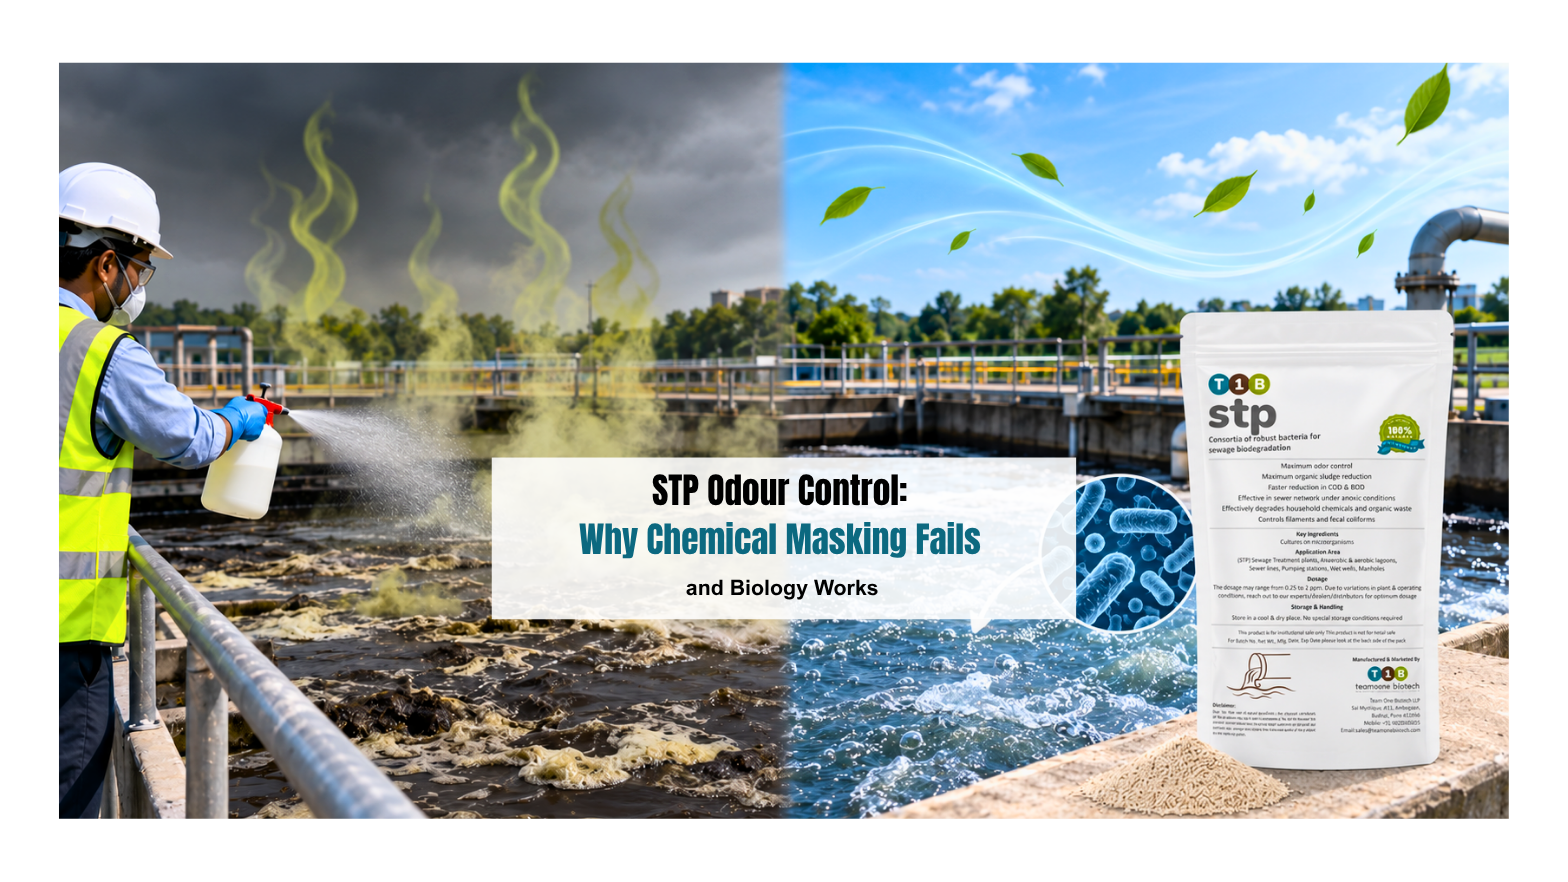
Biofloc vs. Traditional Pond: Which Aquaculture System Gives Better ROI in India?

It is 2 AM. Your farm manager calls. A dissolved oxygen crash has been silently unfolding in your grow-out pond for the past three hours. By morning, you are looking at a partial or total crop loss, weeks of feed investment, fingerling costs, labor, and electricity expenditure wiped out before sunrise. If you farm commercially in India, this scenario is not hypothetical. It is a recurring nightmare that has ended the profitability of operations far larger than yours.

This is the defining tension in modern Indian aquaculture: the gap between what a system promises on paper and what it actually delivers when monsoon salinity shifts, summer temperatures spike, or a Vibrio outbreak moves silently through an unmanaged pond bottom. The choice between a biofloc system vs traditional pond is not merely a technical preference, it is a capital allocation decision with direct consequences on your farm’s survival and long-term ROI.

Let us break both systems down, honestly, with the operational granularity that Indian commercial fish farming demands.

Decoding the Traditional Pond Model

Decoding the Traditional Pond Model

For decades, the earthen pond has been the backbone of commercial fish farming in India, from IMC culture in West Bengal and Odisha to Pangasius grow-out operations in Andhra Pradesh. Its appeal is straightforward: relatively low upfront infrastructure cost, familiarity, and the capacity to leverage existing land parcels.

But the traditional pond model carries structural vulnerabilities that are becoming harder to ignore at commercial scale.

The Land and Water Equation

The Land and Water Equation

Traditional pond systems operate at comparatively low stocking densities to manage nitrogen loading, which means significant land area is required to generate commercially viable biomass. As land values rise across coastal Andhra Pradesh, Kerala, and West Bengal’s aquaculture belts, and as groundwater tables fall in states like Gujarat and Karnataka due to seasonal depletion and over-extraction, the cost base of the traditional model is quietly inflating.

Water exchange, the traditional pond’s primary water quality management tool, becomes problematic in regions facing regulatory scrutiny on effluent discharge and in areas where freshwater access is constrained during lean seasons.

The Bottom Sludge Problem

Organic sludge accumulation on pond bottoms is one of the most underestimated threats in traditional aquaculture. In high-temperature Indian summers, accumulated sludge becomes an active site of anaerobic decomposition, producing hydrogen sulphide, triggering ammonia spikes, and creating hypoxic zones that stress or kill bottom-feeding species. Pond bioremediation using specialized microbial consortia is now considered a non-negotiable operational input in well-managed traditional systems, not an optional supplement.

If your traditional ponds are showing early signs of bottom sludge stress, foul odor, surface scum, erratic dissolved oxygen patterns, Team One Biotech’s pond bioremediation protocols are designed specifically for Indian summer and monsoon conditions. Contact us for a water quality audit tailored to your farm.

The Biofloc Paradigm Shift

The Biofloc Paradigm Shift

Biofloc technology (BFT) represents a fundamentally different philosophy of aquaculture water quality management. Instead of diluting nitrogenous waste through water exchange, biofloc systems engineer a controlled microbial ecosystem within the culture tank itself.

By maintaining a precise carbon-to-nitrogen (C:N) ratio, typically achieved by adding carbon sources like molasses or tapioca, heterotrophic bacteria assimilate toxic ammonia and nitrite into microbial biomass. This biomass forms visible aggregates, the “floc”, which aquatic species actively consume, effectively turning waste conversion into a secondary protein feed source.

The implications for high-density fish farming are significant: ammonia stays below toxic thresholds without water exchange, stocking densities can be pushed substantially higher than traditional ponds allow, and the system essentially recycles its own nutrient load.

The challenge, however, is that this microbial equilibrium is not self-sustaining. It demands continuous mechanical aeration, consistent monitoring, and, critically, the right microbial inoculants to establish and maintain floc quality.

The Ultimate ROI Showdown

CapEx and OpEx Breakdown

Traditional Pond:

  • Lower initial construction cost per unit area
  • Significant land acquisition cost in established aquaculture zones
  • Lower power consumption, but high water procurement costs in drought-prone regions
  • Periodic pond preparation (liming, drying, tilling) adds to per-cycle operational costs

Biofloc System:

  • Higher CapEx: lined tanks or lined ponds, aeration grid infrastructure, power backup (generator or inverter) are non-negotiable
  • Electricity costs represent a substantial and continuous OpEx component, a material concern given India’s variable industrial power tariffs
  • Lower water consumption and near-zero water exchange once the system stabilizes
  • Bio-input costs (carbon sources, probiotics, mineral supplements) are recurring but predictable

Note: These figures represent general industry ranges; operational and financial outcomes will vary depending on local water parameters, species selection, feed management, and individual farm design.

Feed Conversion Ratio and Survival Rates

In biofloc systems, the live microbial floc consumed by fish and shrimp contributes meaningfully to daily protein intake, which in well-managed systems translates to an FCR improvement within a range that meaningfully reduces feed expenditure per kilogram of biomass produced. For species like Vannamei and Tilapia, FCR ranges in optimized biofloc systems tend to fall at the lower end of what is achievable in traditional pond culture.

Survival rates in biofloc systems, when managed correctly, benefit from the reduced pathogen load, controlled environment, and superior water quality. In traditional ponds, survival is more directly correlated with seasonal variability, monsoon-driven water quality fluctuations, and the efficacy of the pond bioremediation strategy employed.

The feed savings potential of biofloc technology is real, but only when the microbial foundation is correctly established and maintained. Team One Biotech’s T1B™ Bio Floc is engineered precisely for this. Ask our specialists how it integrates into your planned biofloc setup.

Note: These figures represent general industry ranges; operational and financial outcomes will vary depending on local water parameters, species selection, feed management, and individual farm design.

Head-to-Head Comparison: Biofloc vs Traditional Pond

ParameterBiofloc SystemTraditional Pond
Land RequirementLow to moderate (high-density tanks)High (extensive land area)
Stocking Density RangeHigh to very highLow to moderate
Water Exchange FrequencyNear zero to minimalFrequent (routine management tool)
Ammonia ManagementMicrobial assimilation (C:N control)Dilution via water exchange + bioremediation
Biosecurity ControlHigh (enclosed, controlled environment)Moderate to low (open, weather-dependent)
Power DependencyVery high (continuous aeration critical)Low to moderate
Sludge/Effluent RiskModerate (concentrated, managed discharge at harvest)High (diffuse, seasonal)
Feed Cost EfficiencyHigher (floc as supplemental feed)Moderate (no supplemental feed from system)
Climate SensitivityModerate (manageable with backup systems)High (monsoon/summer fluctuations)
ROI TimelineFaster per crop cycle (smaller land, higher yield)Slower (land-intensive, lower density)
Primary Risk ProfileDO crash, power failure, microbial imbalanceDisease outbreak, sludge toxicity, water scarcity

Note: Effluent treatment values and discharge standards are general benchmarks and will differ based on the specific layout and design of individual localized Effluent Treatment Plants (ETPs) or settling ponds.

Species-Specific Suitability Under Indian Conditions

Litopenaeus vannamei (Whiteleg Shrimp): Biofloc is increasingly the preferred system for intensive Vannamei culture in coastal Andhra Pradesh and Odisha. The zero-water-exchange design reduces WSSV and EHP introduction risk from untreated water sources, a critical biosecurity advantage. Traditional pond Vannamei culture remains viable but demands rigorous pond bioremediation protocols, especially post-monsoon when organic load spikes.

Tilapia: Tilapia is arguably the most biofloc-compatible species in the Indian context. Its tolerance for variable water quality, omnivorous feeding behavior (meaning direct floc consumption), and fast growth rate make it ideal for high-density fish farming in biofloc tanks. Farmers in inland states like Madhya Pradesh, Uttar Pradesh, and Chhattisgarh are increasingly adopting biofloc-based Tilapia systems where land is available but water is scarce.

Pangasius: Large-scale Pangasius culture in India has historically favored traditional flow-through pond systems in Andhra Pradesh, given the species’ relatively hardy nature. However, as stocking intensities increase and bottom-sludge toxicity becomes a limiting factor, microbial management, both in traditional bioremediation applications and exploratory biofloc setups, is gaining traction.

Indian Major Carps (IMC): Traditional pond culture remains dominant for IMC due to established infrastructure and market channels. Here, the priority ROI intervention is not system conversion, but aggressive pond bioremediation to reduce mortality events and improve growth uniformity.

Biosecurity and the Role of Advanced Bio-Inputs

Biosecurity and the Role of Advanced Bio-Inputs

The differentiating factor between a biofloc system that generates strong returns and one that crashes within weeks is microbial management, specifically, the quality and diversity of the probiotic inoculant used to establish and sustain the floc community.

T1B™ Bio Floc by Team One Biotech is a specialized bio-accelerator formulated for precisely this purpose. Derived from natural vegetable sources through controlled fermentation technology, it delivers a minimum bacterial count of 3 × 10⁹ CFU/g in a stable, free-flowing powder form, pH stable between 4 and 9, and temperature stable from 4°C to 58°C, making it operationally suitable across India’s wide seasonal range from Himalayan hatcheries to coastal tropical farms.

What makes T1B™ Bio Floc particularly relevant to commercial operators is the breadth of its functional action:

  • Accelerates and stabilizes biofloc aggregate formation
  • Actively reduces ammonia, nitrite, and hydrogen sulphide, the three primary water quality killers in intensive systems
  • Improves intestinal microbial balance in cultured species, directly supporting immunity
  • Enhances immune response against pathogenic bacteria including Vibrio species
  • Drives measurable improvement in FCR through combined floc nutrition and gut health optimization
  • Supports higher survival rates and production uniformity across the crop cycle
  • Non-GMO and GRAS-status certified, with a two-year shelf life from manufacturing date

In traditional pond applications, Team One Biotech’s bioremediation solutions address the organic sludge challenge directly, deploying microbial consortia that break down bottom sludge aerobically, reduce hydrogen sulphide generation in Indian summer conditions, and stabilize ammonia levels during critical post-monsoon loading periods.

Both system types, biofloc and traditional pond, become significantly more financially predictable when underpinned by a consistent, science-backed bio-input program.

Making the Right Investment Decision

There is no universally superior system. The biofloc system vs traditional pond debate resolves differently depending on three variables: the capital available for initial infrastructure, the species and market the farmer is targeting, and the geographic and climatic realities of the farm location.

Biofloc delivers a compelling ROI case for intensive Vannamei and Tilapia operations where land is limited, water is scarce, and biosecurity is paramount. Its weakness lies in power dependency and the technical discipline required to manage microbial equilibrium, both challenges that are solvable with the right bio-input partners and backup infrastructure.

Traditional pond systems remain economically relevant, particularly for IMC, Pangasius, and polyculture operations, but their ROI in the current Indian environment is under sustained pressure from land costs, water scarcity, and the mounting cost of disease events. The answer for traditional pond operators is not abandonment of the model, but systematic intensification backed by professional bioremediation protocols.

In both cases, the margin between profit and loss increasingly lies not in the tank design, but in the microbial management strategy behind it.

Ready to Build a More Profitable, Resilient Aquaculture Operation?

Whether you are evaluating your first biofloc installation, managing a multi-pond traditional farm, or looking to reduce FCR and disease pressure across your existing crop cycles, Team One Biotech’s agronomists and aquaculture specialists work with you to build a bio-input protocol specific to your species, system, and local water chemistry.

Contact Team One Biotech today for a customized water quality audit, biofloc establishment protocol, or pond bioremediation assessment. Your next crop cycle is too valuable to manage on guesswork.

Looking to improve your ETP/STP efficiency with the right bioculture?
Talk to our experts at Team One Biotech for customised microbial solutions.

Contact+91 8855050575

Email:  sales@teamonebiotech.com

Visit: www.teamonebiotech.com

Discover More on YouTube – Watch our latest insights & innovations!-

Connect with Us on LinkedIn – Stay updated with expert content & trends!
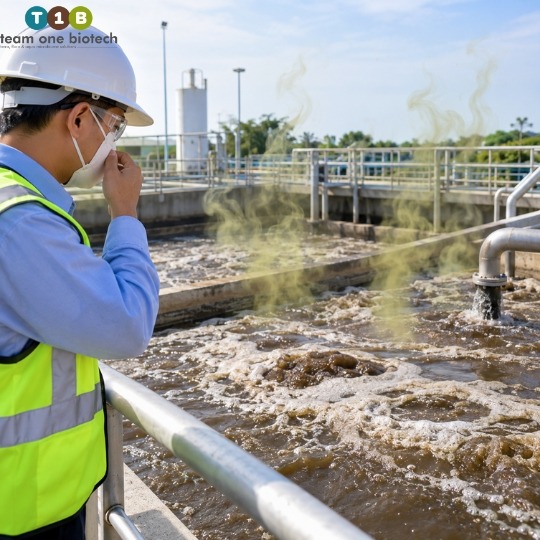
Lake and Pond Restoration: Using Biocultures to Remove Blue-Green Algae and Sludge

It happens before dawn. You walk to the pond edge at first light and the water is wrong, the surface is eerily still, a greenish-grey film stretched across it, and just below, hundreds of Rohu and Catla are gasping at the surface in a desperate search for oxygen. By the time you’ve assessed the damage, a significant portion of your stock is gone. No disease outbreak. No predator. Just a pond that silently suffocated overnight.

This is not a hypothetical. For commercial fish farmers across India, from the floodplain districts of West Bengal to the grow-out systems of Andhra Pradesh, sudden fish kills driven by dissolved oxygen crashes are an operational reality. The usual culprit? An unmanaged blue-green algae bloom that died off rapidly, crashed to the pond bottom, and consumed every molecule of available oxygen as it decomposed.

The instinctive response is to reach for an algicide. But chemical fixes applied in crisis mode create their own chain of problems: stress on surviving fish, disruption of beneficial microbial communities, residual toxicity, and, critically, zero resolution of the root cause. The dead organic matter is still there. The nutrient surplus feeding the next bloom is still there. The benthic sludge is still building.

This is precisely where biological treatment for pond restoration changes the entire calculus. Instead of suppressing symptoms, it targets the underlying biogeochemical imbalance that makes ponds catastrophically vulnerable in the first place.

How Algae Becomes Sludge Becomes a Death Trap

How Algae Becomes Sludge Becomes a Death Trap

Blue-green algae, correctly called cyanobacteria, are not true algae. They are photosynthetic bacteria with a remarkable and troublesome set of survival traits. Unlike green algae, they can fix atmospheric nitrogen, allowing them to thrive even when dissolved nitrogen is low. They produce gas vesicles that let them migrate vertically through the water column, hoarding light and blocking it from competitors. Under Indian summer conditions, water temperatures routinely exceeding 30°C from March through June, cyanobacteria like Microcystis aeruginosa, Anabaena spp., and Oscillatoria spp. can double their population in a matter of days.

When conditions shift, a heavy overnight cloud cover, a sudden monsoon rain cooling the surface, or simply the exhaustion of available nutrients, the bloom collapses. Billions of cells sink to the pond floor. The microbial decomposition of this biomass is aerobic initially, stripping dissolved oxygen from the water column at rates that can outpace natural replenishment entirely. What remains after decomposition under anaerobic conditions is the characteristic black, sulfurous benthic sludge familiar to any experienced farmer: a toxic, oxygen-depleted layer that continues emitting hydrogen sulfide and ammonia for weeks or months.

The cycle then repeats. Decomposing sludge releases the phosphorus and nitrogen that were locked inside algal cells, directly fueling the next bloom.

Species-Specific Risks in Indian Aquaculture Systems

Species-Specific Risks in Indian Aquaculture Systems

Understanding which species face the greatest physiological stress from this cycle matters enormously for farm management decisions.

Indian Major Carps (Rohu, Catla, Mrigal)

Among IMC, Mrigal (Cirrhinus mrigala) is particularly exposed. As a natural bottom-feeder, Mrigal forages directly in the sediment layer, the precise zone where hydrogen sulfide concentrations are highest and dissolved oxygen is lowest in a sludge-heavy pond. Chronic sub-lethal exposure manifests as suppressed immunity, poor feed conversion, and reduced growth rates, often misdiagnosed as nutritional deficiency. Catla, a surface feeder, faces a different threat: it is among the first species to show visible distress when a dying algal mat depletes surface-layer oxygen overnight.

Pangasius and Tilapia in High-Density Systems

Pangasius (Pangasianodon hypophthalmus) farming in India typically operates at stocking densities that generate substantial daily organic waste loads. In these systems, uneaten feed and fecal matter accumulate faster than natural microbial communities can process them. The result is accelerated sludge formation, often progressing from clean pond bottom to significant benthic organic accumulation within a single production cycle. Tilapia, though comparatively hardier, is not immune: in intensive systems with inadequate aeration, ammonia toxicity from sludge decomposition can suppress growth performance across an entire batch.

Hatchery Environments: The Most Unforgiving Scenario

Fry and fingerlings operate on zero margin. Their gill surface area relative to body weight is far higher than grow-out fish, meaning ammonia and nitrite exposure translates to physiological damage at concentrations that mature fish would tolerate. Chemical algicide treatments, particularly copper sulfate, carry real risks in hatchery environments due to species-specific toxicity windows. This makes biological treatment not merely preferable in hatchery settings, but often the only genuinely safe intervention option.

The Bioculture Solution: Restoring Microbial Balance From the Bottom Up

The Bioculture Solution: Restoring Microbial Balance From the Bottom Up

Pond restoration biological treatment works through three interlocking mechanisms that address the root causes rather than surface symptoms.

Organic Carbon Degradation: Formulated biocultures containing heterotrophic bacteria, including strains of Bacillus, Pseudomonas, and Nitrosomonas groups, colonize the benthic layer and begin enzymatically breaking down the organic sludge. Complex proteins, lipids, and cellulose from feed waste and decomposed algae are metabolized into carbon dioxide and water rather than toxic gases. Over a sustained treatment schedule, benthic sludge depth reduces measurably, and hydrogen sulfide emissions drop significantly. Under typical Indian grow-out conditions, this process may reduce sludge accumulation by roughly 40% to 70% over a full production cycle. Note: These are general values and operational outcomes will vary based on the specific pond ecosystem, stocking density, biomass load, feeding rates, and unique parameters of individual aquaculture systems or Effluent Treatment Plants (ETPs).

Nutrient Competition Against Cyanobacteria: Healthy, high-density bacterial populations in the water column compete directly with cyanobacteria for dissolved inorganic phosphorus and ammonium, the primary nutrients driving bloom formation. By reducing the bioavailable nutrient pool, biocultures can suppress bloom intensity and delay bloom onset during high-risk temperature windows. This competitive exclusion mechanism is far more durable than chemical algicide application, which eliminates active competition along with target organisms.

Nitrification and Ammonia Control: Nitrifying bacterial communities convert toxic ammonia (NH₃) to nitrite and then to relatively benign nitrate. In well-managed biological treatment programs, total ammonia nitrogen may decrease by roughly 50% to 75% across a treatment cycle, with corresponding improvements in fish behavior, feed uptake, and survival rates by around 15% to 30%. Note: These are general values and operational outcomes will vary based on the specific pond ecosystem, stocking density, biomass load, feeding rates, and unique parameters of individual aquaculture systems or Effluent Treatment Plants (ETPs).

If you are managing active sludge accumulation or early bloom signals in your ponds right now, contact Team One Biotech for an immediate water quality assessment and a targeted bioculture application protocol designed for your specific system.

Chemical Algicides vs. Biological Treatment: A Direct Comparison

FactorChemical Algicide TreatmentPond Restoration Biological Treatment
Speed of visible actionFast (24–72 hours)Progressive (2–4 weeks for measurable improvement)
Root cause resolutionNone, treats symptom onlyYes, degrades sludge, reduces nutrient load
Species safetyVariable; toxic windows for some speciesBroad-spectrum safe, including fry stages
Effect on beneficial microbiomeDisruptive; kills non-target bacteriaSupportive; introduces and amplifies beneficial strains
Residual toxicity riskPresent; accumulates with repeated useNegligible
Long-term bloom recurrenceHigh, nutrients remain availableReduced, nutrient competition limits rebloom
Regulatory compliance riskModerate to high depending on compoundLow
Cost trajectoryEscalating (dependency cycle)Stabilizing over time

Indian Climate Realities: The Challenges Biocultures Are Built For

Indian aquaculture operates in one of the most demanding climatic envelopes in the world for pond management.

Pre-Monsoon Heat Stress: Between April and June, surface water temperatures in many Indian farming states regularly exceed 32°C to 35°C. At these temperatures, cyanobacteria growth accelerates dramatically while dissolved oxygen saturation capacity of water drops, a dangerous convergence. Proactive bioculture dosing beginning in late March creates an established competing microbial population before bloom pressure peaks.

Monsoon Nutrient Loading: The first heavy monsoon rains flush enormous quantities of agricultural runoff, carrying nitrogen and phosphorus from fertilized fields, directly into aquaculture water bodies. This sudden nutrient pulse can trigger explosive eutrophication within days. Bioculture programs with active nutrient assimilation capacity buffer this loading event, processing incoming nitrogen and phosphorus before cyanobacteria can exploit it.

Feed Management and Waste Accumulation: Indian aquaculture feeding practices, particularly in smaller semi-intensive operations, often involve manual broadcast feeding with variable precision. Uneaten feed settling to the pond floor is a consistent and major driver of benthic sludge accumulation. Biocultures that actively degrade settled organic matter reduce this accumulation continuously rather than allowing it to compound across months.

From Reactive Crisis Management to Preventive Biological Maintenance

The farmers who experience the worst fish kills are almost universally those managing their ponds reactively, responding to crises as they emerge rather than maintaining the biogeochemical conditions that prevent crises from developing.

A preventive biological maintenance schedule built around aquaculture bioremediation involves routine bioculture applications calibrated to stocking density and feeding rates, periodic dissolved oxygen and ammonia monitoring, and pre-positioned treatment protocols for high-risk periods like peak summer and early monsoon. This shift from emergency response to biological maintenance is what separates consistently profitable aquaculture operations from those that recover ground each season.

The science is established. The results, across thousands of commercial ponds in India, are consistent.

Work With Team One Biotech: Custom Protocols for Your Pond System

Every pond is a distinct ecosystem. Stocking species, density, feed quality, water source, and local climate all shape the biological dynamics that determine treatment outcomes.

Team One Biotech’s aquaculture specialists provide site-specific water quality analysis, species-matched bioculture formulations, and ongoing technical support designed for the realities of Indian aquaculture management, from hatchery operations to high-density Pangasius grow-out systems.

Reach out to our technical team today to schedule a pond assessment and develop a biological treatment protocol that protects your stock, reduces your chemical dependency, and builds long-term productivity into your water management system.

Looking to improve your ETP/STP efficiency with the right bioculture?
Talk to our experts at Team One Biotech for customised microbial solutions.

Contact+91 8855050575

Email:  sales@teamonebiotech.com

Visit: www.teamonebiotech.com

Discover More on YouTube – Watch our latest insights & innovations!-

Connect with Us on LinkedIn – Stay updated with expert content & trends!
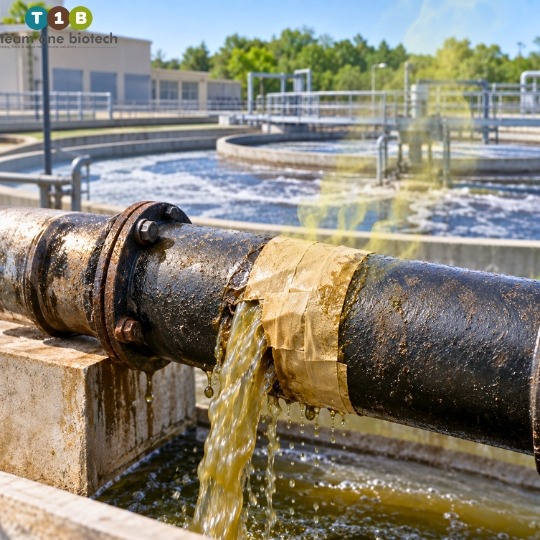
Scan the code