
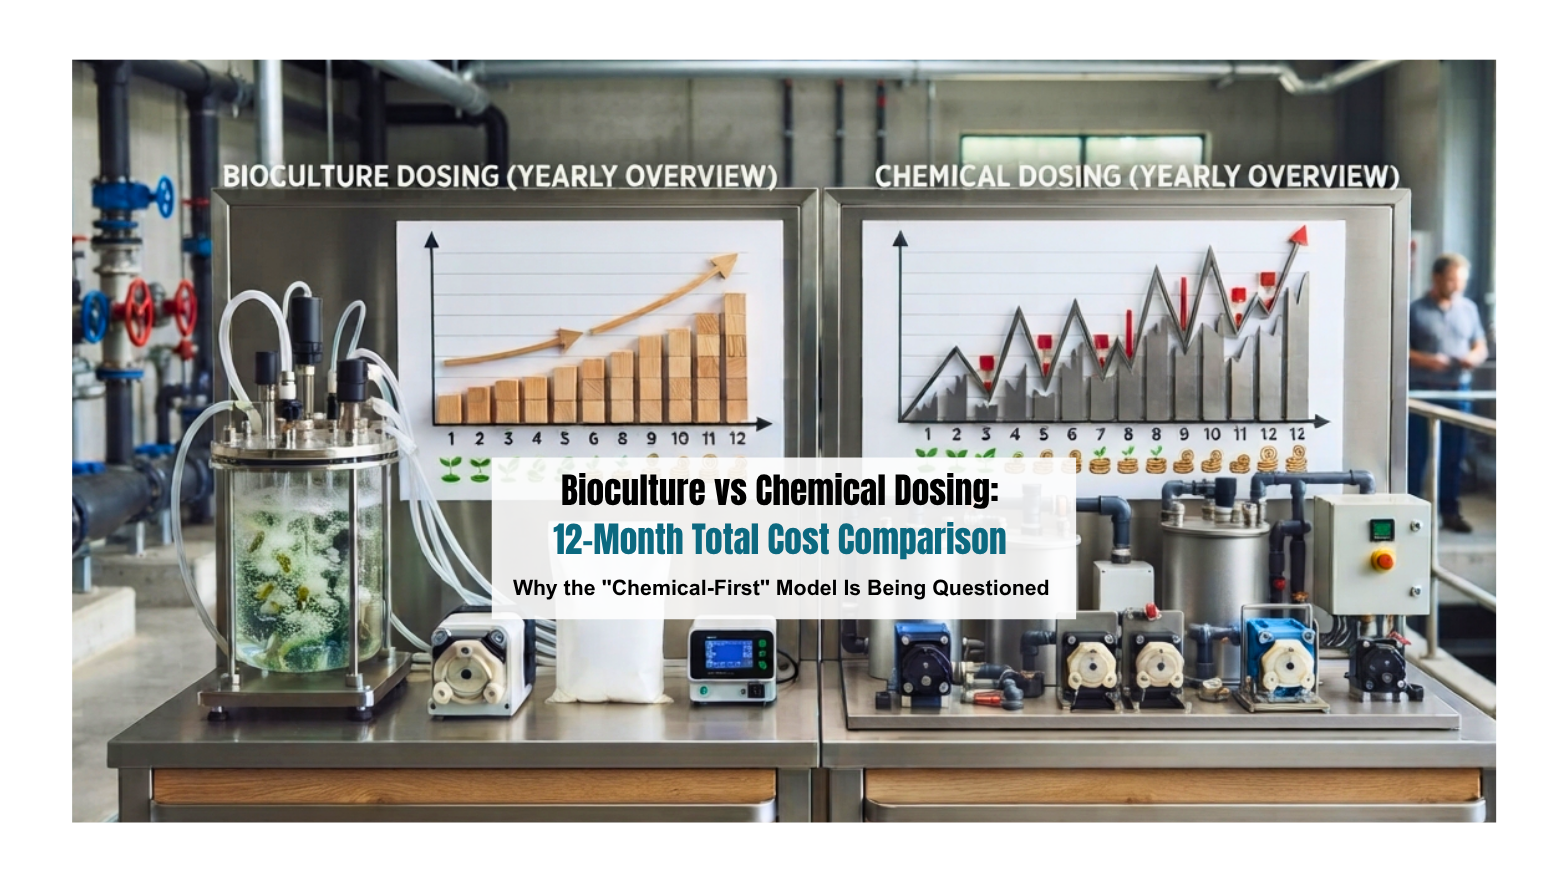

Bioculture vs Chemical Dosing: 12-Month Total Cost Comparison
Walk through almost any industrial ETP in India and you will hear the same quiet frustration. Chemical procurement budgets creep upward quarter after quarter, compliance pressure from CPCB and SPCB keeps tightening, and the sludge yard keeps filling. Plant managers sense that chemical dependency has a ceiling, but few have a financial model to prove it. This article breaks down the true bioculture vs chemicals cost picture over a full year, so you can take a credible total cost of ownership (TCO) comparison into your next budget review with confidence.
If any of these sound familiar, this comparison was written for you:
- Chemical costs rise every quarter, and there is no visible ceiling
- CPCB / SPCB compliance is non-negotiable, yet chemical dosing is becoming harder to justify financially
- Sludge disposal quietly drains the budget and rarely appears in cost presentations
- You want to move toward biological treatment but cannot get CFO approval without a financial model
- You worry that bioculture may not deliver consistent BOD, COD and heavy metal compliance the way chemicals do
Why the “Chemical-First” Model Is Being Questioned
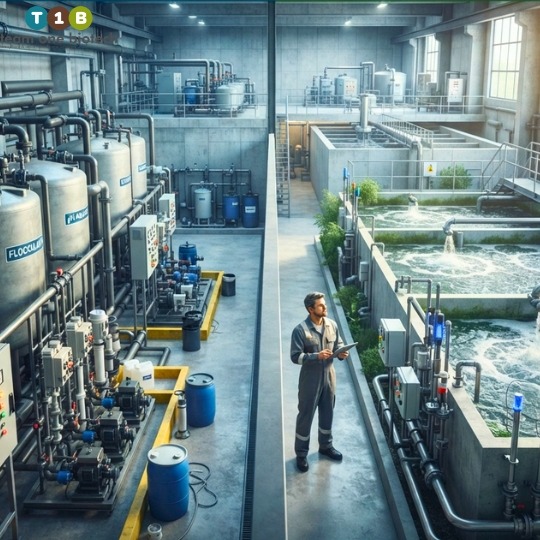
Chemical dosing has been the default for decades because it delivers fast, visible results. Add a coagulant and flocs form, correct the pH and the reading moves, dose a flocculant and turbidity drops within minutes. For a plant manager under pressure to hit discharge limits, that immediacy is reassuring.
But the model was built around short-term compliance, not long-term cost efficiency. It treats every compliance target as a dosing problem, and every dosing problem as a purchase order. Over time, that logic ties your operating budget to commodity markets and supplier timelines you do not control.
Several things have changed. Input costs have risen, CPCB and SPCB norms have tightened, and sludge disposal now draws far more scrutiny than it once did. Corporate ESG and sustainability mandates have also entered the picture, asking plants to justify their carbon footprint as well as their discharge quality. Plant managers are no longer judged only on whether the outlet meets limits, but increasingly on cost per kiloliter treated.
This is the environment in which a direct comparison of chemical dosing vs bioculture becomes not just useful, but operationally necessary.
The 12-Month Cost Framework: Chemical Dosing vs Bioculture
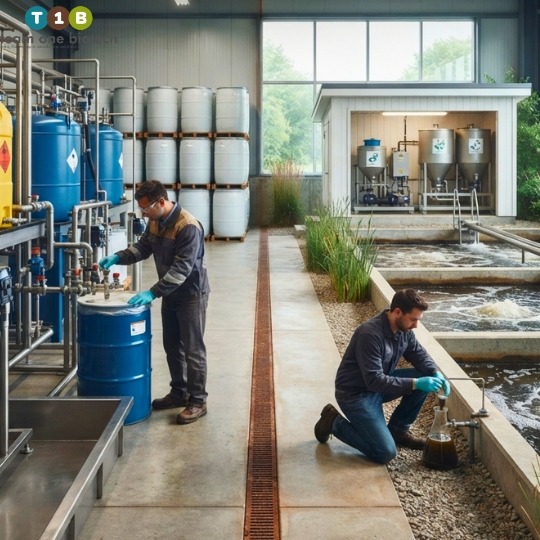
A fair comparison has to go beyond the per-liter price of chemicals. A proper 12-month TCO model should account for these categories:
- Recurring consumable costs: chemical procurement versus bioculture replenishment
- Sludge generation and disposal: volume produced and the cost of getting it out of the plant legally
- Energy consumption: aeration, mixing and chemical feed pumps
- Labor and monitoring: operator hours, testing frequency and supervision
- Asset wear and maintenance: pump corrosion, dosing equipment and chemical storage infrastructure
- Regulatory non-compliance risk: penalty exposure and remediation cost
Most facilities compare only the direct chemical purchase price against the price of a bioculture product. That approach dramatically underestimates the true gap, because the largest differences tend to sit in the other categories.
Disclaimer: All cost ranges and figures referenced in this article are indicative and general in nature. Actual costs vary significantly based on plant capacity, influent characteristics, industry type, treatment objectives, and geographic location. We recommend conducting a site-specific TCO audit for accurate projections.
Recurring Consumable Costs: The Most Visible Line Item
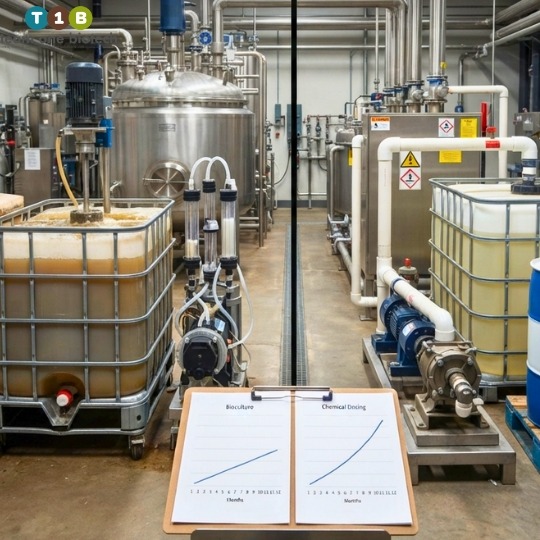
This is the line item everyone sees, so it is where most comparisons begin and, unfortunately, end.
Chemical Dosing: Month-on-Month Procurement Burden
A typical ETP or STP chemical program is a cocktail rather than a single product. It often includes coagulants such as alum and ferric chloride, flocculants such as polyelectrolytes, pH correctors such as lime and sulfuric acid, defoamers, and specialty chemicals for heavy metal precipitation. Each one is purchased repeatedly, in volumes that track your effluent flow.
These are not one-time purchases. They are monthly, volume-dependent and price-indexed to commodity markets, which means your budget moves whenever the market does. Seasonal swings in influent load make matters worse, because dosing is rarely perfectly optimized. Plants often overdose as a safety buffer against compliance risk, and that habit inflates costs further.
For mid-sized industrial ETPs, chemical consumables can account for a significant share of the monthly operational budget. Costs typically range across a wide band depending on industry type and effluent complexity.
Bioculture: Replenishment Logic and Cost Behavior
Bioculture works on a different principle. It is not a daily-dose chemical but a living microbial consortium that, once established, self-sustains within the bioreactor. Initial inoculation is a one-time or periodic event, and ongoing replenishment costs are substantially lower than continuous chemical procurement.
The cost curve looks different too. Spending is front-loaded around setup and inoculation, then flattens through months 3 to 12 as the microbial ecosystem matures and stabilizes. Chemical dosing has no such flattening. Its costs follow influent load and market prices, so they fluctuate but never fall just because the plant has been running longer.
That difference in trajectory matters more than any single month’s invoice. A cost that flattens and a cost that tracks the market will always diverge over a full year.
Sludge Generation and Disposal: The Hidden Cost Nobody Budgets Correctly
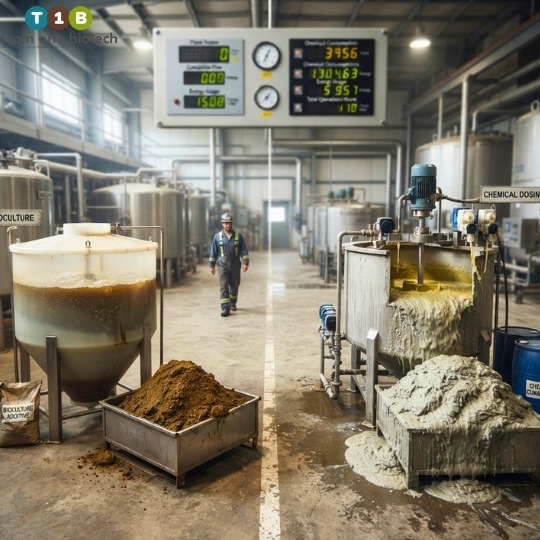
If your TCO model leaves out sludge, it is incomplete, and this is often where the gap is largest. Many plants carry sludge costs in a separate budget head, so they never get attributed to the treatment method that created them.
Chemical dosing, especially with coagulants and flocculants, dramatically increases sludge volume. The chemicals bind with suspended and dissolved matter and settle out as a heavy precipitate. Depending on the industry, that sludge may be classified as hazardous, which means it must be handled and disposed of through CPCB-authorized vendors at a significant per-metric-ton cost.
The pattern is a compounding one. Higher dosing frequency means more sludge, more sludge means more handling, storage and transport, and all of it adds up to higher disposal spending. Bioculture-based treatment generates substantially less sludge because the biological process mineralizes organic matter instead of flocculating and settling it. Over a 12-month cycle, reduced sludge disposal can be one of the largest single savings levers in the entire comparison.
Disclaimer: Sludge volume and disposal costs are highly site-specific. Figures referenced here are general estimates and should not be used for project budgeting without site-specific assessment.
Wondering how much your plant currently spends on sludge disposal versus what it could look like with a bioculture-optimized system? Connect with our team for a no-obligation TCO assessment.
Energy Consumption: An Underrated Variable in the Cost Model
Chemical feed systems carry an energy cost that rarely gets attributed to them. Dosing pumps, rapid mix tanks and flash mixers all run on electricity, and that consumption disappears into the plant’s general power bill. Nobody looks at the electricity line and thinks of it as a chemical treatment expense.
Bioculture-based systems, when properly designed, can reduce energy demand by optimizing aeration cycles and easing the load on downstream clarification equipment. A healthier biological stage means less polishing is needed after it.
This is a secondary lever, not the primary driver of savings, but it is a consistent contributor to annual savings. It also carries a benefit beyond the electricity bill. Lower energy use translates directly into a smaller carbon footprint, which is increasingly relevant for ESG reporting.
Compliance Cost and Risk: The Line Item That Does Not Appear Until It Does
This is where the real hesitation sits, so it deserves a direct answer. Both approaches must achieve the same goal: consistent discharge within CPCB and SPCB limits for BOD, COD, TSS and heavy metals. The question plant managers ask is whether bioculture will hold when influent load spikes or temperatures swing.
It is a fair concern. Modern targeted bioculture formulations are designed for resilience, not just average-condition performance. When correctly inoculated and maintained, they deliver consistent compliance across seasonal variation. The key word is targeted, because a consortium matched to your effluent profile behaves very differently from a generic off-the-shelf product.
Chemical dosing carries its own risk, and it is easy to overlook because the method feels familiar. Heavy reliance on chemicals creates a fragile system in which any supply disruption, price spike or dosing error can trigger immediate compliance trouble. A late delivery or a miscalibrated pump can undo weeks of stable performance.
The cost of non-compliance is real and direct. It includes penalties, show-cause notices, potential plant shutdown and remediation, and these costs can dwarf any savings made on chemical procurement. This is why CPCB compliance cost belongs in the model as a risk-weighted line, even though it does not appear on a monthly invoice.
12-Month TCO Snapshot: Bioculture vs Chemicals Cost, Put Together
Here is how the year typically unfolds when every category is honestly accounted for.
Months 1 to 3: Chemical dosing often appears cheaper in this window because bioculture carries setup and inoculation costs. This is the point where many comparisons stop, and it is the most misleading window in the whole cycle. A three-month view should never define a twelve-month decision.
Months 4 to 6: Bioculture costs stabilize and begin to flatten as the microbial consortium matures. Chemical costs keep tracking influent load and market prices, so the two curves start to converge.
Months 7 to 12: The compounding effects begin to widen the gap. Lower sludge disposal spending, reduced chemical procurement and lower energy use add up month after month. Fewer emergency orders and less firefighting also reduce the hidden labor and management cost of running a chemical-heavy plant.
By month 12, a complete TCO comparison typically favors bioculture by a meaningful margin for most mid-to-large industrial ETPs. That is a directional finding, not a guarantee, and it depends entirely on plant conditions.
Disclaimer: This narrative represents a generalized cost trajectory. Actual outcomes vary significantly based on plant-specific conditions. A site-specific analysis is strongly recommended before any operational transition.
Chemical Dosing vs Bioculture: Is Your Plant Ready to Make the Shift?
The move from chemical-heavy to bioculture-optimized treatment is not a wholesale overnight change. It is a phased operational shift that requires careful inoculation, process monitoring and adjustment over the first 60 to 90 days. Done properly, the chemical dose is stepped down as biological performance is validated, not removed on day one.
Plants that have made the transition tend to report benefits beyond cost. They see fewer emergency chemical orders, less sludge crisis management and more predictable compliance outcomes. The decision is not purely financial. It is also operational risk management and a question of long-term sustainability positioning.
For CFOs, the payback profile makes bioculture a defensible CapEx/OpEx reallocation rather than a speculative experiment. The front-loaded cost is real, but so is the flattening curve that follows. For plant managers, the stability and compliance record of properly deployed bioculture gives you a credible alternative to defend at your next CPCB audit visit.
If you are ready to move from chemical dependency to biological optimization, Team One Biotech’s technical team can walk you through a customized 12-month TCO model for your specific plant. Get in touch today and let the numbers make your case for you.
Frequently Asked Questions
Q1: Will bioculture deliver consistent CPCB compliance performance the way chemicals do?
Yes. When correctly formulated and deployed for your specific effluent profile, bioculture delivers stable, reliable compliance for BOD, COD and heavy metals. The key is using a targeted consortium, not a generic off-the-shelf product. Team One Biotech’s formulations are designed for industry-specific effluent characteristics.
Q2: How long does it take for bioculture to show results compared to chemical dosing?
Chemical dosing shows immediate visible results, such as floc formation and pH correction. Bioculture requires an establishment period of roughly 30 to 90 days for the microbial consortium to fully colonize and stabilize. This initial period is a one-time investment, and after establishment the system self-sustains and costs flatten significantly.
Q3: Can we run bioculture alongside our existing chemical treatment system?
Absolutely. In fact, most plants begin with a hybrid approach, gradually reducing chemical dosing as bioculture performance is validated. This phased transition reduces operational risk and allows side-by-side performance monitoring before a full transition.
Conclusion
Run honestly and comprehensively, a 12-month comparison makes a strong case for bioculture-optimized treatment. The bioculture vs chemicals cost question is rarely settled by the purchase price alone. It is settled by what happens to sludge, energy, labor and risk over the full year.
Three levers carry most of the weight: consumable procurement, sludge disposal and compliance risk exposure. Chemical dosing keeps all three tied to market prices and influent swings, while a well-established bioculture system flattens them. No two plants are identical, which is why a site-specific analysis matters more than any general claim.
The best time to run a TCO comparison for your plant was last budget cycle. The second best time is now. Reach out to Team One Biotech and let us help you build the business case.
Looking to improve your ETP/STP efficiency with the right bioculture?
Talk to our experts at Team One Biotech for customised microbial solutions.
Contact: +91 8855050575
Email: sales@teamonebiotech.com
Visit: www.teamonebiotech.com
Discover More on YouTube – Watch our latest insights & innovations!-
Connect with Us on LinkedIn – Stay updated with expert content & trends!