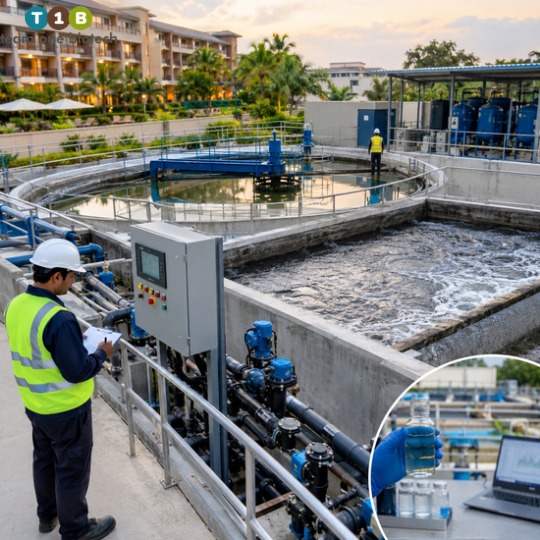

OCEMS Explained: What Regulators Now See in Real Time

It is well past midnight when your phone buzzes. It is not the control room, and it is not your shift supervisor. It is an automated alert. A single parameter at your outlet has crossed its limit, and the regulator’s dashboard has already flagged it.

Nobody has called you yet. Nobody needs to. The data is already visible, and you have not had a chance to explain anything.

This is the reality of OCEMS requirements today. Online continuous effluent monitoring has changed who sees your plant’s performance, and when. In this guide, you will learn what the system measures, how the data reaches the regulator, what patterns it exposes, and how to keep your biology stable enough to stay out of trouble.

What Is OCEMS and Why Does It Matter Now?
What Is OCEMS and Why Does It Matter Now?

OCEMS stands for Online Continuous Effluent Monitoring System. In plain language, it is a set of sensors, analyzers, and data systems installed at your effluent discharge point. They measure key quality and flow parameters continuously and send the readings to the Central Pollution Control Board (CPCB) and the State Pollution Control Board (SPCB) servers.

Think of it as the difference between a photograph and a live video feed.

For decades, compliance was judged on periodic sampling. An inspector visited, drew a sample, a lab tested it, and the result represented a moment in time. A plant could be compliant on inspection day and struggling on every other day, and the system had limited ways to tell.

That gap is exactly what regulators set out to close. Mandates expanded because periodic sampling could not capture shock loads, night-time discharges, or short excursions. Continuous visibility lets authorities see how a plant behaves across shifts, seasons, and production cycles.

For you, this shifts the question from “Did we pass the inspection?” to “Is our ETP stable right now, and will the data prove it?”

OCEMS Requirements: What the Regulations Expect From Your Plant

OCEMS Requirements: What the Regulations Expect From Your Plant

Requirements are set by CPCB directions and implemented through each SPCB, so they vary by industry category, location, and the conditions in your consent to operate. Treat the following as a general map, not a substitute for your own documents.

  • Covered industries: Typically, industries identified as significant polluters, including many in the highly polluting categories, along with large effluent generators and common effluent treatment plants. Applicability depends on category and consent conditions.
  • Parameters monitored: Commonly pH, flow, COD, BOD (often through a proxy or correlation approach), and TSS. Some sectors carry additional parameters in their consents.
  • Data transmission: Readings must reach the CPCB/SPCB servers continuously and reliably, through approved protocols and equipment configurations.
  • Calibration and uptime: Sensors must be maintained, calibrated on a regular schedule, and kept operational. Extended downtime is itself a compliance concern.
  • Data retention: Raw and processed data, calibration records, and maintenance logs generally need to be retained and made available when asked.
  • Tamper resistance: Systems are expected to resist manipulation, with security features and audit trails that record access and changes.

Always verify the exact requirements against your consent to operate and the current CPCB/SPCB directions. Guidelines are revised, and what applied to a neighboring plant may not apply to yours.

Inside the System: Sensor Architecture and Data Flow

Inside the System: Sensor Architecture and Data Flow

The simplest way to picture OCEMS is as a chain:

Sensor > Data Logger > Gateway > CPCB/SPCB Portal

If any link fails, the regulator sees the failure. Here is what each link does.

Sensors and Analyzers (COD, BOD or Proxy, TSS, pH, Flow Meter)

This is the measurement layer, and each parameter uses a different principle.

  • pH: Electrode-based probes, sensitive to fouling and drift. They need regular cleaning and calibration.
  • COD: Usually measured by optical or spectral analyzers, or by wet-chemistry analyzers in some setups. Optical units are often correlated against lab results for your specific effluent.
  • BOD: Direct online BOD measurement is difficult, so many installations use a proxy or a correlation with COD and other signals. Your SPCB defines what is acceptable.
  • TSS: Turbidity or suspended-solids sensors, which can be affected by color, bubbles, and fouling.
  • Flow: Electromagnetic, ultrasonic, or open-channel flow meters that record discharge volume. Flow data is crucial because it reveals whether you are discharging more than your consent allows.

Data Logger, PLC, and Gateway

Sensor outputs feed a data logger or PLC, which time-stamps, stores, and formats the readings. The gateway then packages that data and pushes it to the regulator’s servers.

This layer also handles power-failure behavior, local buffering during connectivity loss, and security. A weak link here, such as an unprotected power supply or an unstable network, creates data gaps that look suspicious even when the effluent is fine.

Telemetry to CPCB/SPCB Servers

Data travels over approved communication channels to the central servers. Each reading carries a timestamp, a device identity, and status information. Transmission continuity matters as much as the values themselves.

How the Regulator Dashboard Displays Your Plant

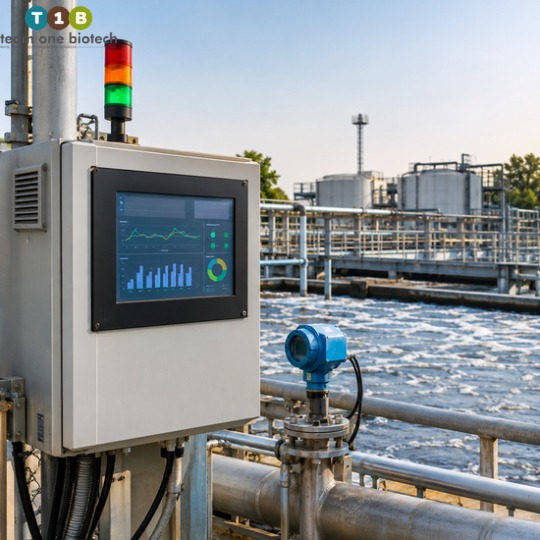
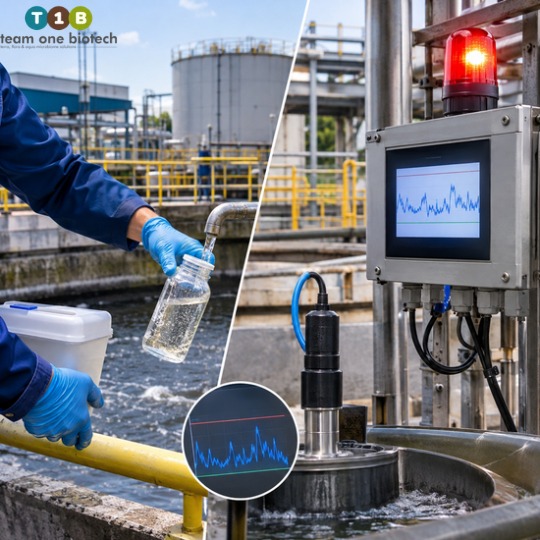
On the regulator side, your plant appears as a live station. Authorities can typically view current readings, historical trends, status indicators for each analyzer, and alerts when readings cross limits or when data stops arriving.

Picture a color-coded status panel with a trend line behind every parameter. A single glance shows who is compliant, who is drifting, and who has gone quiet.

What Regulators Actually See in Real Time

What Regulators Actually See in Real Time

Most plant managers worry about breaches. The system sees much more than that. A pattern is as visible as a breach, and sometimes more telling.

Here is what the dashboard can expose:

  • Parameter spikes: A sudden jump in COD, TSS, or pH shows up immediately, along with how long it lasted and how fast it recovered.
  • Repeated near-limit trends: A plant that hovers close to its limit day after day looks fragile. It signals a lack of treatment margin.
  • Flat-line or frozen readings: Real effluent fluctuates. A reading that never moves suggests a stuck sensor, a disconnected probe, or manipulated data.
  • Sudden zero or offline data: A parameter dropping to zero or the station going silent invites questions, especially if it coincides with production.
  • Calibration irregularities: Unusual step changes after maintenance, or missing calibration records, raise concerns about data integrity.
  • Power or connectivity gaps: Repeated gaps at similar times may point to a pattern rather than coincidence.
  • Possible bypass or tampering patterns: Flow that does not match production, readings that behave unnaturally, or alerts from the tamper-detection features can all indicate that effluent is being diverted or data altered.

Notice what these have in common. None of them requires a lab test or an inspector’s visit. The system flags them on its own.

That is why a stable, well-managed plant is now the best defense. A quiet, predictable trend line is its own proof of control.

The Cost of Non-Compliance: Notices, Closure, and Bank Guarantees

The compliance framework rests on one expectation: uninterrupted alignment with CPCB and SPCB real-time telemetry protocols under the mandatory OCEMS guidelines. When alignment breaks, consequences can escalate quickly.

Automated electronic show-cause notices

When real-time data shows an exceedance, repeated near-limit behavior, or prolonged data loss, the system can trigger a show-cause notice electronically. The notice asks you to explain, and your response is judged against the data the regulator already holds.

Closure directives under Section 33A of the Water Act

Section 33A allows the State Pollution Control Board to issue directions, which can include closure, prohibition, or regulation of a process or industry, and in some cases the stoppage of utilities such as electricity or water. Persistent non-compliance or confirmed tampering can move a plant toward this stage.

Bank guarantee forfeiture

Many consents and compliance frameworks require a bank guarantee as a financial assurance. Real-time data exceedances or signal tampering alerts can become grounds for forfeiting it, depending on your conditions and the regulator’s directions.

The tone here is serious, not alarmist. Most plants never reach closure. But each step builds on the one before it, and a pattern that begins with ignored alerts can end with a financial or operational penalty. We have deliberately avoided quoting penalty amounts or timelines, since these depend on your consent conditions, your state, and current directions. Check your own documents.

Why Most Real-Time Breaches Start in the Biology, Not the Sensor

When an alert fires, the first instinct is often to blame the instrument. Sometimes that is fair. Sensors foul, drift, and fail.

But more often, the sensor is reporting reality accurately. The effluent really did change, and the cause is upstream, inside the biological treatment.

An activated sludge process or any other biological system is a living population. It responds to what you feed it. When conditions shift faster than the biology can adapt, the outlet shows it. Common root causes include:

  • Shock loads: A sudden surge in organic load, a batch dump, or a cleaning-cycle discharge overwhelms the microbes.
  • Poor equalization: Without a well-mixed buffer, variability reaches the biological reactor in full force.
  • Nutrient imbalance: Too little nitrogen or phosphorus relative to carbon starves the biomass and weakens floc formation.
  • Sludge bulking: Filamentous growth or poor settling carries solids over the clarifier weir, which shows up as a TSS excursion.
  • Toxic inhibition: Biocides, heavy metals, solvents, or other inhibitory compounds suppress microbial activity.
  • Seasonal and temperature swings: Biological rates slow in cold weather and can destabilize in extreme heat.
  • Aeration issues: Insufficient or uneven oxygen transfer limits aerobic degradation. Excess aeration can damage floc structure.

Notice that none of these is fixed by recalibrating a sensor. They are fixed by stabilizing the process.

Is your ETP ready for what the dashboard sees? Talk to Team One Biotech’s technical team for an ETP performance review.

How to Prevent Real-Time Breaches for COD, BOD, TSS, pH, and Flow

Prevention works best in layers. Stabilize the biology, smooth the incoming load, and add microbial strength where the system needs it.

Biological Stabilization

A stable biological system has balanced food-to-microbe conditions, adequate oxygen, healthy sludge age, and the right nutrient ratio. The aim is a population that is resilient, not just active.

Practical steps include monitoring dissolved oxygen, watching sludge settling behavior, maintaining nutrient balance, and managing return sludge sensibly. Stable biology flattens the trend lines the regulator sees.

Buffer and Equalization Management

Equalization is your first line of defense against variability. A well-managed equalization tank, with adequate mixing, controlled pumping, and sensible retention time, turns an erratic influent into a steadier one.

Pay attention to pH adjustment before the biological stage, to avoiding dead zones that cause settling or septic conditions, and to scheduling high-strength batch discharges so they enter gradually rather than all at once.

Targeted Bioaugmentation

Bioaugmentation introduces specialized microbial consortia selected for the compounds and conditions in your effluent. Used well, it helps strengthen the existing biomass rather than replacing it.

Targeted bioaugmentation for an ETP can help in several ways. It can improve degradation of difficult organics, support faster recovery after a shock load, improve floc quality and settling, and add resilience when conditions swing. It does not replace good operation, but it supports stability and reduces the risk of breaches.

Parameter-versus-Remedy Map

ParameterTypical Cause of SpikeBiological / Operational Remedy
CODShock organic load, inhibited biomass, recalcitrant compoundsBetter equalization, load scheduling, targeted bioaugmentation, nutrient balancing
BODInsufficient aeration, low microbial activity, short contact timeImprove oxygen transfer, stabilize biomass, support with specialized consortia
TSSSludge bulking, poor settling, clarifier overloadControl sludge age, manage filamentous growth, optimize clarifier operation
pHUnneutralized process streams, chemical dosing errorsEqualization with pH correction, dosing control, buffer capacity management
FlowUncontrolled discharge, stormwater ingress, batch releasesFlow equalization, sensible discharge scheduling, leak and ingress checks

A Practical OCEMS Readiness Checklist

Use this as a starting point for your plant team. Adapt it to your consent and your system.

  • Confirm which parameters and reporting conditions apply under your consent to operate and current CPCB/SPCB directions.
  • Review trend data regularly, not just at month end, and look for near-limit behavior and frozen readings.
  • Keep calibration, cleaning, and maintenance schedules documented, current, and traceable.
  • Protect the data chain with backup power for loggers and gateways, and a stable, monitored network connection.
  • Check equalization performance: mixing, pH correction, and handling of batch discharges.
  • Track biological health indicators such as dissolved oxygen, sludge settling, nutrient balance, and microscopic observations.
  • Set internal alert thresholds below your regulatory limits so your team reacts before the regulator does.
  • Write a response protocol for alerts, covering who acts, who documents, and who communicates with the SPCB.
  • Review the system for tampering exposure: access controls, audit trails, and seal integrity.

Want to know where your biology is most exposed? Request a site-specific bioaugmentation assessment from Team One Biotech.

FAQs

Who needs to comply with OCEMS requirements?

Applicability is set by CPCB directions and implemented by each SPCB. It generally covers industries in specified polluting categories, larger effluent generators, and common effluent treatment plants. Your consent to operate and current SPCB communications are the authoritative sources. If you are unsure, confirm directly with your regional office.

What happens if OCEMS data shows an exceedance?

The system can generate an automated alert and, if the exceedance is significant or repeated, an electronic show-cause notice. Continued non-compliance can lead to directions under Section 33A of the Water Act, and financial consequences such as bank guarantee forfeiture. The response depends on your consent conditions and the regulator’s assessment.

Can bioaugmentation help stabilize effluent parameters?

Bioaugmentation can help support stability when it is matched to your effluent and applied alongside good operation. Specialized microbial consortia may improve degradation of difficult organics and help the system recover from shock loads. It is not a standalone fix, and results depend on your process, conditions, and how well the ETP is managed.

How often should sensors be calibrated?

Calibration frequency depends on the sensor type, the effluent, the manufacturer’s guidance, and what your SPCB specifies. Fouling-prone sensors generally need more frequent attention. Follow the schedule in your consent and system documentation, and keep clear records, since calibration history is part of what regulators may review.

Make Your ETP OCEMS-Ready

Go back to that midnight alert. The data was visible before you could explain it. That is the defining feature of online continuous effluent monitoring: the regulator sees what your plant is doing as it happens.

The good news is that sensors are honest messengers. If your biology is stable, your equalization is well managed, and your microbial population is resilient, the trend lines tell a calm, credible story. Understanding OCEMS requirements is the first step. Stabilizing the biological process behind every reading is the step that keeps you compliant.

Do not wait for the next real-time alert. Speak to the Team One Biotech experts today and make your ETP OCEMS-ready.

Disclaimer: The information in this post is general guidance. All values, ranges, and parameters referred to are general and indicative. Actual figures differ for every ETP depending on industry, process, influent characteristics, and regulatory consent conditions. Always verify requirements against your own consent to operate and the current CPCB and SPCB directions. Outcomes from any treatment approach depend on site-specific conditions and are not guaranteed.

Looking to improve your ETP/STP efficiency with the right bioculture?
Talk to our experts at Team One Biotech for customised microbial solutions.

Contact: +91 8855050575

Email:  sales@teamonebiotech.com

Visit: www.teamonebiotech.com

Discover More on YouTube – Watch our latest insights & innovations!-

Connect with Us on LinkedIn – Stay updated with expert content & trends!
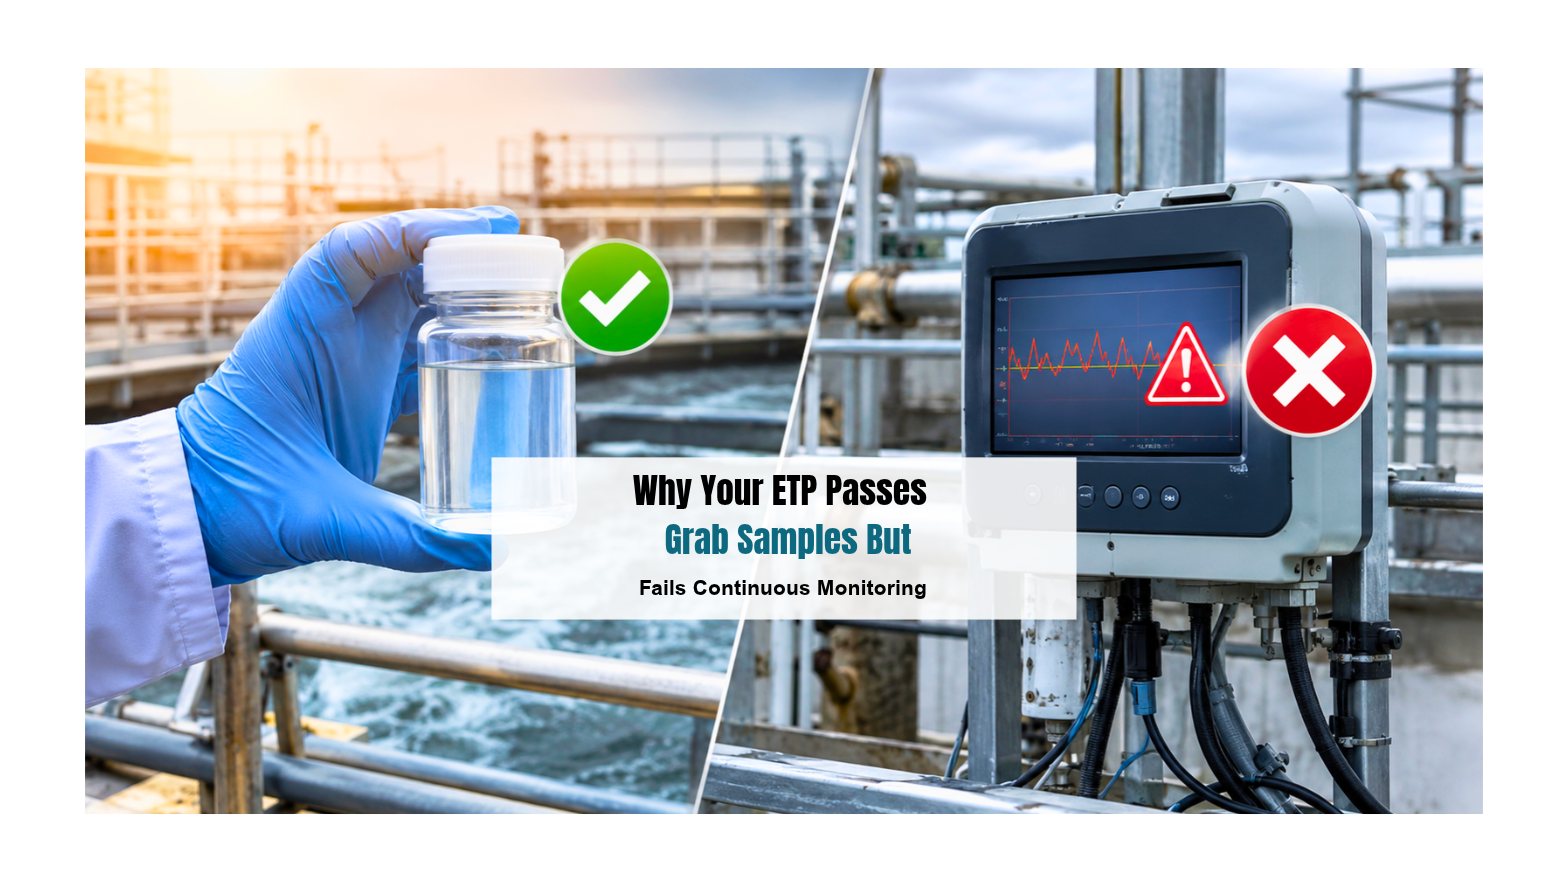
Why Your ETP Passes Grab Samples But Fails Continuous Monitoring

The lab report is clean. The grab sample passed, the team is relaxed, and someone has already said, “We’re fine this month.” Then the OCEMS dashboard turns red. Worse, the alert has reached the regulator’s server before it reached your desk. Your phone starts ringing, management wants answers, and the first question is always the same: how can the lab say we’re compliant while the analyzer says we’re not?

If this is happening at your plant, you’re dealing with a classic OCEMS compliance failure, and you’re not alone. It’s common, it’s explainable, and it’s fixable. This blog explains why grab samples and continuous monitoring disagree, where the real causes sit (in the sensors, the biology, and the operations), and what you can do to flatten the spikes.

Keep reading. The hidden causes are usually closer to your aeration tank than to your analyzer.

What Is Really Happening When Grab Samples and OCEMS Disagree

What Is Really Happening When Grab Samples and OCEMS Disagree

Think of a grab sample as a single photograph. It’s sharp, accurate, and tested by a proper lab method. But it only shows one moment, at one location, collected by one person.

Your continuous effluent quality monitoring system (EQMS) is the entire film. It records what happens before, during, and after that photograph, including the scenes you’d rather not see: the surge after a shift change, the batch drained from a process tank, the sludge carryover when the clarifier is stressed.

Here’s the uncomfortable part. Both can be right at the same time. The grab sample correctly says the effluent was within limits at that moment. The OCEMS correctly says the effluent wasn’t within limits at other moments. The regulator, however, reads the film, not the photograph.

Under current expectations, OCEMS data flows in real time to the CPCB and SPCB servers. Your plant head isn’t the first audience. That’s why ETP grab sample vs online monitoring is no longer a lab argument. It’s a compliance reality.

AspectGrab SampleContinuous OCEMS
TimingScheduled, often predictableAround the clock, unannounced
CoverageOne moment, one pointEntire operating period
Bias riskDepends on who samples, where, and whenDepends on sensor condition and placement
Peak detectionUsually misses short peaksCaptures peaks and trends
Regulatory visibilitySeen when submitted or inspectedSeen live on the regulator’s server
What it can missSurges, shock loads, off-hour dischargesLab-grade accuracy if the sensor drifts

Why Grab Samples Can Hide an OCEMS Compliance Failure

Why Grab Samples Can Hide an OCEMS Compliance Failure

A clean grab sample is not a lie. It’s just incomplete. Here’s how it usually hides the problem.

Sampling bias

Who samples, from where, and at what time matters more than most plants admit. A sample taken from the calm end of the outlet channel, at mid-morning, by a careful technician, will almost always look better than the average of the day.

Predictable testing windows

When sampling follows a schedule, the plant behaves its best during that window. Operators watch the aeration, trim the load, and hold back any batch discharge. That’s human nature, but the microbes and the process don’t behave that way at 2 a.m.

Dilution effects

Rain ingress, cooling water, and mixing in the final tank can mask the true quality. Stored or batch discharge works the other way. The effluent can look fine for hours, then a concentrated slug leaves the plant. In many plants, the variation between a calm period and a peak period can be roughly 20 to 40 percent or more, and that’s enough to cross a limit.

Composite versus instantaneous results

A composite sample averages out the peaks. A sensor reading is instantaneous. If your lab reports a composite and the regulator sees instantaneous trends, the two will never match perfectly, and that gap is where many show-cause notices begin.

Lab method versus sensor method

The lab measures COD or BOD by a defined chemical or biological method. The sensor estimates the same parameter optically. The two methods respond differently to color, turbidity, and organics, so some difference is expected even when everything is working.

Note: The values and ranges mentioned here are general indications only. Actual figures differ from one ETP to another based on industry type, process load, design, and operating conditions.

Why Continuous Monitoring Catches What Spot Tests Miss

Why Continuous Monitoring Catches What Spot Tests Miss

Continuous systems don’t take breaks, don’t know your schedule, and don’t forgive a bad hour. Here’s what they actually pick up.

The sensing principle

Many analyzers use a UV-Vis spectrophotometer COD sensor, which estimates COD, and sometimes BOD and TSS, from how the effluent absorbs light. It reacts quickly to changes in color, turbidity, and dissolved organics. A burst of dye, a puff of solids, or a stronger organic slug shows up almost immediately.

Real operational events

Peak hydraulic surges, shift change discharges, CIP cycles, and batch dumping all produce short, sharp excursions. A grab sample rarely lands on them. A sensor always does.

Probe drift and calibration gaps

Optical sensors drift over time. If calibration is late or the reference isn’t checked against the lab, the baseline slowly moves and readings look worse (or better) than reality.

Bio-fouling and scaling

OCEMS probe drift and bio-fouling often go together. A slimy film on the probe window, scale in the sample line, or a dirty flow cell can push readings up without any real change in effluent quality.

Sensor location and conditioning

Where the sample is drawn and how it’s conditioned (filtered, settled, pumped) affects the reading. A poorly placed line can pick up settled solids or air bubbles.

The honest part: sometimes the sensor is wrong

Not every red alert is a real breach, and blaming the plant blindly is as unhelpful as blaming the instrument blindly. Good practice is to validate: compare OCEMS readings against regular lab results, look at the correlation over weeks, and check whether spikes line up with real events in the plant log. If a spike has no operational explanation and disappears after cleaning the probe, you’ve likely found a sensor issue. If it follows a batch discharge or a clarifier upset, it’s real.

Plant Reality Check

Most “mystery” spikes aren’t mysterious. Pull your shift log, your discharge schedule, and your alert time-stamps side by side. In many plants, the spike and the event are sitting in the same hour, and nobody had put the two sheets next to each other.

The Biological Root Causes Behind Hidden Parameter Spikes

The Biological Root Causes Behind Hidden Parameter Spikes

Even when the sensors are perfect, the biology decides what the sensor sees. Short-lived peaks of COD BOD TSS spikes in effluent usually start in the biological stage.

Unstable biomass

When the incoming load swings widely, the microbial population can’t keep pace. A weak or fluctuating biomass degrades organics unevenly, and the outlet quality follows the same pattern.

Nutrient imbalance and oxygen gaps

Missing nitrogen or phosphorus slows degradation. Low dissolved oxygen zones and uneven aeration leave parts of the tank under-performing, even if the average DO looks acceptable.

Sludge bulking and clarifier carryover

In Sludge Bulking – Filamentous growth, floc breakup, or a hydraulic push through the secondary clarifier carries solids over the weir. That drives TSS up, and since those solids carry organic matter, COD rises with them.

Toxic and inhibitory shocks

A sudden dose of biocide, strong acid or alkali, or a concentrated process stream can suppress the microbes. The real damage isn’t just the shock itself. It’s the slow recovery that follows, with poor quality for hours or even days.

Color and recalcitrant organics

Some compounds, especially in dye, chemical, and pharma streams, aren’t broken down by ordinary biomass. They pass through, and an optical sensor notices them quickly.

Note: The values and ranges mentioned here are general indications only. Actual figures differ from one ETP to another based on industry type, process load, design, and operating conditions.

Talk to Team One Biotech’s technical team for a plant-specific assessment. We’ll help you trace whether your spikes begin in the sensor, the process, or the biology.

How to Flatten the Spikes and Achieve True 24/7 Compliance

You can’t remove every disturbance, but you can stop the plant from passing them straight to the outlet. Here’s how plants typically do it.

1. Equalization: smooth the load before it reaches the biology

A well-designed equalization tank ETP buffers flow and load so the biological stage sees a steadier feed. Check three things: whether the tank is sized for your actual peak pattern, whether it’s mixed properly so concentrated slugs don’t sit in dead zones, and whether pumping is controlled rather than surge-driven. Pumping on a gentle, steady profile often does more for your OCEMS trend than any single equipment upgrade.

2. Biological stabilization: build a population that can take a hit

Biological stabilization of ETP means keeping a strong, diverse, active microbial community that handles load swings and recovers quickly. This is where bioremediation for effluent treatment becomes a practical tool. Team One Biotech’s bioremediation solutions are used to support stable biology, improve shock-load resilience, and help the plant return to normal faster after a disturbance. The goal is consistent effluent quality, not a promise of zero violations. Results depend on the plant’s design, load, and how well the basics are managed.

3. Process control: keep the basics tight

Control dissolved oxygen so no zone starves. Dose nutrients to match load. Watch the food-to-microorganism balance and manage sludge age deliberately instead of by habit. Many bulking and carryover problems trace back to drift in these basics.

4. OCEMS hygiene: treat the analyzer like process equipment

Schedule cleaning, calibrate on time, and validate against lab results regularly. Set internal alert thresholds below your regulatory limits so the team gets an early warning, not a notice. A hydraulic surge and shock load in ETP rarely appears out of nowhere. The trend usually starts climbing before the breach.

5. Operations discipline: plan discharge, don’t just react to it

Plan shift-wise discharge, schedule batch dumps and CIP drains so they don’t stack up, and make real-time dashboard review part of the shift routine. When the plant team sees the data before the regulator’s server does, the whole conversation changes.

Note: The values and ranges mentioned here are general indications only. Actual figures differ from one ETP to another based on industry type, process load, design, and operating conditions.

Request a free consultation or ETP performance review from Team One Biotech.

A Quick Self-Check Before the Next OCEMS Compliance Failure

Ask these questions about your own plant:

  • Do our grab samples follow a fixed routine that operators can predict?
  • Have we compared OCEMS trends against lab results in the last few weeks?
  • Is the equalization tank mixed well, and is outflow controlled rather than surge-driven?
  • Do our alert thresholds sit below regulatory limits for early warning?
  • When was the last time the probe, sample line, and flow cell were cleaned and calibrated?
  • Do batch discharges and CIP drains overlap with shift changes?
  • Do we see DO, MLSS, and nutrient trends daily, or only when something goes wrong?
  • Does the plant team review the live dashboard, or only the lab team?

If you answered “no” or “not sure” to more than a few, you’ve found your starting point.

Frequently Asked Questions

Why does my ETP pass lab tests but fail OCEMS limits?

Lab tests capture a single moment, while OCEMS records the entire day. Peaks from surges, batch discharges, and clarifier carryover appear in continuous data but are easy to miss in a scheduled sample.

Can OCEMS sensor drift cause a false compliance failure?

Yes. Drift, bio-fouling, and poor sample conditioning can push readings away from true values. Regular calibration and correlation checks against lab results help separate sensor error from real excursions.

How can an equalization tank reduce COD and TSS spikes in online monitoring?

It buffers flow and load, so the biological stage receives a steadier feed. With proper mixing and controlled pumping, sudden slugs are diluted and the clarifier is less likely to be overloaded.

Can bioremediation help prevent OCEMS compliance failure?

It can support the biological side by building a more stable, shock-resilient microbial population that recovers faster. It works best alongside good equalization, process control, and OCEMS maintenance.

Conclusion

An OCEMS compliance failure rarely means your team isn’t trying. It usually means the plant behaves differently across the day than a single sample can show. Better equalization, stronger biology, disciplined operations, and a well-kept analyzer close that gap.

Please confirm requirements with your SPCB consent conditions and applicable CPCB directions.

Don’t wait for the next show-cause notice to find out what your OCEMS data has been telling you. Talk to Team One Biotech’s bioremediation experts today, and get your plant reviewed.

Looking to improve your ETP/STP efficiency with the right bioculture?
Talk to our experts at Team One Biotech for customised microbial solutions.

Contact: +91 8855050575

Email:  sales@teamonebiotech.com

Visit: www.teamonebiotech.com

Discover More on YouTube – Watch our latest insights & innovations!-

Connect with Us on LinkedIn – Stay updated with expert content & trends!
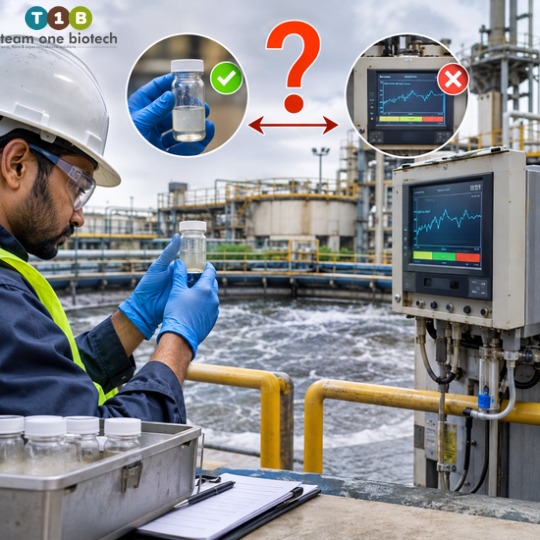
SPCB Show-Cause Notice for Your STP? A 30-Day Response Framework

You know the feeling. The email lands, or the courier hands over the envelope, and your stomach drops. A show-cause notice. Your mind jumps straight to the worst outcomes: power or water disconnection, action on your bank guarantee, a direction of closure, and a very uncomfortable conversation with residents, tenants, or management.

Take a breath. A notice is serious, but it isn’t the end of the road. A show-cause notice is a formal request from your State Pollution Control Board (SPCB) asking you to explain, in writing, why action shouldn’t be taken for non-compliance. It sits within the powers the board holds under Section 33A of the Water (Prevention and Control of Pollution) Act, 1974. In general terms, that includes issuing directions, including closure and the stoppage or regulation of electricity or water supply.

This guide gives you a clear, week-by-week plan to fix what’s failing and build a strong SPCB show cause notice reply. It’s a general compliance framework, so please involve your legal or compliance team from day one.

The 30-Day Roadmap at a Glance

The 30-Day Roadmap at a Glance

WeekGoalKey Output
Week 1 (Days 1 to 7)Stabilize and investigateNotice analysis, root-cause findings, stabilized operations
Week 2 (Days 8 to 14)Restore biological performanceBioaugmentation plan, daily monitoring records
Week 3 (Days 15 to 21)Verify with dataNABL-accredited lab reports, organized documentation
Week 4 (Days 22 to 30)Draft and fileEvidence-backed reply, proof of submission

These are general values. Actual figures differ for every STP and ETP based on design, load, and site conditions.

What an SPCB Show-Cause Notice for an STP Really Means

What an SPCB Show-Cause Notice for an STP Really Means

A notice rarely comes out of nowhere. Usually, something triggered it: a routine inspection, a sampling visit, a complaint from neighbors, or lab results that showed your treated effluent didn’t meet the prescribed standards. This is what we call STP effluent non-compliance.

The parameters most often flagged are BOD (biochemical oxygen demand, the amount of oxygen microbes need to break down organic matter), COD (chemical oxygen demand, a broader measure of pollutants), TSS (total suspended solids), and FOG (fats, oils, and grease). Sometimes pH, ammoniacal nitrogen, and coliform counts appear too. Your treated water is measured against CPCB discharge norms and any specific limits your SPCB has set for your site.

Is a pollution board notice ETP different from an STP notice?

Not in the way that matters. Whether it’s a pollution board notice ETP (effluent treatment plant, usually industrial) or one for an STP (sewage treatment plant, usually residential or commercial), the logic is the same. The board has found a gap between what your plant discharges and what it’s supposed to discharge, and it wants a written explanation and a fix.

Show-cause notice vs. direction of closure

Think of it as an escalation path. A show-cause notice is the board asking you to explain. If the explanation or the corrective action isn’t convincing, the next step can be a formal direction, which may include closure and stoppage or regulation of power or water supply. A direction of closure for an STP is the stage you want to avoid, and this is exactly why your first response matters.

Possible consequences, if things escalate:

  • Environmental compensation or penalties
  • Action on the bank guarantee
  • Stoppage or regulation of electricity or water supply
  • A direction of closure
  • Reputational damage with residents, tenants, customers, and regulators

Received a notice today? Speak to a Team One Biotech compliance expert before your timeline runs out.

Week 1 (Days 1 to 7): Stabilize and Investigate

Week 1 (Days 1 to 7): Stabilize and Investigate

The first week is about two things: understanding exactly what the board is saying, and finding out why your plant failed. Don’t skip straight to fixes. A fix without a diagnosis is just a guess.

Read the notice line by line

Sit down with the document and highlight everything. Note the reply deadline, the parameters cited, the sampling dates, the sampling location, and exactly what the board is asking you to submit. Missing a small detail here can cost you later.

Assemble your response team

You need the right people in the room early:

  • Your plant operator, who knows the daily reality
  • The EHS head or facility director
  • Your legal or compliance team
  • An external microbial or process expert who can look at the plant with fresh eyes

Run a root-cause audit

This is the heart of the first week. A proper root cause analysis for your STP looks at what changed before the failure. Ask these questions:

  • Did the inflow load or flow pattern change, perhaps from new occupancy, a new kitchen, or a seasonal shift?
  • Did aeration fail or weaken? Check blowers, diffusers, and dissolved oxygen levels.
  • Is sludge age off, or has sludge built up or been wasted too aggressively?
  • Is there short-circuiting in tanks, so that water isn’t getting its full treatment time?
  • Were there chemical dosing errors?
  • Is FOG overloading the system from kitchens, canteens, or food outlets?

Don’t forget equipment health. Pumps, blowers, diffusers, and clarifier mechanisms all need an honest inspection.

Start immediate stabilization

You don’t need to wait for the full audit to stop the bleeding. Keep the steps general and safe:

  • Balance the inflow load with an equalization tank where available
  • Correct aeration so the biology gets the oxygen it needs
  • Manage sludge by removing excess and avoiding carryover
  • Control FOG at the source with grease traps and cleaning schedules
  • Fix obvious mechanical faults right away

Document everything you do and when you do it. This record becomes part of your reply later.

Week 2 (Days 8 to 14): Biological Recovery with Fast-Track Bioaugmentation

Week 2 (Days 8 to 14): Biological Recovery with Fast-Track Bioaugmentation

Here’s the plain truth about most STP failures. The machinery is usually fine. The microbes are struggling.

Your plant depends on a living microbial population to break down pollutants. When that population is shocked by a toxic load, starved of oxygen, or simply outnumbered, treatment performance collapses. BOD, COD, TSS, and FOG numbers drift out of limits, and a notice follows.

What bioaugmentation actually does

Bioaugmentation for STP means introducing selected, high-performing microbial cultures into the treatment system to strengthen or rebuild the working population. Microbial re-seeding is closely related. It restores the biology after a shock event, a shutdown, or a major washout. Done properly, these approaches help the system recover its ability to degrade organic load, reduce suspended solids, and break down grease.

How a structured program works

A credible program isn’t a bucket of powder tossed into a tank. It typically follows a clear sequence:

  • Baseline testing. Measure current performance and understand the inflow characteristics.
  • Tailored strain selection. Choose microbial cultures that suit your wastewater, whether it’s high in grease, high in organic load, or nitrogen-heavy.
  • Dosing schedule. Apply cultures at planned intervals, usually over a period of a few days to a couple of weeks depending on conditions.
  • Monitoring. Track parameters regularly and adjust the program based on what the data shows.

Many plants begin to see measurable improvement within a window of a few days to a few weeks, but this varies widely.

These are general values. Actual figures differ for every STP and ETP based on design, load, and site conditions.

At Team One Biotech, this is what we do every day as a provider of bioremediation solutions in India. We work with plant teams to design a recovery plan around their specific wastewater, not a generic one. You can explore our bioaugmentation for STP range and our wider effluent treatment solutions for both STP and ETP effluent treatment.

Need a fast-track bioaugmentation plan for your STP? Request a free effluent assessment, Contact a free assessment from Team One Biotech.

What to monitor daily

  • Dissolved oxygen in the aeration tank
  • pH of the incoming and treated water
  • Visual checks: color, odor, foam, and sludge settling
  • Sludge volume and settling behavior
  • Treated water clarity at the outlet
  • Equipment running hours and any faults

For deeper guidance on the numbers themselves, see our related blog on how to reduce BOD and COD in your STP.

Week 3 (Days 15 to 21): Verify with Data and Document Everything

By now your plant should be responding. But the board won’t take your word for it, and honestly, you shouldn’t take your own either. This week is about proof.

Collect samples at defined points, typically the inlet, the aeration tank, and the final outlet. Send them to a NABL-accredited laboratory. NABL stands for the National Accreditation Board for Testing and Calibration Laboratories, and accreditation tells the reader that the lab follows recognized testing standards.

Why does this matter so much? Because in-house readings, however careful, are easy to question. A third-party certified report carries independent weight. It tells the board you’ve measured honestly and that you’re serious about compliance.

Compare your results against the limits that apply to you, meaning the CPCB norms and the specific limits stated in your SPCB notice or consent conditions. Always treat your SPCB’s stated limits as the final reference.

Keep these documents ready:

  • NABL lab reports with sampling dates and locations
  • Operator logbooks and daily operating data
  • Dosing records for any bioaugmentation or chemicals
  • Calibration records for meters and instruments
  • Dated photographs of equipment, repairs, and the plant
  • Maintenance records and work orders
  • Any correspondence with the board

If your results show improvement but sit close to the limit, don’t panic. Plants often need a few more days to a couple of weeks to settle into steady performance after biological recovery.

These are general values. Actual figures differ for every STP and ETP based on design, load, and site conditions.

Want a second pair of eyes on your reply and lab data? Share your notice and parameters with our team. We’ll tell you honestly where you stand.

Week 4 (Days 22 to 30): Draft and File a Strong SPCB Show Cause Notice Reply

This is where all your work turns into a document the board will actually read. A strong SPCB show cause notice reply doesn’t need to be long. It needs to be clear, honest, and backed by evidence.

What a credible show cause reply contains

  • Acknowledgment. Confirm receipt of the notice and its reference details.
  • Root cause. State plainly what went wrong, based on your audit.
  • Corrective actions taken. List what you did, with dates.
  • Verifiable lab evidence. Attach your NABL-accredited reports.
  • An engineering compliance timeline. Share a realistic schedule for any remaining work. This is your STP compliance action plan.
  • A preventive maintenance plan. Show how you’ll keep the plant stable going forward.

Tone matters

Keep it factual, respectful, and evidence-led. Don’t make excuses. Don’t blame the board, the contractor, or the residents. Boards respond far better to accountability than to defensiveness. Own the problem, show the fix, and demonstrate the plan.

Submit properly

File within the deadline stated in the notice. Keep proof of submission, whether that’s a stamped copy, a courier receipt, or an email acknowledgment. If your situation calls for it, consider requesting a re-inspection or a hearing so the board can see the improvements for itself. Your legal or compliance team should guide this step.

Before you hit send

  • Does the reply address every point raised in the notice?
  • Are all lab reports attached, legible, and dated?
  • Do the numbers in your text match the lab reports exactly?
  • Is the timeline realistic and not overpromised?
  • Has your legal or compliance team reviewed it?
  • Have you kept a complete copy and proof of submission?

Common Mistakes That Weaken Your Show Cause Reply

After seeing plants go through this process, certain patterns show up again and again. Avoid these:

  • Waiting too long to act. Every day spent hoping the problem goes away is a day lost from your response window.
  • Relying on in-house readings only. Without independent lab proof, your claims are easy to dismiss.
  • Ignoring root causes. If you treat only the symptom, the failure will come back.
  • Submitting without lab evidence. A reply with no data is just a promise.
  • Overpromising timelines. A deadline you can’t meet damages your credibility more than a realistic, longer one.
  • Treating a quick fix as a permanent fix. A short-term improvement isn’t the same as sustained compliance. Plan for the long run.

Frequently Asked Questions

How long do I have to reply to an SPCB show-cause notice?

The deadline is stated in the notice itself, and it varies from one board and one case to another. Many notices allow somewhere from a few days to a few weeks. Always follow the exact timeline in your notice. If you need more time, speak to your legal team about requesting an extension in writing before the deadline passes.

Can bioaugmentation help bring my STP within limits quickly?

It can help, especially when the root cause is a weakened or shocked microbial population. Many plants see early improvement within a few days to a few weeks. However, results depend on your design, load, and site conditions, and bioaugmentation works best alongside proper mechanical and operational fixes. It supports compliance but doesn’t guarantee a specific outcome.

Do I need a NABL-accredited lab report for my reply?

It’s strongly advisable. Independent, accredited lab results make your reply far more credible than in-house readings. Check your notice and consent conditions for any specific laboratory requirements, and follow what your SPCB asks.

What happens if my STP still fails after the reply?

The board may review your reply, order a re-inspection, ask for further action, or escalate to formal directions under its powers, which in general terms can include closure or stoppage or regulation of utilities. This is why genuine corrective action and clear lab evidence matter. Involve your legal or compliance team and keep the board informed of your progress.

Do Not Let a Notice Become a Closure

Here’s the 30-day framework in a nutshell. Stabilize and investigate in week one. Rebuild your plant’s biology in week two. Prove it with accredited data in week three. File a clear, honest, evidence-backed SPCB show cause notice reply in week four.

A notice feels like a verdict, but it’s really a deadline with a path through it. Plants that act early, document well, and respond with humility give themselves the strongest possible case. You don’t have to figure it out alone.

Your 30-day clock is already ticking. Contact Team One Biotech now and move from notice to compliance with a clear plan. 

Disclaimer: The values, ranges, and timelines shared in this article are general indicators only. They differ for every STP and ETP depending on inflow characteristics, treatment technology, capacity, and the specific conditions in your notice. Always follow the limits and directions stated by your SPCB and consult a qualified professional before acting.

Looking to improve your ETP/STP efficiency with the right bioculture?
Talk to our experts at Team One Biotech for customised microbial solutions.

Contact: +91 8855050575

Email:  sales@teamonebiotech.com

Visit: www.teamonebiotech.com

Discover More on YouTube – Watch our latest insights & innovations!-

Connect with Us on LinkedIn – Stay updated with expert content & trends!

Hotel and Hospitality Wastewater: Compliance for the Sector

It is a full-occupancy Saturday. A wedding party is arriving, the kitchen is running flat out, and a guest at the front desk mentions a smell near the lobby. Then the duty manager tells you the pollution control board inspector is at the gate.

Every chief engineer knows that sinking feeling. Hotel wastewater treatment is the quiet system that guests never think about until it fails, and by then the damage reaches reviews, renewals and reputation.

Hotel wastewater treatment is the process of cleaning sewage, kitchen effluent and laundry discharge so it can be reused or released within legal limits. This guide covers the compliance framework, the parameters that matter, the failures we see most often, and the practical steps that keep your plant steady.

Why Hotel Wastewater Is Harder to Treat Than Most Other Sectors

Why Hotel Wastewater Is Harder to Treat Than Most Other Sectors

A residential society produces a fairly predictable load. A hotel does not. Your plant has to cope with a mix that changes by the hour and by the season.

  • Variable hydraulic loading. Weekend surges, banquets, conferences and festival occupancy can push flow far above the weekday average, then drop it overnight.
  • Heavy kitchen FOG. Fats, oils and grease from commercial kitchens coat pipes, choke equalization tanks and starve the biology of oxygen.
  • Laundry chemistry. Detergents, bleach, softeners and disinfectants arrive in bursts and can suppress the microbes your plant depends on.
  • Tight space. Many hotel STPs sit in basements or close to guest rooms, with little room for large tanks or generous retention.
  • Zero tolerance for odor. A farm-side plant can tolerate a whiff. A hotel cannot.
  • Staff turnover. Operators change, and undocumented know-how leaves with them.

Put these together and you get a plant that is always one bad weekend from trouble. Hospitality wastewater management is less about one big fix and more about many small disciplines done consistently.

Understanding the Compliance Landscape for Hotels

In India, hotels generally face three layers of rules, and your plant has to satisfy whichever apply to your discharge route.

CPCB and SPCB discharge norms

The Central Pollution Control Board sets national standards for treated sewage from urban STPs, and State Pollution Control Boards apply them through consent to operate conditions. Some states and sensitive zones impose tighter limits than the national baseline. Your consent letter is the document that actually binds you, so read it closely.

Municipal sewer inlet criteria

If you discharge into a city sewer instead of a water body or land, the local authority sets its own acceptable ranges. These are usually more relaxed for organics but can be strict on oil and grease, pH and certain chemicals.

Zero Liquid Discharge for hotels

ZLD mandates are increasingly attached to environmental clearances for larger hospitality projects, water-stressed regions and sites near sensitive water bodies. In practice, ZLD means all treated water is reused on site for flushing, cooling towers, gardening and housekeeping, with nothing leaving the boundary. It raises the bar on reuse water quality because there is no sewer to fall back on.

Here are the parameters that inspectors and your own operators watch most closely.

BOD (Biochemical Oxygen Demand)

BOD tells you how much oxygen microbes consume to break down organic matter. Treated outlet values for surface discharge or reuse commonly fall in the range of 10 to 30 mg/L, while raw hotel wastewater can sit far higher. A creeping BOD is usually the first sign the biology is struggling.

COD (Chemical Oxygen Demand)

COD measures everything that can be chemically oxidized, including compounds microbes cannot easily digest. Treated values are often expected in the range of 50 to 250 mg/L depending on the discharge route. A wide gap between COD and BOD points toward chemical load from laundry or housekeeping.

FOG (Fats, Oils and Grease)

FOG is the hospitality sector’s signature problem. Acceptable levels are typically in the range of 5 to 20 mg/L at discharge, and sewer authorities can be stricter. Beyond compliance, grease forms mats, blocks diffusers and causes foul smells.

Total Coliform

Total coliform indicates pathogen risk. Treated, disinfected water is commonly expected to stay within the range of 100 to 1,000 MPN per 100 mL, and reuse applications can demand the lower end. This matters most to guests and staff who come into contact with reused water.

Turbidity

Turbidity is the haziness of treated water. Reuse water is often targeted in the range of 2 to 10 NTU. Cloudy flush water or discoloured cooling tower makeup is something guests and maintenance teams notice immediately.

These are general values and may vary. Actual parameters differ for every ETP or STP depending on design, load, and local regulatory requirements.

Common Compliance Failures in Hotel ETPs and STPs

Common Compliance Failures in Hotel ETPs and STPs

Most failures are not mysterious. They repeat from property to property.

  • Grease choking. FOG bypasses a poorly maintained trap, coats pipes and lifts BOD at the outlet.
  • Foaming. Often tied to detergents or a stressed, unbalanced microbial population.
  • Sludge bulking. Sludge fails to settle, solids carry over to clarifiers and outlet quality drops.
  • Microbial shock. A burst of disinfectant or bleach from laundry or housekeeping knocks back the biology for days.
  • Persistent odor. Hydrogen sulfide and other gases escape from anaerobic pockets in tanks, sumps and sludge.
  • Inconsistent reuse water quality. Turbidity, color or residual smell varies from one day to the next.
  • Gaps in records. Missing logs, uncalibrated meters and unclear sampling schedules undermine even a technically sound plant during inspection.

If two or three of these sound familiar, you are in good company. Most plants we are called to look at have a combination.

Not sure where your plant stands? You can request a plant health review from Team One Biotech and get a clear picture of biology, loading and odor risk before an inspector does.

Practical Strategies for Hotel ETP Compliance

Practical Strategies for Hotel ETP Compliance

Segregate Greywater and Blackwater

Blackwater from toilets and greywater from showers, basins, laundry and kitchens behave very differently. Mixing them early makes the whole stream harder to treat, because strong organic load, grease and chemicals all land in the same tank.

Where the building design allows, greywater and blackwater segregation at the source lets you treat each stream on its own terms. Greywater can often be treated and reused with simpler processes, while blackwater gets the full biological treatment. Even in existing buildings, separating the kitchen and laundry lines before the main STP can make a visible difference.

Control FOG at the Source

The cheapest grease to treat is the grease that never reaches your plant. FOG management in commercial kitchens starts with discipline, not chemistry.

  • Fit properly sized grease traps and clean them on a fixed schedule, not when someone notices a smell.
  • Train kitchen staff to scrape plates and wipe pans before washing, and to keep used oil out of drains.
  • Check that traps are not being bypassed during peak service.
  • Add a biological grease degradation program, using selected microbes that break fats into simpler compounds, to keep traps and lines from turning into solid blocks between cleanings.

Biology supports good housekeeping. It does not replace it.

Manage Peak Hydraulic Loads

Peak load management in STPs is where many hotel plants quietly fail. A plant designed around an average day will struggle on the busiest one.

  • Use an equalization tank to smooth surges. Many hotels aim for holding capacity in the range of 4 to 8 hours of average flow, though design varies widely.
  • Aerate the equalization tank gently to prevent septic conditions and odor.
  • Pace transfer pumps so the biological tank sees a steadier flow.
  • Plan ahead for events. Tell the plant operator when large banquets or full-house weekends are coming, so aeration and dosing can be adjusted.
  • Build microbial resilience. A healthy, diverse and well-fed culture recovers faster after a surge than a thin one.

These are general values and may vary. Actual parameters differ for every ETP or STP depending on design, load, and local regulatory requirements.

Protect the Biology from Laundry Chemicals

Your plant is a living system. Bleach, quaternary disinfectants and strongly alkaline or acidic wash water do not care how well you designed the aeration.

  • Ask the laundry team which chemicals are used and in what quantities.
  • Route laundry wastewater through an equalization step so it does not hit the biology in one slug.
  • Check pH before the stream enters the main plant. Many biological systems work best in a near-neutral band, often in the range of 6.5 to 8.5.
  • Where possible, shift toward lower-toxicity detergents and avoid draining concentrated disinfectant directly.

Laundry wastewater treatment does not have to be elaborate. It needs to be consistent and predictable.

Eliminate Odor at the Root, Not with Masking Agents

Spraying fragrance around the STP room fixes nothing. Hotel STP odor control begins with understanding why the smell exists.

Odor usually comes from anaerobic zones where oxygen runs out and microbes produce sulfur compounds and amines. Look for dead spots in aeration, accumulated sludge, grease mats, overloaded equalization tanks and poorly ventilated sumps.

Fix the oxygen distribution, remove the sludge and grease that feed the problem, and keep the biology active. Odor then falls as a by-product of a healthier plant. Masking agents only hide the symptom until the next inspection.

How Bioremediation Supports Hotel Wastewater Treatment

Bioremediation sounds technical, but the idea is simple. Your STP already relies on microbes to digest waste. Bioremediation for STP and ETP adds carefully selected strains and supporting nutrients so those microbes work harder, recover faster and tolerate stress better.

In a hotel setting, this helps in four practical ways.

It targets what the plant struggles with

Specific microbial blends are chosen to break down fats, oils, proteins and surfactants that standard sewage bacteria handle slowly.

It stabilizes the biology under shock

After a surge in flow or a burst of cleaning chemicals, a reinforced microbial population tends to bounce back sooner, which protects your outlet quality.

It reduces sludge

More complete digestion of organics can mean less sludge to handle, lower disposal frequency and better settling behavior.

It cuts odor at the source

By limiting anaerobic conditions and breaking down the compounds that cause smell, biological wastewater treatment for hotels supports odor control from the inside.

At Team One Biotech, we develop and manufacture bioremediation solutions for STPs and ETPs, and we work with hospitality teams to match products and dosing plans to the actual plant, not a generic brochure. Results depend on design, loading, mechanical condition and operating practice. Bioremediation is one part of a well-run plant. It is not a substitute for proper aeration, maintenance or kitchen discipline.

Want a straight opinion on your hotel’s STP? Talk to Team One Biotech’s technical team about your plant’s loading, grease and odor profile.

A Quick Compliance Checklist for Hotel Engineers

Screenshot this and keep it on your phone.

  • Confirm your current consent to operate and its discharge conditions
  • Know which route applies: surface water, land, municipal sewer or ZLD reuse
  • Test BOD, COD, FOG, coliform and turbidity on a fixed schedule
  • Keep sampling logs, calibration records and operator shift notes up to date
  • Inspect and clean grease traps on a documented schedule
  • Separate kitchen and laundry lines before the main plant where possible
  • Check equalization tank aeration and level daily
  • Monitor pH and chemical load from laundry and housekeeping
  • Watch dissolved oxygen, sludge settling and foam patterns
  • Plan for event and peak-season loads in advance
  • Maintain blowers, diffusers, pumps and disinfection units
  • Train every new operator, and keep a simple handover document
  • Review reuse water quality at the points of use, not just at the outlet
  • Do a mock inspection before the real one

Disclaimer: All numerical values in this article are indicative ranges only. They vary by plant design, load, location and regulatory category. Always confirm applicable limits against the current CPCB norms, your SPCB consent conditions and local authority requirements before making operational or compliance decisions.

Frequently Asked Questions

What are the compliance requirements for hotel wastewater in India?

Hotels generally need consent to operate from the State Pollution Control Board, with treated water meeting CPCB-aligned standards or tighter state limits. If you discharge to a municipal sewer, local inlet criteria apply as well. Large or sensitive projects may also carry ZLD or reuse conditions tied to their environmental clearance.

Why does a hotel STP smell, and how can it be fixed?

Smell usually signals anaerobic conditions caused by poor biology, sludge buildup, grease accumulation or overloaded tanks. Fixing it means restoring oxygen, removing the organic feed for odor-forming microbes, and strengthening the healthy biology. Masking sprays offer only temporary relief.

Can treated hotel wastewater be reused on site?

Yes. Treated water is commonly reused for toilet flushing, cooling tower makeup, landscaping and housekeeping, subject to quality checks on turbidity, disinfection and odor. Treated water reuse in hotels also reduces freshwater demand and is a core part of ZLD strategies.

How does bioremediation help with kitchen grease in an ETP?

Selected microbes produce enzymes that break fats and oils into smaller compounds that other bacteria can digest. Used alongside well-maintained grease traps, this reduces grease buildup, line blockages and the odor that comes with decomposing fat. Performance depends on temperature, dosing and the nature of the kitchen load.

Make Your Next Inspection Uneventful

Good hotel wastewater treatment is rarely dramatic. It comes from separating streams early, keeping grease out, smoothing peak loads, protecting the biology from harsh chemicals and fixing odor at its root. Those habits are what make hotel ETP compliance routine instead of stressful.

If your plant has struggled with foaming, smell or inconsistent reuse water, do not wait for the unannounced inspection or the next guest complaint to force the issue. Book a site assessment with Team One Biotech before your next audit. Our team will look at your actual plant, your actual load and your actual regulatory conditions, and give you a practical plan.

Looking to improve your ETP/STP efficiency with the right bioculture?
Talk to our experts at Team One Biotech for customised microbial solutions.

Contact: +91 8855050575

Email:  sales@teamonebiotech.com

Visit: www.teamonebiotech.com

Discover More on YouTube – Watch our latest insights & innovations!-

Connect with Us on LinkedIn – Stay updated with expert content & trends!
Scan the code