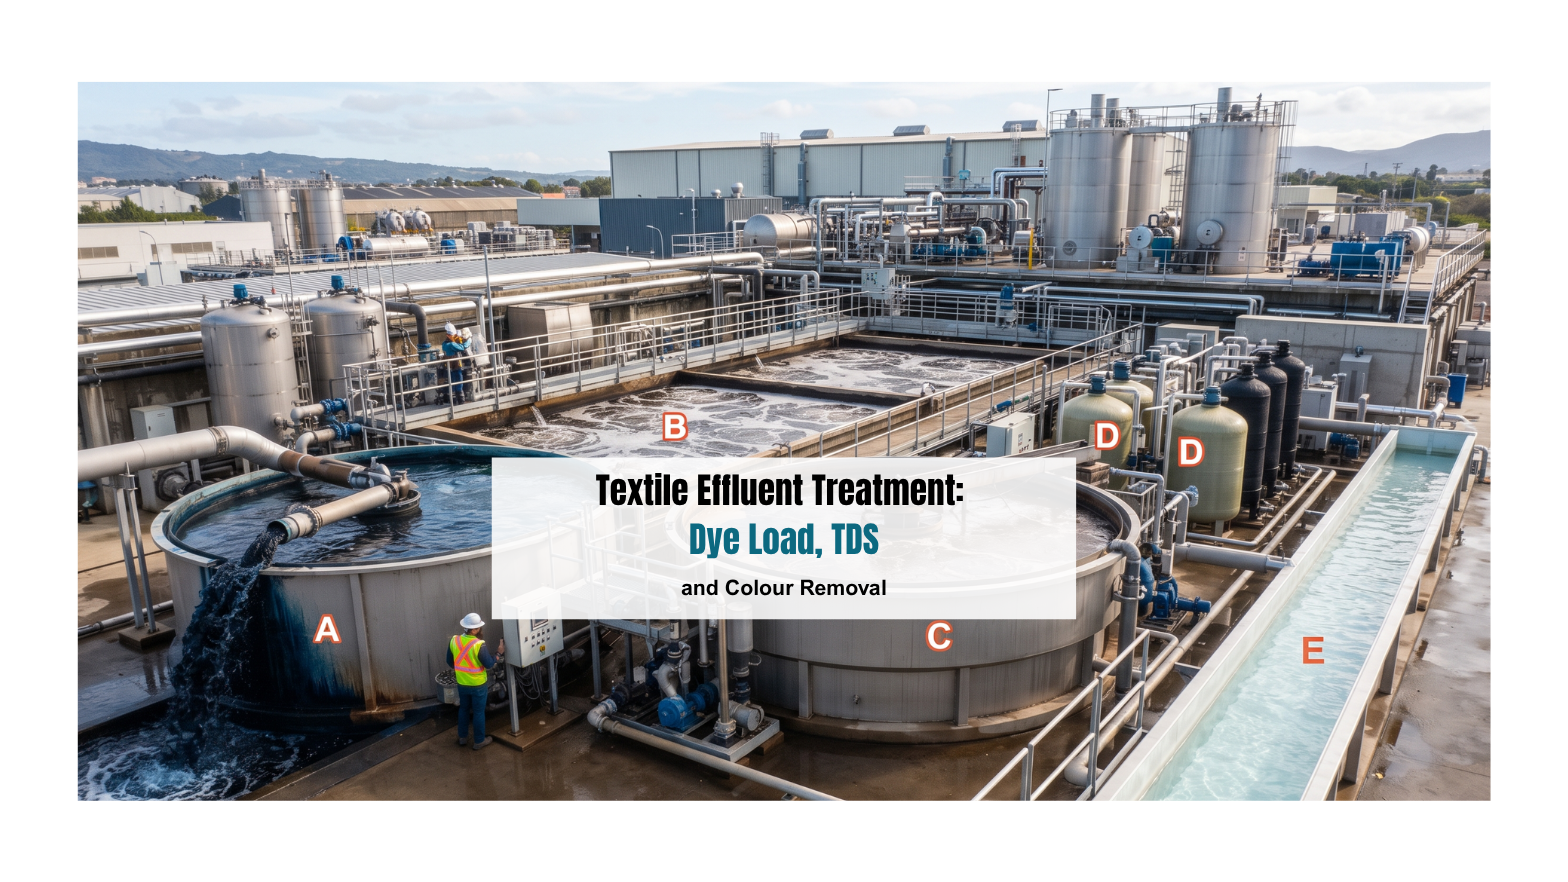

Textile Effluent Treatment: Dye Load, TDS and Colour Removal
It’s the middle of the dye-season peak. A big lot has just changed over, and the clarifier outlet is running a deep, stubborn shade that wasn’t there at the start of the shift. You’ve raised the alum dose. Then the ferrous sulfate. Maybe the chlorine bleaching step too. The colour dips for a while, then comes right back, and the sludge bill climbs another notch.
If that sounds familiar, you’re not doing anything wrong. You’re fighting a stream that chemistry alone was never built to win against. Dependable dye wastewater treatment in a textile ETP needs biology doing the heavy lifting, with chemicals in a supporting role.
This guide walks through why textile effluent is so difficult, where chemical-heavy routes fall short, and how a well-run anaerobic-aerobic system backed by a textile effluent bioculture can bring colour, COD and BOD under control.
Why textile wastewater is one of the hardest streams to treat
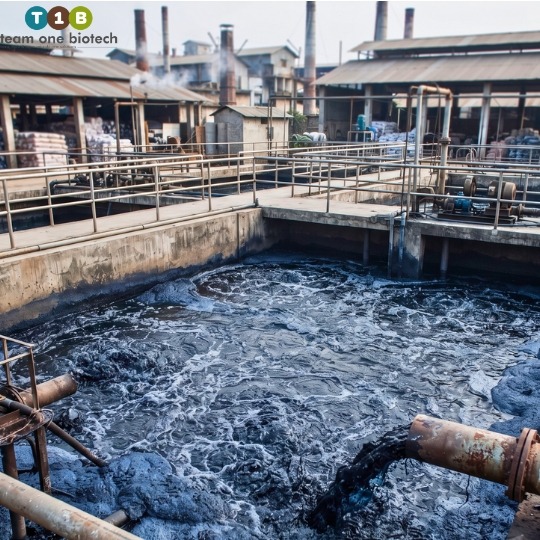
A wet-processing unit doesn’t produce one effluent. It produces several, changing hour by hour with whatever is running on the floor. Desizing, scouring, bleaching, dyeing, soaping and finishing each add their own load. By the time everything reaches your equalisation tank, you’re treating a moving target.
Here’s what makes textile effluent treatment so demanding:
- pH swings. Alkaline scouring liquor meets acidic washes, and pH can commonly swing between 4 and 12 in a single day. These are general values and will differ from one ETP to another. Microbes don’t cope well with that kind of whiplash.
- Azo and reactive dyes. These dyes are designed to resist fading, which also means they resist breakdown. The azo bond is stubborn, and hydrolysed reactive dye that never fixed to the fibre goes straight to drain.
- Persistent colour. Even a small residual dye load shows at the outlet. Colour absorbance is often the first parameter to attract an inspector’s attention.
- High TDS. Salt, soda ash and sulphates used for exhaustion and fixation can push high TDS textile wastewater into the thousands of mg/L. These are general values and will differ from one ETP to another.
- Toxic auxiliaries. Levelling agents, dispersants, surfactants, biocides and metal-bearing dyes can inhibit the very organisms you rely on.
- Fluctuating flow and load. Shade changes, wash cycles and shift patterns mean the effluent characterisation you did last quarter may not describe today’s stream.
The result is a wastewater that can look acceptable on average and still fail on a bad day. A scheme designed around mean values often falls apart at the first hard changeover.
Why chemical-heavy treatment keeps costing you more
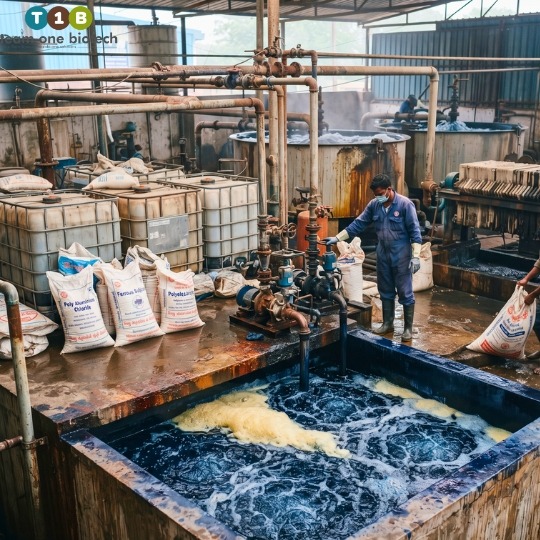
Coagulation with alum or ferrous sulfate, followed by chlorine bleaching for colour, is the classic fix. It works well enough to keep a plant running. But look at what it does to your costs over a year.
- Sludge generation. Coagulants trap dye in metal hydroxide flocs. The volume of chemical sludge is usually far higher than what a biological system produces for the same load.
- Handling and disposal cost. In many states, ETP sludge falls under hazardous waste rules, which means storage, transport and authorised disposal. Check the position for your unit. Every extra tonne adds to the monthly bill.
- Secondary pollution. Chlorine can form chlorinated organic by-products, and residual chlorine harms downstream biology. Sulphate and chloride from the chemicals also add to your TDS, which is the last thing you need.
- Inconsistent colour removal. Soluble reactive dyes often slip through coagulation. Dose requirements shift with every shade, so operators chase the colour instead of controlling it.
You end up paying for chemicals, then paying again to dispose of what they create, and still worrying about the outlet. Reducing chemical sludge in the ETP isn’t only an environmental goal. It’s one of the quickest ways to take pressure off your operating budget.
Wondering what your current dosing programme really costs you per month, once sludge handling is counted? Request a Free ETP Assessment and our team will review your dye load, dosing practice and sludge trends with you.
Chemical-heavy vs. biological treatment
| Parameter | Chemical-heavy treatment | Biological treatment (anaerobic-aerobic with bioculture) |
| Sludge | High volume of chemical sludge, often classified as hazardous | Lower sludge volume, mostly biomass that is easier to manage |
| Operating cost trend | Rises with dye load and dosing, plus disposal cost | Stabilises once the system is acclimatised, with lower chemical dependence |
| Colour removal consistency | Varies with dye type and dose, and colour often returns | More consistent for azo dyes when the system is stable |
| Shock-load tolerance | Needs constant dose adjustment | Better recovery when biology is adapted and buffered |
| Compliance risk | Higher risk on sludge handling and secondary pollution | Lower risk on sludge, though TDS still needs a separate plan |
How sequential anaerobic-aerobic treatment changes the outcome
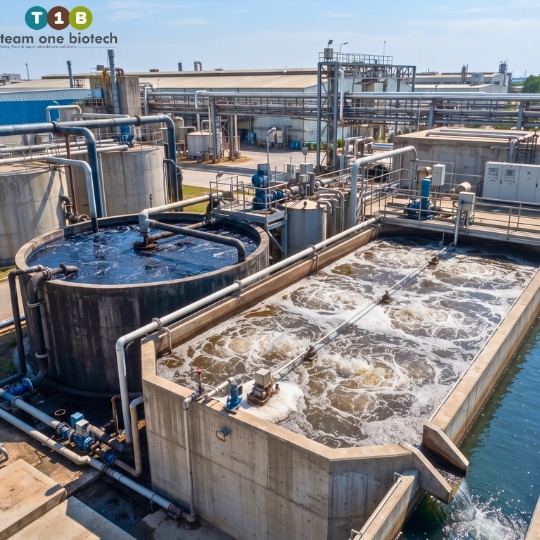
No single microbe, and no single tank, can do everything. Textile dyes break down in two stages that need opposite conditions. That’s why an anaerobic stage followed by an aerobic stage is the backbone of effective anaerobic aerobic treatment for textile effluent.
The anaerobic stage: azo bond cleavage and colour breakdown
Colour comes from the chromophore, and in azo dyes that’s the azo bond. Without oxygen, specialised bacteria use enzymes called azoreductases to split that bond. This is azo dye degradation in practice, and it’s where most visible colour disappears.
The catch is that the cleavage products are aromatic amines. They’re colourless, but they aren’t harmless. If your treatment stops here, you’ve swapped a visible problem for an invisible one.
To work well, this stage needs:
- Low oxygen and a suitable redox condition
- A readily available carbon source as co-substrate
- A stable pH and temperature
- A well-mixed reactor with enough retention time
The aerobic stage: breaking down aromatic amines, COD and BOD polishing
Once the colour is cleaved, the aerobic stage takes over. With adequate dissolved oxygen, aerobic organisms oxidise aromatic amines and the remaining organics. This is where COD and BOD reduction in a textile ETP is polished to the level your discharge consent requires.
In a stable, well-acclimatised system, combined colour and COD reduction can fall in a range of 60 to 90 percent across the biological stages. These are general values and will differ from one ETP to another.
Sequence matters. Run aerobic first and many azo dyes pass through untouched. Run anaerobic only and you leave amines behind. The two stages work as a pair, and each protects the other’s performance.
What a textile effluent bioculture actually does
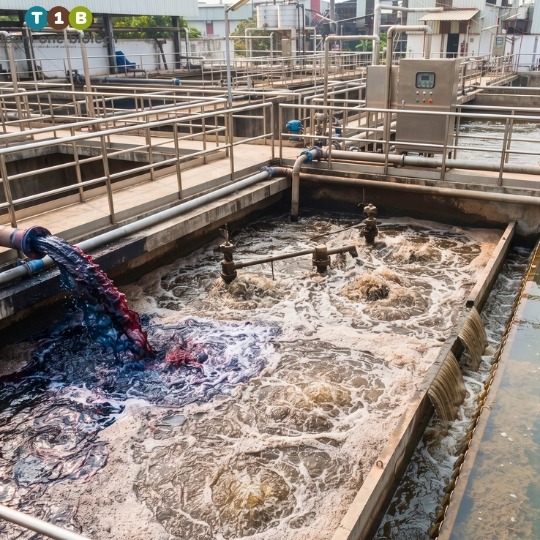
A textile effluent bioculture is a carefully selected consortium of microorganisms, dosed into your biological system to strengthen and speed up these two stages. Think of it as reinforcements for the biology you already have, particularly when your native population is struggling with dye load.
Two groups do most of the work:
- Azo-cleaving organisms carry azoreductase enzymes that break the azo bond in the anaerobic zone, which drives colour removal in textile wastewater.
- Lignolytic organisms produce oxidative enzymes such as laccases and peroxidases. These attack complex aromatic structures, including dye molecules and breakdown products, that ordinary heterotrophs leave alone.
That combination of lignolytic and azo-cleaving biocultures is what makes reactive dye decolourisation more achievable than with a general-purpose culture.
A good bioculture also helps with the practical problems you face every week:
- Adaptation to dye load and salinity. Salt-tolerant strains hold up better when conductivity rises.
- Faster start-up. A new or restarted system can establish a working microbial population sooner.
- Recovery after shock loads. When a toxic batch or a pH excursion knocks the biology back, a dosed consortium helps the system rebound.
- Lower chemical dependence. As biological colour and COD removal improve, coagulant and bleaching demand can often be reduced, which brings sludge down with it.
Let’s be straight about the limits. A bioculture isn’t a substitute for good equalisation, pH control or oxygen supply. It performs best when the plant gives it a fair chance, and a site study should confirm the right strains and dosing for your dye mix.
Ready to see what this could look like in your plant? Talk to our biologists about a trial dosing plan for your ETP.
Handling TDS and salt without wrecking your biology
This is the question every plant manager asks, and it deserves a straight answer. Biology does not remove dissolved salts. Microbes can tolerate salinity, but they can’t take it out of the water.
Here’s how to protect your biology and be realistic about what it can do:
- Acclimatise gradually. Sudden jumps in salinity stress even salt-tolerant cultures. Let the biomass adapt to rising conductivity over time rather than overnight.
- Equalise aggressively. A properly sized and mixed equalisation tank smooths salt, pH and colour peaks before they reach the reactors.
- Manage load at source. Segregate high-salt dye-bath dumps and bleed them in slowly. Where possible, review recipes, low-salt dyes and wash-water practices with your dyehouse team.
- Watch the chemicals you add. Sulphates and chlorides from coagulants raise TDS. Cutting chemical dosing helps here too.
Now the honest part. If your consent conditions or Zero Liquid Discharge (ZLD) for textile units require salt removal, you will still need RO, MEE or similar systems. Biology isn’t a replacement for them.
What biology does is protect them. A cleaner, lower-colour, lower-COD feed means less fouling on RO membranes and fewer problems in evaporators. In a ZLD train, the biological stage is what keeps the expensive downstream equipment running as designed.
Staying on the right side of CPCB and SPCB norms
Few things focus the mind like a notice from the pollution control board. CPCB and SPCB textile discharge norms typically cover colour absorbance, COD, BOD, TDS and pH, among other parameters. Limits differ by state, unit category and the conditions in your consent, so don’t rely on a number you heard at a conference. Check the norms applicable to your state, unit category and consent conditions.
What doesn’t change is the exposure. Persistent colour at the outlet can lead to environmental toxicity in receiving water, statutory penalties and environmental compensation, and, in serious or repeated cases, closure or shutdown directions. In regions where ZLD is mandated or being pushed, the pressure is even higher.
Three habits help you stay ahead of it:
- Track colour, COD, BOD, TDS and pH at the outlet on a regular schedule, not only before audits.
- Keep clean records of dosing, sludge disposal and maintenance. Inspectors notice patterns.
- Treat colour as a leading indicator. When your biology drifts, colour usually shows it before COD does.
A biological scheme with lower chemical dependence also reduces your sludge compliance burden, which is a growing area of scrutiny.
A practical checklist for plant managers
Run through this at your next ETP walk-round. It takes less time than a dosing trial and often reveals the real cause of a recurring problem.
- Equalisation: Is the tank properly mixed, with enough retention to buffer dye-lot changeovers?
- pH control: Is the pH going into the biological stage stable, or is it swinging with every batch dump?
- Dosing practice: Are coagulant and chlorine doses set by jar tests and trends, or by habit and panic?
- Anaerobic conditions: Is the anaerobic zone truly low in oxygen, with a steady carbon supply?
- DO levels: Is dissolved oxygen in the aerobic tank adequate across the whole basin, not only near the diffusers?
- Sludge behaviour: Is the sludge settling well, or showing bulking, foaming or floating?
- Colour trend: Are you tracking colour at each stage, not just at the outlet?
- Monitoring frequency: Are COD, BOD, TDS and MLSS tested often enough to catch drift early?
Common mistakes we see in textile ETPs
- Overdosing coagulants to chase colour, then drowning in sludge
- Skipping or undersizing the equalisation tank to save space
- Dumping concentrated dye baths and spent salt solutions into the system in one go
- Running the anaerobic stage with oxygen leaking in, which kills azo cleavage
- Expecting biology to remove salt
- Adding a bioculture without fixing pH, aeration or mixing first
- Judging results too early, before the culture has had time to establish
- Testing only at the outlet, so problems are found after the damage is done
Frequently asked questions
Can bioculture remove colour from reactive dye wastewater?
Yes, in many cases. Azo-cleaving and lignolytic organisms break chromophores that coagulation often misses. Results depend on dye chemistry, hydrolysed dye load, salinity and how well the anaerobic-aerobic stages are controlled. A site-specific trial is the reliable way to confirm performance for your effluent.
Does it reduce the need for alum or ferrous sulfate?
Often it does. When biological colour and COD removal improve, coagulant and bleaching demand can usually be cut back, and chemical sludge falls with it. How much you can reduce depends on your dye mix, system design and consent limits, so changes should be made step by step.
Can biology handle high TDS?
Biology can tolerate elevated salinity if it’s acclimatised and buffered, and salt-tolerant strains help. But it can’t remove dissolved salts. Where TDS must come down, you’ll still need RO, MEE or a ZLD system, and a cleaner biological effluent protects those units.
How long before results show in my ETP?
Early signs, such as steadier colour and better settling, often appear within a couple of weeks. Stable results usually take longer, commonly in a range of two to eight weeks. These are general values and will differ from one ETP to another, depending on load, temperature and plant condition.
Get your textile ETP ready before the next inspection
You can’t control what the dyehouse sends down the drain, and you can’t wish away a stubborn azo dye. What you can control is how your plant responds. A well-run anaerobic-aerobic system, supported by a textile effluent bioculture matched to your effluent, is the most practical route to steadier colour, lower COD and BOD, and a lighter sludge bill.
Every plant is different, and that’s the point. Dye mix, salt load, reactor design and consent conditions all shape the right approach. Generic advice won’t fix your outlet. A site-specific plan can.
Don’t wait for the next inspection notice or the next dye-season peak to find out where your textile ETP is vulnerable. Contact Us to book your free ETP assessment, or Request a Trial for a tailored dye wastewater treatment plan from the Team One Biotech team.
Disclaimer: The values, ranges and performance outcomes mentioned in this article are general in nature. Actual results vary with dye type, process chemistry, effluent characteristics, plant design and operating conditions. A site-specific study is recommended before implementation.
Looking to improve your ETP/STP efficiency with the right bioculture?
Talk to our experts at Team One Biotech for customised microbial solutions.
Contact: +91 8855050575
Email: sales@teamonebiotech.com
Visit: www.teamonebiotech.com
Discover More on YouTube – Watch our latest insights & innovations!-
Connect with Us on LinkedIn – Stay updated with expert content & trends!