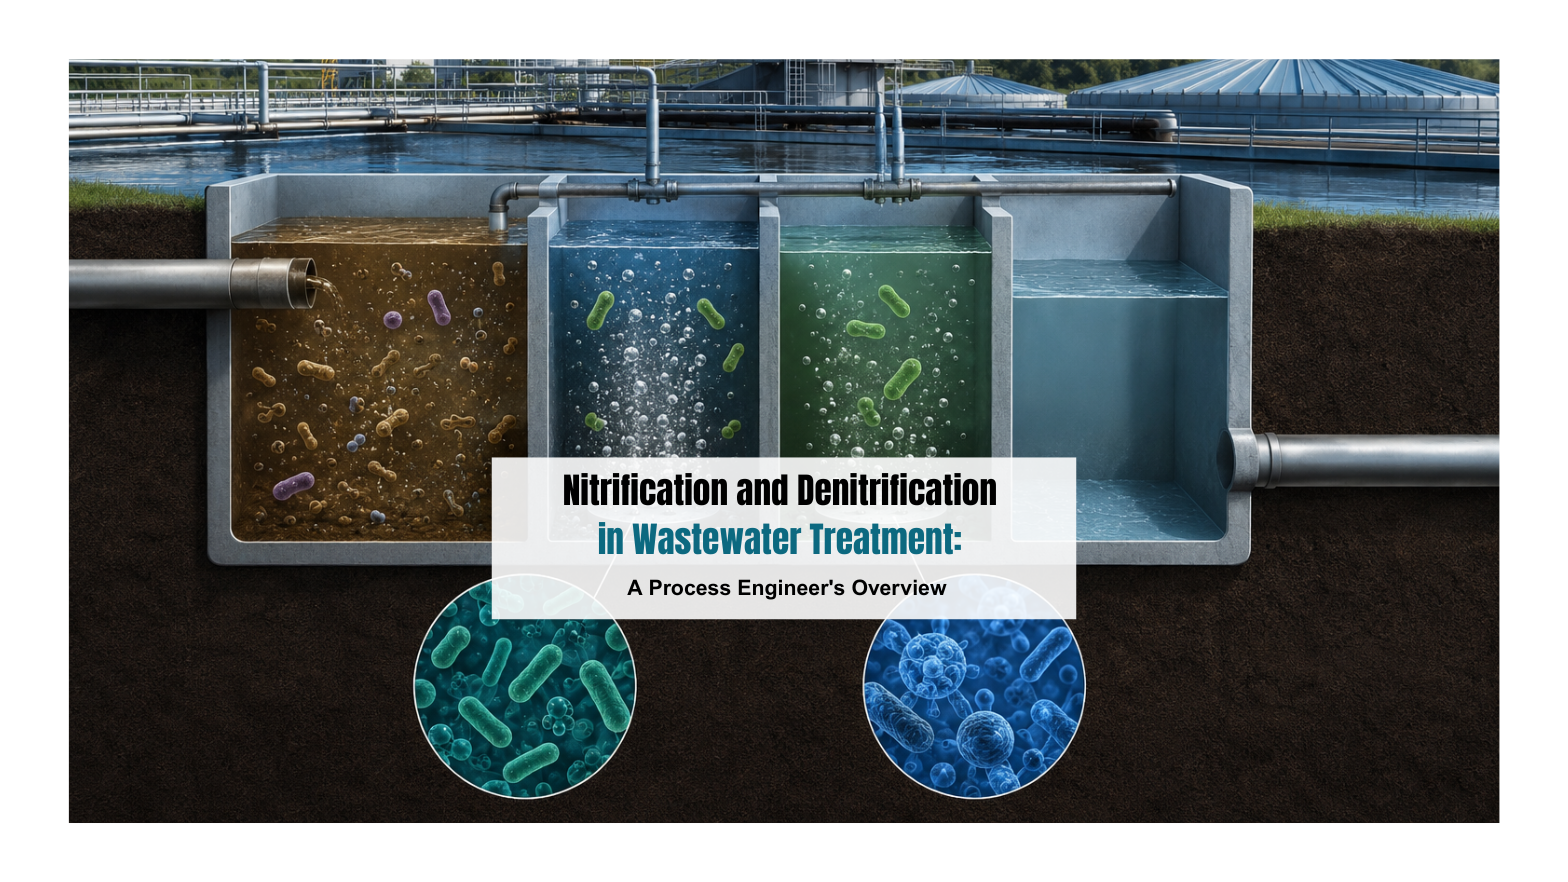
Nitrification and Denitrification in Wastewater Treatment: A Process Engineer's Overview
Nitrification and Denitrification in Wastewater Treatment: A Process Engineer’s Overview

There is a particular kind of dread that settles in when a consent violation notice lands on your desk. The ammonia levels in your treated effluent are elevated again. The CPCB or SPCB inspector is scheduled for next week. Your plant’s performance data tells a story you are not proud of, and you know that the next conversation with management is going to be uncomfortable. If you have been in this position, or are in it right now, you understand that nitrogen removal from wastewater is no longer a technical afterthought. It is a compliance imperative.

Biological nitrogen removal through nitrification and denitrification has become the cornerstone of compliant effluent treatment across India’s industrial and municipal sectors. As regulatory limits on total nitrogen, ammonia-nitrogen, and nitrate continue to tighten under CPCB and SPCB frameworks, plants that rely on conventional treatment alone are finding themselves perpetually on the wrong side of the discharge standards. The biology has to work. And for that to happen, the process engineer has to understand the biology.

This article walks through the complete picture, what nitrification and denitrification are, how they work at a biochemical level, what makes them fail, and what it takes to run them reliably under the pressures of industrial wastewater treatment in India.

If your plant is currently struggling to meet CPCB or SPCB nitrogen discharge norms, Team One Biotech’s specialized bioremediation cultures are engineered specifically to help. Reach out to our technical team today for a plant-specific assessment.

Why Nitrogen in Wastewater Is a Regulatory and Environmental Problem
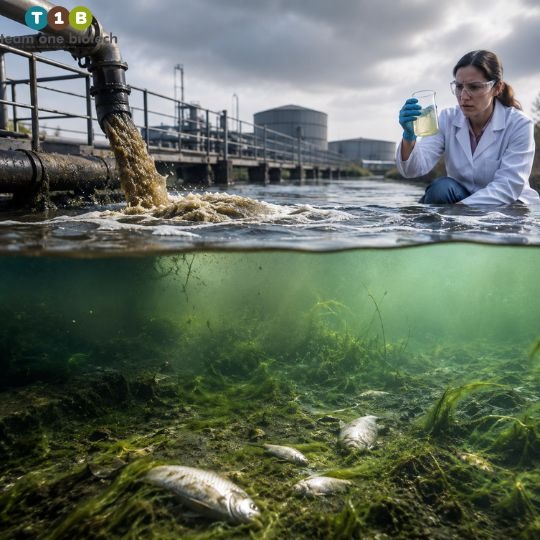
Why Nitrogen in Wastewater Is a Regulatory and Environmental Problem

Nitrogen enters wastewater streams in multiple forms, primarily as ammonia (from industrial processes, fertilizer runoff, and domestic sewage), organic nitrogen, nitrate, and nitrite. Left untreated, this nitrogen load creates serious downstream consequences.

When nitrogen-rich effluent discharges into rivers, lakes, or coastal water bodies, it fuels eutrophication, an explosive growth of algae and aquatic plants that depletes dissolved oxygen, suffocates aquatic life, and renders water bodies unusable for irrigation, fisheries, or drinking water abstraction. The ecological damage compounds over time, and in water-stressed regions like much of India, the consequences extend well beyond environmental aesthetics.

From a regulatory standpoint, CPCB and various SPCBs have progressively tightened effluent discharge standards for total nitrogen, ammonia-nitrogen, and nitrate. These are limits that most conventional aerobic treatment systems, designed primarily for BOD and suspended solids removal, simply cannot meet without dedicated biological nitrogen removal. Industries most exposed include pharmaceutical manufacturers, food and beverage processors, fertilizer plants, municipal sewage treatment plants, and tanneries. For these sectors, the cost of non-compliance is not abstract: it includes consent violations, financial penalties, forced plant shutdowns, and reputational damage that is difficult to recover from.

The only sustainable solution, both economically and operationally, is biological nitrogen removal through the sequential processes of nitrification and denitrification.

What Is Nitrification? The Biochemical Mechanism Explained

The Nitrification Reaction, Two-Stage Aerobic Oxidation

Nitrification is a two-stage aerobic biological process in which ammonia-nitrogen is first converted to nitrite, and then nitrite is oxidized to nitrate. Each stage is carried out by distinct groups of highly specialized autotrophic bacteria that derive their energy not from organic carbon, but from the chemical oxidation of inorganic nitrogen compounds.

The first stage is performed by ammonia-oxidizing bacteria (AOB), predominantly species of the genus Nitrosomonas. These organisms oxidize ammonia to nitrite, releasing energy that they use for growth and cell synthesis. The second stage is handled by nitrite-oxidizing bacteria (NOB), primarily Nitrobacter spp., which oxidize nitrite to nitrate.

In simplified terms, the nitrification reaction proceeds as follows:

  • Stage 1 (AOB): Ammonia → Nitrite (with consumption of dissolved oxygen and alkalinity)
  • Stage 2 (NOB): Nitrite → Nitrate (with further oxygen consumption)

The net result is the conversion of toxic ammonia-nitrogen into nitrate, which is far less immediately toxic but still ecologically harmful and subject to discharge limits. Nitrification alone does not achieve total nitrogen removal from wastewater, it only transforms the form of nitrogen present. Complete removal requires denitrification as the second step.

One operational reality that every plant engineer must internalize: nitrifying bacteria are among the slowest-growing organisms found in activated sludge systems. They grow two to three orders of magnitude more slowly than the heterotrophic bacteria responsible for BOD removal. This makes them extraordinarily sensitive to washout, toxic shock, and process upsets. A nitrifier population that takes weeks to establish can be destroyed in hours.

Operating Conditions That Drive Nitrification Efficiency
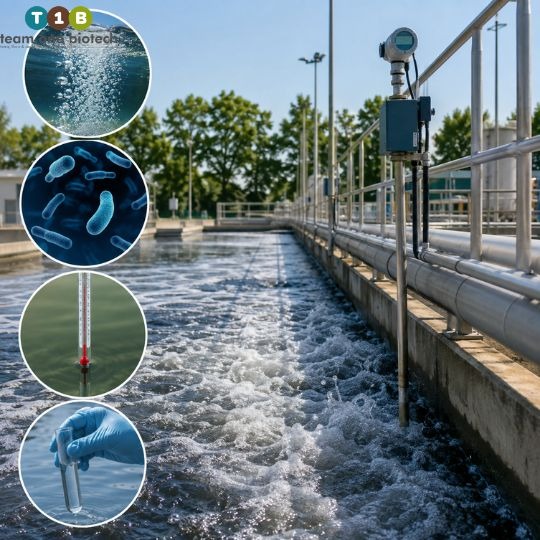
Operating Conditions That Drive Nitrification Efficiency

Dissolved Oxygen (DO)

Nitrifiers are obligate aerobes, they cannot function without oxygen. The nitrification process requires dissolved oxygen levels to be maintained above a certain minimum threshold in the aeration tank. Below this threshold, nitrification rates drop sharply and can cease entirely. In practice, DO control in the aeration zone is one of the most direct levers an operator has for managing nitrification performance. (Note: These are general indicative ranges; actual values vary significantly depending on the specific ETP/STP design, influent characteristics, and operating conditions.)

pH

pH exerts a profound influence on nitrification efficiency. The nitrification process ceases at pH levels that fall outside the tolerable range for nitrifying organisms. The optimal pH window for nitrification lies within a moderately alkaline range, and activity drops sharply as pH approaches the acidic or strongly alkaline extremes. Engineers should note that nitrification itself consumes alkalinity, which means systems without adequate buffering capacity are prone to a pH crash that then further suppresses the very biological activity driving that pH shift, a self-reinforcing failure cycle. 

(Note: Indicative ranges only; site-specific values will differ based on system design and influent composition.)

Temperature

Nitrification is temperature-sensitive in a way that creates predictable seasonal challenges in many Indian climates. While high ambient temperatures can generally support nitrification, cold winters, particularly in northern India, can significantly reduce nitrifier metabolic rates and effective population density. Process engineers operating STPs and ETPs in these regions should anticipate performance degradation during colder months and plan accordingly, whether through bioaugmentation, extended SRTs, or temperature compensation strategies. (Indicative ranges only.)

Alkalinity

Because nitrification consumes bicarbonate alkalinity as a carbon source for autotrophic growth and as a buffer, systems receiving low-alkalinity influent or operating at high nitrogen loads may experience progressive pH depression. Alkalinity supplementation, typically through sodium bicarbonate or lime addition, is a standard corrective measure, but it must be managed carefully to avoid overcorrection.

Sludge Retention Time (SRT)

The slow growth rate of nitrifying bacteria means that a minimum SRT is required to maintain an active nitrifier population in the system. If the SRT falls below this biological threshold, nitrifiers are washed out of the system faster than they can reproduce. This is one of the most common and most damaging operational errors in plants that have not been specifically designed or adjusted for nitrification. In practice, nitrification-optimized systems require considerably longer SRTs than systems designed only for BOD removal. (Range is system-specific; consult a process specialist.)

Toxic Inhibitors

Industrial ETP operators face a challenge that municipal STP operators rarely encounter at the same scale: toxic influent loads. Heavy metals, free ammonia at elevated concentrations, chlorine residuals, and various industrial solvents and process chemicals can inhibit or outright kill nitrifying communities. Identifying and characterizing the inhibitory components in a plant’s influent is an essential step in any nitrification troubleshooting exercise.

What Is Denitrification? Closing the Nitrogen Loop
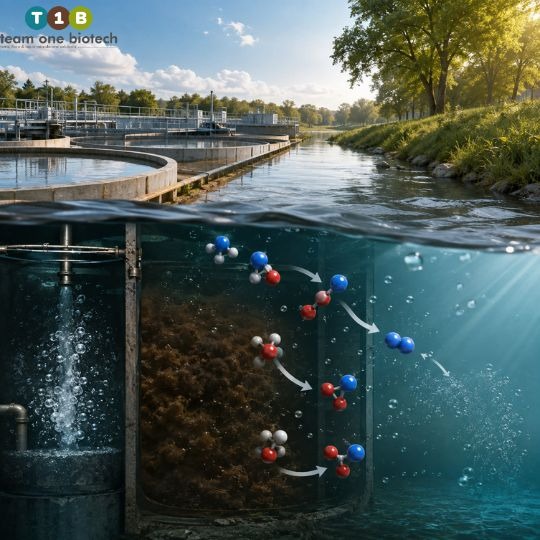
What Is Denitrification? Closing the Nitrogen Loop

The Biochemistry of Denitrification

If nitrification is the first half of biological nitrogen removal, denitrification is the step that completes it. Denitrification is the microbial reduction of nitrate and nitrite to nitrogen gas, which escapes harmlessly from the liquid phase into the atmosphere. It is the only biological mechanism that achieves actual removal of nitrogen from the wastewater system, not merely a transformation of its chemical form.

The organisms responsible for denitrification are fundamentally different from nitrifiers in their physiology and ecology. Denitrification bacteria in STP environments are facultative heterotrophs, organisms capable of switching their metabolic strategy depending on the availability of oxygen. Under anoxic conditions (where dissolved oxygen is absent or minimal, but the environment is not fully anaerobic), these bacteria use nitrate or nitrite as their terminal electron acceptor in place of oxygen, reducing them stepwise to nitrogen gas.

Key genera involved in denitrification include Pseudomonas, Paracoccus, Bacillus, and several others. Unlike nitrifiers, these organisms are not slow-growing specialists, they are metabolically flexible and relatively robust, which makes them somewhat easier to manage operationally. However, their effectiveness is still contingent on specific process conditions being met.

Without denitrification, a plant achieving full nitrification will simply accumulate nitrate in its treated effluent. This satisfies ammonia discharge limits but may still violate total nitrogen or nitrate-specific limits, and it represents an incomplete treatment outcome from both regulatory and environmental standpoints.

Key Operating Conditions for Denitrification
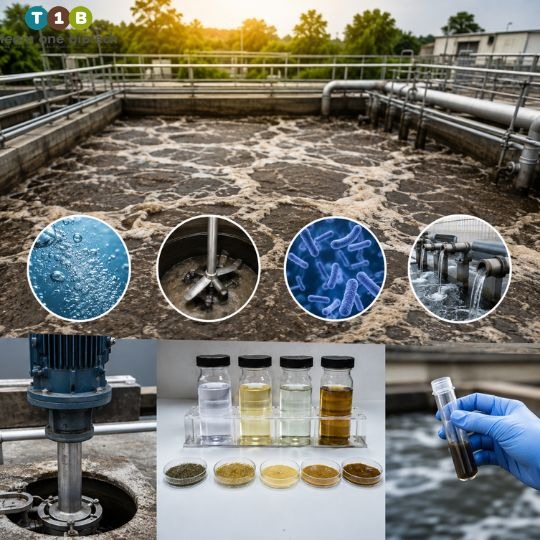
Key Operating Conditions for Denitrification

Carbon-to-Nitrogen (C:N) Ratio

Denitrification is fundamentally a heterotrophic process, the organisms require an organic carbon source as the electron donor to drive the reduction of nitrate. This creates a significant operational challenge in many industrial effluents, where the carbon-to-nitrogen ratio may be too low to support adequate denitrification rates. When influent BOD or COD is insufficient relative to the nitrogen load, denitrification stalls and nitrate accumulates in the final effluent. In such cases, external carbon sources, such as methanol, acetate, or other readily biodegradable organics, may need to be dosed into the anoxic zone to supplement the available carbon. 

(Note: Required C:N ratios are indicative and vary significantly with system configuration and influent characteristics.)

Anoxic Zone Design

Denitrification requires an environment where oxygen is absent but nitrate is available. This is the anoxic zone, a specific volume within the biological treatment system where dissolved oxygen is maintained at near-zero levels. In conventional activated sludge systems, MBRs, and SBRs, the configuration and sequencing of aerobic and anoxic zones is a critical design and operational variable. Both the volume of the anoxic zone and its hydraulic retention time (HRT) within that zone determine how completely denitrification can proceed.

Temperature

Like nitrification, denitrification rates are temperature-dependent. Cold conditions slow microbial metabolism and can cause denitrification performance to degrade seasonally. (Site-specific ranges apply; consult a qualified engineer.)

Nitrate Recycling

In pre-denitrification systems, where the anoxic zone precedes the aerobic nitrification zone, nitrate must be recycled from the aerobic effluent back into the anoxic zone through an internal recycle stream. The recycle ratio directly controls how much nitrate is available for denitrification and therefore how completely total nitrogen can be removed. Getting the recycle ratio right is one of the more nuanced operational adjustments in a BNR system.

Difference Between Nitrification and Denitrification, A Practical Comparison

For engineers who need to communicate this distinction clearly, whether in internal reports, client briefings, or regulatory documentation, the following comparison captures the essential differences:

ParameterNitrificationDenitrification
Primary organismsAutotrophic bacteria (AOB, NOB)Facultative heterotrophic bacteria
Electron acceptorDissolved oxygen (O₂)Nitrate / Nitrite (NO₃⁻ / NO₂⁻)
Environmental conditionAerobicAnoxic
Carbon requirementNone (autotrophic)Yes (BOD/COD required)
End productNitrate (NO₃⁻)Nitrogen gas (N₂)
Role in nitrogen removalConverts ammonia to nitrateRemoves nitrate as N₂ gas
Rate sensitivityHighly sensitive (slow-growing)Moderately sensitive

The key takeaway: nitrification transforms nitrogen; denitrification removes it. Both processes are required for true total nitrogen removal from wastewater.

Common Process Failures and How Engineers Diagnose Them

Process failures in biological nitrogen removal are frustratingly common, and they rarely announce themselves clearly. Here are the most frequently encountered failure modes and their diagnostic indicators:

Rising effluent ammonia despite adequate aeration

This typically points to nitrifier inhibition, nitrifier washout due to insufficient SRT, or a toxic loading event. The first diagnostic step is to verify DO levels in the aeration zone, confirm the actual SRT being achieved in the system, and review whether any unusual influent characteristics coincided with the performance decline.

Incomplete denitrification and rising effluent nitrate

When ammonia is adequately removed but nitrate climbs in the final effluent, the anoxic zone is underperforming. Common causes include insufficient carbon source (low C:N ratio), inadequate anoxic zone HRT, excessive internal recycle oxygen carry-over, or temperature suppression during cold months.

pH instability affecting both processes simultaneously

If pH is oscillating or trending downward, the first place to look is alkalinity balance. Nitrification consumes alkalinity; if the system’s buffering capacity is overwhelmed, pH destabilization can suppress nitrification directly, which then creates ammonia accumulation, a compound failure that can be difficult to reverse without systematic intervention.

Seasonal performance collapse

Temperature-driven performance drops in winter are predictable but still catch operators off guard. The response toolbox includes extending SRT where possible, reducing hydraulic loading temporarily, and in more severe cases, supplementing with external nitrifying and denitrifying bacterial cultures through bioaugmentation.

Many of these failures are rooted not in equipment design but in the biology, specifically, in the health, population density, and metabolic activity of the nitrifying and denitrifying microbial communities. A plant with well-designed infrastructure but a compromised biological community will consistently underperform.

Team One Biotech offers specialized nitrification and denitrification bacterial consortia, formulated for Indian effluent characteristics and CPCB compliance targets. Contact our technical team for a plant-specific recommendation.

Bioaugmentation as a Solution, When Native Microbiology Is Not Enough

Industrial ETPs operate under conditions that are genuinely hostile to biological communities. High and variable toxic loads, temperature swings, intermittent operation, shock loads from batch processes, these conditions suppress native nitrifier and denitrifier populations chronically, not just during acute upset events.

Bioaugmentation is the practice of adding concentrated, pre-adapted microbial cultures to an existing biological treatment system to reinforce or re-establish the microbial communities responsible for specific treatment functions. It is not a replacement for sound process design, but it is a highly effective tool for bridging the gap between what a system’s native biology can achieve and what CPCB or SPCB compliance requires.

For nitrification specifically, bioaugmentation allows plants to rebuild nitrifier populations far faster than natural growth rates would allow, reducing the time to stable compliance after a washout event from weeks to days. For denitrification, inoculating with robust denitrifying consortia adapted to low C:N industrial effluents can substantially improve nitrate removal rates without requiring major infrastructure changes.

Team One Biotech develops and supplies specialized nitrification and denitrification cultures engineered for the specific influent matrices, temperature ranges, and regulatory targets that Indian ETP and STP operators face. Our formulations have supported process recovery and compliance establishment across pharmaceutical, food processing, municipal, and specialty chemical sectors.

Frequently Asked Questions

What is the nitrification process in wastewater treatment?

The nitrification process is a two-stage aerobic biological conversion in which ammonia-nitrogen is first oxidized to nitrite and then further oxidized to nitrate by specialized autotrophic bacteria. It is a critical first step in biological nitrogen removal, though it does not by itself remove nitrogen from the system.

What organisms carry out nitrification?

Nitrification is carried out by two distinct groups of autotrophic bacteria. Ammonia-oxidizing bacteria (AOB), primarily Nitrosomonas spp., perform the first stage (ammonia to nitrite). Nitrite-oxidizing bacteria (NOB), primarily Nitrobacter spp., complete the second stage (nitrite to nitrate).

At what pH does the nitrification process cease?

The nitrification process operates within a specific pH window, and activity drops sharply outside of this range. At strongly acidic pH levels or highly alkaline conditions, nitrifier activity can cease almost entirely. The optimal range falls within moderate alkalinity, though the exact threshold at which nitrification process ceases at pH extremes is system-specific. (Note: Indicative only; actual thresholds depend on specific organism populations and operating conditions.)

What is the difference between nitrification and denitrification?

Nitrification converts ammonia to nitrate under aerobic conditions using autotrophic bacteria, while denitrification reduces nitrate to nitrogen gas under anoxic conditions using heterotrophic bacteria. Nitrification changes the form of nitrogen in the system; denitrification achieves actual removal of nitrogen from the wastewater.

What are denitrification bacteria in STP?

Denitrification bacteria in STP environments are facultative heterotrophs, organisms that can use either oxygen or nitrate as their terminal electron acceptor depending on the conditions. Key genera include Pseudomonas, Paracoccus, and Bacillus. These bacteria reduce nitrate and nitrite stepwise to nitrogen gas under anoxic conditions.

How does the carbon-to-nitrogen ratio affect nitrogen removal from wastewater?

Denitrification is a heterotrophic process that requires organic carbon as the electron donor. If the C:N ratio in the influent is too low, denitrification becomes carbon-limited and fails to reduce nitrate adequately, resulting in elevated nitrate in the treated effluent. External carbon dosing may be required in low-C:N industrial effluents.

Can nitrification and denitrification happen in the same tank?

Yes, this is the principle behind simultaneous nitrification and denitrification (SND), which is intentionally exploited in systems like sequencing batch reactors (SBRs) and certain MBR configurations. By creating micro-aerobic conditions or alternating aerobic and anoxic phases within a single vessel, both processes can be achieved in the same physical space, simplifying plant footprint requirements.

Compliance Is a Biology Problem as Much as an Engineering One

Nitrogen removal from wastewater through nitrification and denitrification is, at its core, a biological problem. The hydraulics can be right, the aeration equipment can be well-maintained, and the instrumentation can be calibrated perfectly, but if the microbial communities carrying out these processes are compromised, the plant will not achieve compliance.

Process engineers who understand the biochemistry of nitrification and denitrification, who know why nitrifiers wash out, why denitrification stalls when carbon is insufficient, and why pH instability cascades through both processes simultaneously, are far better equipped to maintain consistent performance and defend their effluent quality in front of a regulatory inspector.

The biology must be respected on its own terms. These organisms have requirements, sensitivities, and growth dynamics that do not bend to operational convenience. Meeting them consistently requires both good process design and a commitment to monitoring and maintaining the biological communities that do the actual work.

Team One Biotech has helped industrial and municipal plants across India achieve consistent CPCB and SPCB nitrogen compliance through our engineered bioremediation products. If your plant is facing nitrification failures, incomplete denitrification, or total nitrogen exceedances, talk to our specialists today. We will assess your current process and recommend a targeted biological solution, one designed for your specific effluent characteristics, regulatory targets, and operational constraints.

Visit our website or speak to a technical expert today.

Disclaimer: The values, ranges, and parameters discussed in this article are general indicative figures for reference and educational purposes only. Actual operating parameters, thresholds, and performance outcomes vary significantly based on the specific ETP/STP design, influent composition, hydraulic loading, temperature, and site-specific conditions. Always consult a qualified process engineer or technical specialist before making operational adjustments.

Looking to improve your ETP/STP efficiency with the right bioculture?
Talk to our experts at Team One Biotech for customised microbial solutions.

Contact+91 8855050575

Email:  sales@teamonebiotech.com

Visit: www.teamonebiotech.com

Discover More on YouTube – Watch our latest insights & innovations!-

Connect with Us on LinkedIn – Stay updated with expert content & trends!
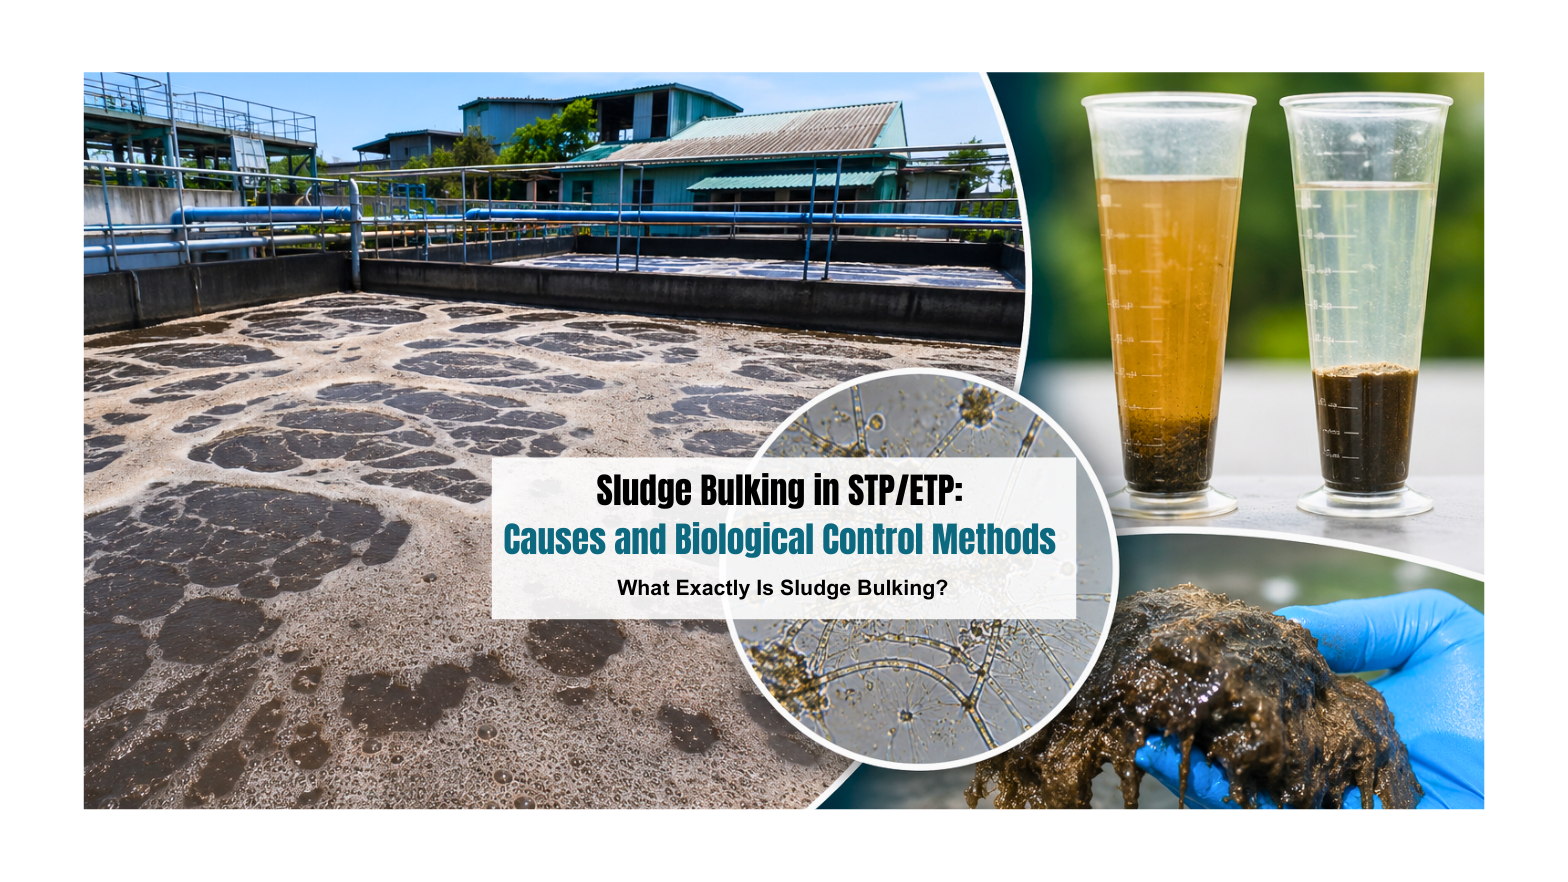
Sludge Bulking in STP/ETP: Causes & Biological Control Methods
Sludge Bulking in STP/ETP: Causes and Biological Control Methods

Few things frustrate an STP or ETP operator quite like walking up to a secondary clarifier and realizing the sludge has stopped behaving. The aeration system appears to be running, dosing has been done, pumps are operating, and yet the sludge blanket is climbing, foam is gathering at the surface, or cloudy solids are escaping with the final effluent. If an inspection or compliance sampling is approaching, what looked like another process fluctuation suddenly becomes a much bigger problem. Sludge bulking is one of those activated sludge process problems that can turn an apparently stable biological plant into a troubleshooting exercise very quickly.

The important thing to understand is that bulking is usually a symptom rather than the disease itself. Something in the biological environment has shifted enough to change which microorganisms dominate and how the biomass forms flocs. Low oxygen, nutrient deficiency, inappropriate F/M conditions, septic zones, shock loading, temperature changes, or combinations of these stresses can create conditions in which poor-settling biomass gains an advantage. The solution, therefore, is rarely to attack the clarifier alone. You have to trace the problem back through the biology and operating conditions that produced the sludge in the first place.

This guide explains how to control sludge bulking from that practical, biological perspective. We will look at what causes poor settling, how SVI fits into diagnosis, why filamentous microorganisms become dominant, and how bioaugmentation, aeration optimization, nutrient balancing, selector conditions, and MLSS regulation in STP operations can bring the system back toward stable settling.

When Good Sludge Goes Bad: Why Bulking Demands Immediate Attention

When Good Sludge Goes Bad: Why Bulking Demands Immediate Attention

Healthy activated sludge should form flocs with enough density and structure to separate efficiently from treated water in the secondary clarifier. When that structure changes, the clarifier is often where the problem becomes visible even though the cause may have developed hours or days earlier in the aeration basin. Operators may notice a rising sludge blanket, fluffy settling, pin floc, excessive foam, poor compaction, or solids moving toward the outlet. The natural reaction is to focus on the clarifier because that is where the failure can be seen, but the clarifier is often only displaying a biological imbalance created upstream.

That distinction matters because a settling problem can quickly affect the rest of the plant. Solids lost in the treated water reduce the amount of active biomass retained in the biological system. Biomass loss can then weaken organic removal, which puts additional pressure on the remaining microbial population and may accelerate the instability. What began as poor settling can therefore become a feedback loop: weak settling causes biomass washout, biomass washout reduces biological stability, and reduced stability makes settling even harder to recover.

This is why experienced operators look beyond the surface appearance. They examine settling trends, aeration distribution, loading history, return sludge behaviour, wasting practices, nutrient availability, influent characteristics, and microscopic observations where available. The goal is not simply to make the sludge sink today. It is to restore the microbial conditions that allow it to keep settling tomorrow.

What Exactly Is Sludge Bulking?

What Exactly Is Sludge Bulking?

Sludge bulking describes a condition in which activated sludge does not settle and compact properly during secondary clarification. Instead of forming a dense blanket with clear supernatant above it, the biomass occupies excessive volume or remains suspended, making solid-liquid separation difficult. One of the most useful operational indicators is the sludge volume index in wastewater treatment, because SVI connects settled sludge volume with the solids concentration of the mixed liquor. Operators should pay more attention to the direction and persistence of the SVI trend than to a single isolated reading.

A worsening SVI trend should trigger investigation rather than an automatic treatment response. Look at the settleability test itself: Is the sludge fluffy? Does it settle initially but fail to compact? Is the supernatant cloudy? Is there floating sludge later in the test? These observations can help distinguish filament-related settling problems from other conditions such as dispersed growth, denitrification in the clarifier, hydraulic overloading, or weak floc formation.

Important operating disclaimer: SVI, DO, MLSS, nutrient ratios, F/M ratio, and similar process values should be interpreted as plant-specific operating ranges rather than universal targets. Appropriate ranges vary significantly with influent characteristics, process configuration, design capacity, industrial sector, temperature, sludge age, and historical plant performance. Always validate operating decisions against your plant’s baseline data and, where necessary, a wastewater process specialist.

Filamentous Bulking vs. Viscous Bulking

Not every bulky sludge has the same biological structure. Filamentous bulking occurs when filamentous organisms extend beyond the floc structure in excessive numbers, producing an open network that prevents compact settling. Think of a healthy floc as a compact ball and heavily filamentous sludge as a ball covered with long fibres that catch against neighbouring particles. Those fibres can give the biomass structure in moderate populations, but excessive growth produces a loose matrix that occupies too much volume.

Viscous or non-filamentous bulking is different. It is commonly associated with excessive extracellular material and highly hydrated biomass, which creates a gelatinous sludge that also settles and compacts poorly. The visual symptom may look similar from the clarifier walkway, but the corrective action can be different. This is why microscopy, when available, is valuable before making aggressive process changes. Sludge bulking can often be controlled by managing the environmental conditions that allow filamentous bacteria in activated sludge to dominate, but that approach only works well when filament overgrowth is actually the problem.

Root Causes of Sludge Bulking in STP and ETP

Root Causes of Sludge Bulking in STP and ETP

Bulking rarely has a single universal cause. Activated sludge is a living ecosystem, and the microbial community responds continuously to what the plant feeds it and to the environment operators create around it. Change the oxygen profile, nutrient availability, organic loading, temperature, pH, sludge age, or presence of toxic compounds and you change the competitive balance between microorganisms. That is why copying another plant’s corrective action can fail even when both clarifiers appear to have the same problem.

For practical troubleshooting, think in terms of microbial selection pressure. Ask what conditions have recently changed and which organisms those conditions favour. Review influent loading trends, production schedules in industrial plants, blower performance, nutrient dosing, RAS and wasting practices, upstream holding tanks, equalization performance, and any periods of stagnation. The more accurately you identify the selective pressure behind the bulking, the less trial-and-error you need during recovery.

Filamentous Bacteria Overgrowth

Filamentous organisms are not automatically harmful. A controlled filament population can contribute to floc structure, but excessive filament growth prevents biomass from compacting efficiently. Problems develop when plant conditions repeatedly favour filamentous organisms over compact floc-forming populations. Low-oxygen microenvironments, nutrient limitations, septic influent, inappropriate loading conditions, and prolonged biological stress can all contribute depending on the organisms present.

This is why “kill the filaments” is often the wrong first objective. If the underlying environment still favours them, suppressing the existing population without correcting that environment can simply create room for the same problem to return. A more durable strategy changes the competitive conditions inside the biological system. Restore oxygen where it is deficient, correct nutrient limitations, stabilize organic loading, remove septic pockets, manage biomass inventory, and reinforce desirable microbial populations when necessary.

Microscopic identification can make this troubleshooting far more precise. If microscopy confirms excessive filament bridging, combine that information with process data rather than treating the microscope result in isolation. Biology tells you what is dominating; operating history helps tell you why.

Low Dissolved Oxygen and Poor Aeration Distribution

Low dissolved oxygen is one of the first conditions worth investigating when sludge settling begins deteriorating, but a single DO reading can be misleading. An aeration basin is not a perfectly mixed laboratory vessel. One probe may show acceptable oxygen while another part of the tank experiences an oxygen-limited zone because of diffuser fouling, uneven airflow, mixing problems, high localized oxygen demand, or hydraulic short-circuiting. For that reason, DO mapping across the basin provides much better information than repeatedly measuring one convenient location.

Look at the mechanical side as well as the biology. Are blowers delivering what operators expect? Have diffusers become fouled? Are certain sections mixing poorly? Has organic loading increased without a corresponding increase in oxygen-transfer demand? An aeration problem can masquerade as a purely microbial problem because microorganisms simply respond to the environment the equipment creates.

Correcting aeration distribution can therefore be one of the most cost-effective biological control measures available. The objective is not blindly increasing airflow. It is creating an oxygen environment appropriate to the plant’s actual loading and process configuration while avoiding unnecessary energy consumption.

Nutrient Imbalance in Biological Treatment

Microorganisms need more than carbonaceous organic matter. They also require nitrogen, phosphorus, trace elements, and other nutrients to build cells and maintain metabolism. Municipal sewage often supplies many of these nutrients naturally, but industrial effluent can be very different. A wastewater stream may carry substantial COD or BOD while remaining deficient in one or more nutrients needed for stable biological growth.

When that balance is disturbed, floc-forming organisms may become stressed and the microbial community can shift. Simply increasing aeration will not correct a nutritional limitation any more than giving someone more air would fix an empty dinner plate. The sensible approach is to characterize the wastewater, examine nutrient availability in relation to biodegradable organic loading, and supplement only where the data shows a deficiency.

For plants dealing with recurring nutrient limitations, targeted nutrient balancing solutions for wastewater treatment can support a more stable microbial environment. Team One Biotech’s SustainX, for example, is positioned as a nutrient supplement intended to provide biologically available nutrients for wastewater microorganisms. Nutrient addition should still be based on process assessment rather than routine overfeeding.

Low F/M Ratio, Shock Loads, and Changing Influent Conditions

The food-to-microorganism ratio, or F/M ratio, is another useful lens for understanding bulking. If a plant retains a large biomass inventory while readily biodegradable food becomes limited, organisms adapted to low-food conditions may gain a competitive advantage. At the opposite extreme, sudden organic loading can overwhelm oxygen-transfer capacity and create temporary stressed or oxygen-deficient conditions. Both situations illustrate why the biological process needs balance rather than simply “more biomass” or “more aeration.”

Industrial ETPs are particularly vulnerable because production changes can transform the influent almost overnight. A new product campaign, cleaning cycle, batch discharge, temperature increase, pH swing, toxic compound, or hydraulic surge may disturb a microbial population that looked perfectly stable the previous week. Equalization helps, but operators should still correlate biological changes with production and influent records.

When bulking appears suddenly, ask what changed before asking what should be dosed. That simple question often saves days of troubleshooting.

Why Sludge Bulking Becomes a Compliance Risk

Poor settling is not merely an untidy clarifier. When biological solids escape with treated water, final effluent TSS can increase, and the organic matter associated with those solids can also contribute to poorer BOD performance. That creates a direct link between sludge settleability and discharge compliance. India’s CPCB publishes general standards for discharge of environmental pollutants, while applicable requirements can also depend on discharge route, plant category, consent conditions, and state-level requirements. Plant managers should therefore verify the standards and consent conditions that specifically apply to their facility rather than relying on a generic target.

The risk becomes more serious if solids washout begins reducing biomass inventory in the biological reactor. Now the plant is facing two problems at once: deteriorating clarification and reduced biological treatment capacity. If the condition continues, operators can find themselves chasing TSS, BOD, COD, ammonia, or other performance indicators while the biological system becomes progressively less resilient.

This is why CPCB/SPCB compliance should be part of bulking diagnosis from the beginning. Don’t wait for the laboratory report to confirm that poor settling has become a compliance problem. If the sludge blanket is rising and solids are visibly carrying over, treat it as an early warning that deserves immediate process investigation.

How to Control Sludge Bulking Biologically

How to Control Sludge Bulking Biologically

There is no universal bottle, blower setting, or wasting rate that fixes every bulking event. Effective biological control is usually a sequence: identify the dominant failure mechanism, remove the condition favouring poor-settling organisms, strengthen desirable biomass, and then monitor the settling response. This is slower than reaching for a random corrective dose, but it is much more likely to produce stable recovery.

Start with evidence. Review SVI and settling trends, map DO, inspect aeration, examine recent loading changes, check nutrient sufficiency, assess RAS and wasting behaviour, and use microscopy if available. Once you understand the likely cause, choose the smallest set of changes capable of correcting it. Multiple simultaneous changes may make recovery harder to interpret because you will not know which intervention actually worked.

Bioaugmentation with Selected Microbial Cultures

Bioaugmentation introduces selected microbial cultures into a biological treatment system to reinforce degradation capability and microbial stability. In a bulking situation, the objective is not merely to pour bacteria into the aeration basin. A well-designed program aims to strengthen desirable biological activity while operating conditions are simultaneously adjusted so those organisms can establish themselves and compete effectively.

Team One Biotech’s T1B Aerobio is positioned for aerobic wastewater treatment and includes microbial cultures intended to support floc formation, biological degradation, shock-load resistance, and control of excessive foaming and sludge bulking. Team One Biotech also reports industrial case studies in which customized bioaugmentation programs were paired with process analysis and dosing schedules rather than used as isolated additions. That process-first approach is important because even a well-selected microbial consortium cannot permanently compensate for severe oxygen limitation, uncontrolled toxic shocks, or persistent nutrient starvation.

If your plant has confirmed filament overgrowth or repeatedly loses settling stability after shock loads, talk to Team One Biotech about its bioaugmentation solutions for activated sludge systems. A plant-specific dosing plan should be based on wastewater characteristics, process configuration, biomass condition, and the actual bulking pattern rather than a generic dose copied from another facility.

DO and Aeration Optimization

Before making complicated changes, verify that oxygen is reaching the biology where it is needed. Walk the basin and measure DO at multiple representative locations and operating periods. Compare those observations with airflow, loading, mixing, and diffuser condition. A plant can have adequate blower capacity on paper while still creating localized low-oxygen zones in practice.

Correcting those zones may require diffuser cleaning, airflow redistribution, blower scheduling changes, mixing improvements, or addressing an unexpected increase in oxygen demand. The exact response depends on plant design, which is why a universal DO number is less useful than a stable plant-specific operating range supported by performance trends.

After making changes, monitor settleability and biological performance rather than expecting an instant visual transformation. Microbial populations need time to respond to their new environment. The goal is sustained ecological selection, not a one-hour cosmetic improvement in the clarifier.

Nutrient Balancing and Biostimulation

If testing shows that the wastewater is nutrient deficient, controlled supplementation can help restore microbial growth and floc quality. This is especially relevant in ETPs receiving carbon-rich but nitrogen- or phosphorus-poor industrial streams. The correct nutrient requirement should be determined from actual biodegradable loading and plant behaviour, not from a fixed recipe applied regardless of influent composition.

Overdosing nutrients is not a harmless insurance policy. Excess nutrients can create additional effluent-management problems and increase operating cost without correcting the real cause of bulking. Supplementation works best when it addresses a demonstrated limitation and is monitored through biological response, effluent quality, and sludge behaviour.

For plants where nutrient deficiency is suspected, Team One Biotech’s nutrient balancing solutions for wastewater treatment provide one route for targeted supplementation. The decision should still begin with wastewater characterization and process diagnosis.

F/M Correction and Selector Tanks

Managing F/M conditions means managing the relationship between biodegradable food and active biomass. Operators influence that relationship through sludge wasting, RAS management, biomass inventory, equalization, loading distribution, and other process controls. If too much old biomass is being retained relative to available food, controlled wasting may help shift the system. If shock loading is the problem, equalization and feed management may be more important.

Selector zones can also be useful in plants designed or configured to use them. A selector creates controlled conditions in which desirable floc-forming organisms rapidly take up available substrate before the mixed liquor moves through the rest of the biological process. In simple terms, you are changing who gets first access to the buffet. When properly designed and operated, that competitive advantage can help suppress certain filamentous populations.

Selector performance depends heavily on plant configuration and the organisms involved, so it should not be treated as a universal retrofit. Use process engineering and microbial evidence before changing basin configuration or operating strategy.

MLSS Regulation in STP and ETP

MLSS regulation in STP operation is not about chasing a fashionable target. MLSS represents biomass inventory, and the appropriate operating range depends on the treatment process, influent loading, sludge age, oxygen-transfer capability, clarifier capacity, and desired treatment objectives. Too much biomass can contribute to low-F/M conditions and clarification pressure, while excessive wasting can leave the system without enough active organisms to handle incoming load.

Operators should therefore manage MLSS alongside SVI, sludge age, RAS, wasting rates, effluent quality, and loading trends. These measurements form a feedback loop. If settling deteriorates while MLSS rises and F/M shifts downward, that combination tells a different story from a plant experiencing sudden solids loss after a hydraulic shock.

If your SVI and MLSS trends are moving in the wrong direction before an audit or compliance sampling cycle, request a plant-specific process assessment rather than making several aggressive changes at once. Team One Biotech can support wastewater diagnosis, bioaugmentation planning, and process optimization based on the plant’s actual operating conditions.

A Practical Field Checklist for Operators

When sludge starts bulking, resist the temptation to change everything simultaneously. Work through the plant logically and document what you find. A useful field sequence is:

  • Check DO at several representative locations rather than relying on one aeration-basin reading.
  • Review recent hydraulic and organic loading for shock loads, production changes, cleaning discharges, or flow surges.
  • Examine nutrient availability where industrial wastewater may be nutrient deficient.
  • Inspect channels, equalization tanks, aeration zones, and sludge lines for septic or poorly mixed pockets.
  • Review RAS and wasting practices together with the current MLSS trend.
  • Track sludge volume index wastewater trends and settling observations over time rather than reacting to one test.
  • Use microscopy, where available, to confirm whether filamentous organisms are actually dominating.
  • Consider targeted bioaugmentation after correcting the environmental conditions that created the biological imbalance.

Record each intervention and its timing. Biological systems rarely respond like switches; they behave more like ecosystems recovering after a disturbance. Good records let you connect operational changes with settling improvement and build a plant-specific troubleshooting playbook for the next upset.

Treat the Cause, Not Just the Clarifier

Sludge bulking becomes manageable when you stop seeing it purely as a settling failure and start treating it as a biological signal. Filament overgrowth, oxygen limitation, nutrient deficiency, inappropriate F/M conditions, shock loads, septic zones, and unstable biomass management all change the microbial competition taking place inside an activated sludge system. The secondary clarifier simply reveals the result.

The most reliable answer to how to control sludge bulking is therefore a coordinated biological strategy: diagnose the organism and environmental cause, optimize aeration, restore nutrient balance, correct loading and biomass conditions, use selectors where appropriate, maintain disciplined MLSS regulation in STP, and reinforce beneficial populations through targeted bioaugmentation when justified. Keep SVI and settling behaviour in the feedback loop so you can see whether the biology is genuinely recovering.

If recurring bulking is threatening TSS/BOD performance or making compliance unpredictable, Team One Biotech can help evaluate the biological process and develop a customized bioaugmentation and optimization plan. Visit Team One Biotech to discuss wastewater process assessment, microbial treatment options, and dosing support suited to your STP or ETP.

Operating disclaimer: All references in this article to SVI, DO, MLSS, nutrient ratios, F/M ratio, and related operating conditions are general guidance for typical activated sludge systems. Actual operating ranges vary significantly according to influent characteristics, design capacity, process configuration, industrial sector, temperature, loading pattern, and site-specific conditions. Validate operational changes against your plant’s historical baseline, applicable CPCB/SPCB requirements, consent conditions, and qualified process guidance.

FAQs 

1: Can sludge bulking be controlled without chemicals?

Yes, many bulking problems can be addressed primarily through biological and operational control when the root cause is correctly identified. Aeration optimization, nutrient balancing, loading stabilization, selector operation, MLSS management, RAS and wasting adjustments, and targeted bioaugmentation can all alter the microbial conditions that favour poor-settling organisms. The key is diagnosis: a treatment that works for oxygen-related filament growth may not solve viscous bulking or clarifier denitrification. Chemical intervention should not substitute for understanding the biological cause.

2: Does a high sludge volume index always mean filamentous bulking?

No. A deteriorating sludge volume index wastewater trend tells you that settling or compaction is becoming poorer, but it does not identify the organism or mechanism responsible. Filamentous growth is an important cause, yet viscous bulking, weak floc formation, dispersed growth, hydraulic problems, or other process disturbances can also affect settling behaviour. Use SVI alongside settleability observations, MLSS, operating history, effluent appearance, and microscopy where possible. Think of SVI as an alarm bell, not a complete diagnosis.

3: How quickly can sludge bulking be corrected?

Recovery time varies because activated sludge is biological. A minor problem caused by a recent operating change may respond relatively quickly once that condition is corrected, while an established filamentous population may require a longer period of stable selective pressure before the floc structure improves. Plant configuration, wastewater characteristics, temperature, sludge age, shock loading, nutrient status, and the severity of biomass loss all influence recovery. Rather than promising a fixed timeline, monitor SVI trend, blanket behaviour, effluent solids, microscopic appearance, and overall biological performance.

4: Can bioaugmentation help control filamentous bacteria?

It can be useful when it is part of a properly diagnosed process strategy. Selected cultures can strengthen desirable microbial activity and help rebuild stable biological performance, but bioaugmentation works best when operators simultaneously correct the conditions that allowed unwanted organisms to dominate. Team One Biotech describes its aerobic bioculture solutions as supporting floc formation, organic degradation, shock-load resilience, and control of excessive filament growth and sludge bulking. Treat bioaugmentation as a tool for ecological recovery, not a substitute for adequate oxygen, nutrients, loading control, and biomass management.

5: What should operators monitor after sludge bulking is controlled?

Keep watching the same variables that helped diagnose the upset. Track SVI and settling characteristics, MLSS and biomass trends, RAS and wasting behaviour, DO distribution, influent loading, nutrient conditions, sludge blanket behaviour, and final effluent performance. Where recurring filament problems have occurred, periodic microscopy can provide an early warning before the clarifier visibly deteriorates. Most importantly, establish your own plant’s stable baseline so operators can recognize a slow drift before it becomes a compliance-threatening event.

Looking to improve your ETP/STP efficiency with the right bioculture?
Talk to our experts at Team One Biotech for customised microbial solutions.

Contact+91 8855050575

Email:  sales@teamonebiotech.com

Visit: www.teamonebiotech.com

Discover More on YouTube – Watch our latest insights & innovations!-

Connect with Us on LinkedIn – Stay updated with expert content & trends!
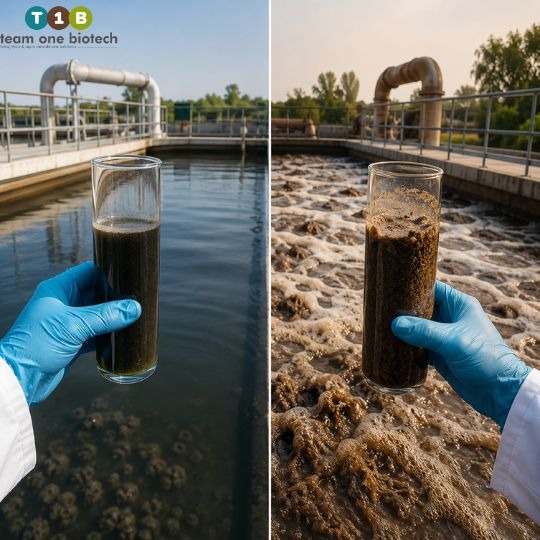
Pharmaceutical Wastewater Treatment: Reducing COD and BOD Without Chemical Overdose

It’s rarely a good sign when your phone rings after midnight and it’s the ETP shift supervisor. Maybe the outlet COD reading spiked. Maybe the pH swung outside range during a batch discharge. Maybe there’s a CPCB inspection scheduled in three days and the numbers from last week still haven’t stabilized. If you manage Industrial wastewater treatment at a pharmaceutical API plant, you already know this feeling, the quiet dread that sits behind every consent-to-operate renewal, every surprise sampling visit, every conversation with a plant head who wants to know why the treatment system that worked fine last quarter suddenly can’t keep up.

The instinctive response, when COD and BOD numbers start creeping toward the edge of compliance, is to reach for more chemicals. More coagulant. More oxidant. More nutrient dosing to keep the biological stage alive under stress. It feels like the safe move, something is clearly better than nothing, and chemicals are fast.

But this is exactly where a lot of pharmaceutical effluent treatment plants get stuck. Chemical overdosing doesn’t just fail to solve the underlying problem, it often creates new ones: more sludge to dispose of, more corrosion in tanks and piping, more residual toxicity hitting the biological stages downstream, and a slow, steady rise in operating cost that never quite translates into proportional compliance gains.

This article is about what actually works instead, the biological, oxidation, and segregation-based strategies that reduce COD and BOD in a way that holds up over time, rather than just buying a few weeks before the next crisis call.

Why API Plant Effluent Is So Difficult to Treat

Pharmaceutical Wastewater Treatment: Reducing COD and BOD Without Chemical Overdose

Pharmaceutical API manufacturing effluent is a different animal from most industrial wastewater. It isn’t simply “high strength” in the way people casually describe difficult effluent, it’s structurally resistant to the kind of treatment that works well for more conventional waste streams.

A few things make API effluent especially stubborn:

  • Recalcitrant organic molecules. Many active pharmaceutical ingredients and their intermediates are specifically designed to resist biological breakdown, that’s part of what makes them effective as drugs, and it’s exactly what makes them hard to treat as waste.
  • Antibiotic and solvent residues. Trace antibiotics can suppress the very microbial populations you’re relying on to digest organic load, while solvent carryover adds toxicity and unpredictability to the mix.
  • Imbalanced COD-to-BOD ratios. A lot of API effluent carries a high proportion of non-biodegradable COD relative to biodegradable BOD, which means standard activated sludge systems are working against the composition of the waste itself, not just its volume.
  • Batch-driven variability. Unlike continuous manufacturing processes, API production tends to generate effluent in batches, so pH, temperature, and organic load can swing significantly from one discharge to the next.

It’s worth pausing on how this compares to something like textile industrial waste BOD challenges, since the two are often discussed in the same breath. Textile effluent is typically high-volume with dyes, salts, and moderate organic load, difficult, but largely biodegradable once color and salinity are managed. Pharmaceutical effluent flips that equation: lower volume, in many cases, but far more chemically stubborn, and far less forgiving of a “treat and forget” approach.

The real risk here isn’t just a failed outlet reading. Undertreated pharma effluent that slips past the primary and secondary stages can disrupt the biological ecosystem further down the treatment train, killing off the microbial cultures a plant depends on for consistent performance, and turning a one-time problem into a weeks-long recovery effort.

The Chemical Overdose Trap, Why More Isn’t Better

The Chemical Overdose Trap, Why More Isn't Better

When COD or BOD numbers start trending in the wrong direction, chemical dosing is the lever every ETP operator can pull immediately, no equipment change, no retrofit, no waiting. Increase the coagulant. Push more oxidant into the system. Add nutrients to try to keep a struggling biological stage functioning. In the short term, it can look like it’s working.

The trouble is what happens after that.

  • Sludge volume climbs. Higher chemical dosing generally means more chemical sludge, which drives up disposal frequency and cost, often the single biggest hidden expense in an over-dosed ETP.
  • Equipment wears faster. Excess oxidants and coagulants are corrosive by nature, and tanks, pumps, and piping degrade faster under chronic overdosing.
  • Downstream biology suffers. Residual chemicals from an overdosed primary stage can carry through and suppress the very biological cultures the secondary stage depends on, creating a cycle where more chemical dosing is needed just to compensate for damage the last round of dosing caused.
  • Costs rise without matching results. Plants often find that operating expense keeps climbing while COD/BOD reduction plateaus, a sign the system is fighting the wrong problem.
  • Secondary parameters drift. Overdosing to fix one parameter can push others, like TDS, or residual chlorine, out of their own compliance range, effectively trading one non-conformance for another.

A quick note before going further: any figures or ranges referenced in this article, including the ones ahead, are general, indicative values meant to illustrate typical patterns, not guaranteed outcomes. Actual dosing thresholds, sludge generation, and treatment results vary significantly depending on ETP design, influent characteristics, and operating conditions, and should always be validated through a site-specific assessment.

Compliance Pressure: Why This Isn’t Just an Operations Problem

Compliance Pressure: Why This Isn't Just an Operations Problem

It’s tempting to treat COD and BOD management as a purely technical exercise, get the numbers within range, move on. But for pharmaceutical API plants, this is fundamentally a business continuity issue, not just an environmental one.

CPCB norms for the pharmaceutical sector are specific and increasingly strict, and many pharma clusters now operate under Zero Liquid Discharge expectations that leave very little margin for error. A pattern of non-compliance doesn’t just mean a warning letter, it can mean:

  • Financial penalties that compound with repeat violations
  • Consent-to-operate revocation, which can halt production entirely
  • Plant shutdown orders, sometimes with limited notice
  • Reputational damage that follows a facility long after the technical issue is resolved

For the ETP manager, this pressure is deeply personal. You’re often the one whose name is on the compliance report, whose judgment gets questioned in the plant head’s office, and whose sleep gets interrupted when a reading looks off. Getting ahead of this, rather than reacting to it, is the difference between managing a routine operational challenge and managing a crisis.

If your plant has an upcoming CPCB inspection cycle, it’s worth getting an effluent and compliance assessment done now, before the pressure builds, not after a notice arrives. A proactive review can surface the gaps that a reactive chemical top-up will never fix.

A Smarter Path, Advanced Biological, Oxidation, and Segregation Strategies

A Smarter Path, Advanced Biological, Oxidation, and Segregation Strategies

The alternative to chemical overdosing isn’t doing less, it’s being more deliberate about where and how treatment effort is applied.

Bioculture-Led Biological Treatment

Standard activated sludge systems are built for general municipal or light industrial waste, they weren’t designed with recalcitrant pharmaceutical molecules in mind. Targeted bioculture treatment, using microbial consortia selected and acclimatized specifically for API effluent characteristics, changes that equation.

These engineered cultures are chosen for their ability to break down the specific complex organics present in a given plant’s effluent stream, rather than relying on a generic microbial population to muddle through. Over time, plants using this kind of targeted biological approach tend to see benefits like:

  • Lower overall sludge generation compared to chemical-heavy treatment
  • Reduced dependency on coagulants and oxidants for routine load
  • More stable, consistent BOD/COD reduction across varying batch conditions

Again, these are general patterns observed across different plant configurations, actual performance depends heavily on the specific bioculture selected, the effluent profile it’s matched to, and how gradually it’s introduced and monitored.

Advanced Oxidation Processes (AOPs)

For the fraction of effluent that resists biological breakdown entirely, certain solvent residues or highly recalcitrant intermediates, advanced oxidation processes serve a different purpose. Ozone-based systems, Fenton-type reactions, and UV-based oxidation work by breaking down these non-biodegradable compounds chemically, converting them into simpler, more biodegradable forms.

The key here is positioning: AOPs work best as a targeted pre-treatment step applied to the hardest-to-treat fraction of the stream, not as a blanket treatment for the entire effluent volume. Used this way, they reduce the biological load that the downstream stage has to handle, rather than trying to replace biological treatment altogether.

Waste Segregation at Source

Of the three strategies here, segregation is often the most overlooked, and frequently the most cost-effective. Mixing high-strength or solvent-laden streams with general wash water dilutes the problem without solving it, and creates shock loading that makes every downstream stage work harder than it needs to.

Practical segregation practices worth implementing:

  • Isolating solvent recovery streams before they reach the main effluent line
  • Separating high-COD batch discharges for dedicated pre-treatment rather than blending them into the general flow
  • Installing or expanding equalization tanks to buffer load variability before it hits the biological stage

Plants that get segregation right often find that the biological and chemical stages downstream perform more predictably simply because they’re no longer absorbing unpredictable shock loads.

Building a Chemical-Light ETP Strategy, What to Prioritize

Pulling this together into something actionable, here’s a practical sequence for ETP managers looking to move away from a chemical-heavy default:

  • Characterize effluent streams individually before designing or redesigning any treatment approach, blended, averaged data hides the streams actually causing problems
  • Introduce bioculture augmentation gradually, with close monitoring, rather than switching over all at once
  • Apply AOPs selectively, targeting the hardest-to-treat fractions rather than the entire effluent volume
  • Segregate at source wherever the plant layout allows it, even partial segregation reduces shock loading meaningfully
  • Track COD/BOD trends over time, rather than reacting to any single reading in isolation, since one anomalous sample rarely tells the full story

If your plant hasn’t had a tailored bioculture or AOP feasibility study done for its specific effluent profile, that’s a reasonable next step before committing to any major treatment redesign. A feasibility study grounded in your actual influent characteristics avoids the guesswork that leads plants back into chemical overdosing in the first place.

FAQ Section

Can biological treatment alone handle high-COD pharmaceutical effluent?

In many cases, biological treatment, particularly bioculture-led systems matched to the specific effluent, can handle a significant portion of the organic load, but the most resistant fractions typically still benefit from a pre-treatment step like advanced oxidation. The right mix depends on the plant’s specific COD composition and how much of it is genuinely biodegradable versus recalcitrant.

How is API plant wastewater different from textile industrial waste in terms of BOD load?

Textile effluent tends to carry high volume with dyes and salinity as the primary challenge, and is generally more readily biodegradable once those factors are addressed. API plant wastewater, by contrast, often carries a lower BOD relative to its COD, with a larger share of non-biodegradable and recalcitrant organic content, making it structurally harder to treat even at similar overall strength.

Does reducing chemical dosing affect compliance with CPCB and ZLD norms?

Reducing chemical dosing doesn’t inherently threaten compliance, in fact, a well-designed biological and segregation-first approach can improve consistency of compliance over time by reducing the swings and side effects that come with chemical overdosing. That said, any change to dosing strategy should be validated through monitoring and, ideally, a site-specific assessment before scaling it across the full plant.

How long does it take to see COD/BOD improvement after introducing bioculture treatment?

Timelines vary considerably depending on the culture used, the effluent characteristics, and how the transition is managed, but plants often begin to see measurable stabilization within a few weeks to a couple of months of gradual introduction. As with all figures in this article, this is a general indicative range, not a guarantee, actual results depend on site-specific conditions and should be tracked and validated through ongoing monitoring.

Conclusion, Compliance Without Compromise

Chemical overdosing feels like the responsible move when COD or BOD numbers start slipping, but it’s a short-term fix that tends to generate long-term costs, from mounting sludge disposal bills to equipment wear to biological systems that never quite stabilize. A biological, oxidation, and segregation-led strategy takes more upfront thought, but it holds up in a way that chemical overkill never does, and it puts the plant in a stronger position for the next CPCB cycle, not just the current one.

If your plant is dealing with persistent COD/BOD challenges, chronic chemical dependency, or the kind of compliance anxiety that keeps you checking readings at odd hours, it’s worth having a real conversation about what a chemical-light strategy would look like for your specific effluent profile. Connect with Team One Biotech for an effluent assessment or a bioculture trial suited to your plant’s actual load and compliance requirements, not a generic fix, but a treatment path built around what your effluent is actually doing.

Looking to improve your ETP/STP efficiency with the right bioculture?
Talk to our experts at Team One Biotech for customised microbial solutions.

Contact+91 8855050575

Email:  sales@teamonebiotech.com

Visit: www.teamonebiotech.com

Discover More on YouTube – Watch our latest insights & innovations!-

Connect with Us on LinkedIn – Stay updated with expert content & trends!
ETP Plant Troubleshooting: Why Your Treatment Is Failing and How to Fix It Biologically

There’s a particular kind of dread that sets in when the lab hands you an outlet report that doesn’t match what your gut was telling you all week. Maybe it’s a COD number that’s crept past your comfort zone for the third day running. Maybe it’s sludge that just won’t settle, no matter how much coagulant you throw at the clarifier. Or maybe it’s worse, an SPCB inspection is already on the calendar, and you’re standing next to an aeration tank at some odd hour trying to figure out what changed.

If any of that sounds familiar, you’re not alone, and you’re not doing anything obviously wrong. Most ETP failures aren’t mysterious once you know where to look. They’re also rarely permanent, provided you’re willing to treat the actual disease instead of dosing your way through the symptoms.

Quick definition for anyone who landed here searching “ETP full form” or “what is ETP”: an effluent treatment plant (ETP) is the system that treats industrial wastewater before it’s discharged or reused, typically combining physical, chemical, and biological stages to bring parameters like BOD, COD, and TSS within regulatory limits. If you’re already running one and it’s misbehaving, you probably don’t need that definition, you need answers. So let’s get into those.

Most ETP breakdowns trace back to a small handful of root causes, and the encouraging part is that most of them can be corrected biologically rather than papered over with another drum of chemical dosing. This piece walks through what failure actually looks like, the three root causes we see most often in the field, and a practical recovery sequence you can start applying this week.

Before we go further, one important note: every range, threshold, or figure mentioned anywhere in this article is a general industry indicator only. Actual acceptable values depend entirely on your plant’s design, influent characteristics, hydraulic load, and the specific CPCB and SPCB norms that apply to your state and industry category. Nothing here should replace your plant’s own baseline data or your consulting engineer’s site-specific recommendations.

What “ETP Failure” Actually Looks Like

What "ETP Failure" Actually Looks Like

Before diagnosing anything, it helps to separate the symptoms from the disease. Operators often chase the symptom, dosing more coagulant, adjusting pH again, running the blower harder, without asking what’s actually breaking down underneath.

The usual suspects show up like this:

  • Rising or erratic COD even though aeration looks completely normal on paper, DO is fine, blowers are running, nothing seems obviously wrong.
  • BOD creeping upward over days or weeks, even while the plant “looks fine” on a walkthrough.
  • Poor sludge settling, bulking sludge, foul odor near the aeration basin, or unexpected foaming on the surface.
  • TSS spikes at the outlet that seem to appear out of nowhere, sometimes only during certain shifts or after certain production batches.

None of these are the actual problem. They’re symptoms of a biological system under stress. Your activated sludge process is, at its core, a living population of microorganisms doing a job, and like any living population, it responds to what you feed it, how much you feed it, and how badly you shock it. Once you start reading these symptoms as biology telling you something, the diagnostic path gets a lot clearer.

The Three Root Causes Behind Most ETP Breakdowns

The Three Root Causes Behind Most ETP Breakdowns

In our experience walking plants back from failure, across textile dyeing units, pharma and API manufacturing, food and beverage facilities, tanneries, and distilleries, nearly every ETP breakdown traces back to one of three root causes, sometimes two working together at once.

Toxic Shock Load

This is the one that scares people, and rightly so. A toxic shock happens when something enters the biological system that the microbial population simply can’t handle, a sudden discharge of disinfectants or cleaning agents, a solvent slug from a batch process, a spike in heavy metals, or an unplanned dump from production that bypasses equalization entirely.

Textile units dealing with dye-bath discharges know this pattern well, and so do pharma and API plants where a solvent recovery miss or an off-spec batch gets routed straight to the ETP instead of being held back.

How it presents is usually unmistakable once you know what you’re looking at: biomass die-off, sludge that goes from healthy brown floc to dark, dead, or sluggish material within hours, and a COD or BOD spike that seems to come from nowhere because the bugs that were supposed to be breaking it down simply aren’t functioning anymore.

The biological fix here isn’t a single dose, it’s a sequence. Reseeding the system with resilient, acclimatized bacterial consortia gives you a microbial population that’s better suited to handle the specific effluent characteristics of your stream. Pairing that with load buffering through equalization tanks means shock loads get diluted and evened out before they ever reach your biology unbuffered. And reintroducing flow in stages, rather than all at once, gives the recovering population room to stabilize instead of getting hit again mid-recovery.

Nutrient Deficiency

This one is quieter and easier to miss because nothing “dramatic” happens, there’s no obvious spill, no foaming crisis, just a slow decline in performance that operators often chalk up to “the plant just isn’t as efficient as it used to be.”

Biology needs a workable balance of organic carbon, nitrogen, and phosphorus to build healthy cell mass and floc structure. Without going into exact ratios, because the right balance genuinely does shift by effluent type and plant design, the short version is that carbon-rich, nutrient-poor streams (distillery effluent and some food and beverage waste streams are classic examples) can starve the microbial population of the nitrogen and phosphorus it needs to grow properly.

The tell-tale signs are weak floc formation that won’t bind together, poor settling in the clarifier even when everything upstream looks chemically normal, and filamentous bulking, those long, thread-like organisms that outcompete the floc-formers when nutrients are out of balance.

The biological fix is targeted nutrient dosing paired with bioaugmentation, so you’re not just adding nitrogen and phosphorus into a system with a depleted microbial population, you’re rebuilding the population itself alongside the nutrient correction. One without the other tends to produce short-lived improvement.

Hydraulic Overload

This is the root cause most likely to get blamed on “the chemistry” when it’s actually a physical problem wearing a chemistry costume. Flow exceeding your plant’s design capacity, whether from a production ramp-up, seasonal demand, or simply more effluent than the ETP was ever sized for, causes short-circuiting through your tanks and cuts your actual retention time well below what your biology needs to do its job.

It presents in a particularly frustrating way: incomplete treatment and TSS carryover at the outlet, even when upstream chemistry, pH, DO, general appearance, looks entirely normal. Operators often spend hours chasing a chemical explanation for a problem that’s fundamentally about time. The water simply isn’t staying in the system long enough for the biology to finish its work.

Fixing this biologically starts with flow equalization and staged loading, so peak flows get smoothed out before they hit your biological reactors. Alongside that, building a more robust and resilient biomass, one that can tolerate variable flow conditions without collapsing every time volumes spike, gives you a system that bends instead of breaking when the next high-flow day arrives.

Why Chemical Fixes Don’t Solve the Real Problem

Why Chemical Fixes Don't Solve the Real Problem

To be clear, chemical treatment has a place. Coagulants, oxidants, and pH correctors are sometimes genuinely necessary, during an active toxic shock, or when you need to hit an outlet number today because an inspection is tomorrow, chemical dosing buys you real, useful time.

But it’s a patch, not a repair. Chemical dosing treats the water sitting in front of you right now. It doesn’t restore the biological population that’s supposed to be breaking down organic load day after day, batch after batch. Once the chemical wears off, or once the next shock load hits, you’re back where you started, because the underlying system that does the actual pollutant breakdown never recovered.

There’s a cost angle here too. Repeated chemical dosing, batch after batch, month after month, tends to be more expensive over the long run than investing in biological recovery once. And critically, it doesn’t build any resilience. A plant running on chemical dosing alone is just as vulnerable to the next shock load as it was before the last one. A plant with a healthy, diverse, acclimatized biological population can absorb some punishment and keep functioning.

Think of it this way: chemistry treats today’s water. Biology treats the system, so tomorrow’s water doesn’t fail too.

A Practical Biological Recovery Plan

A Practical Biological Recovery Plan

If you’re standing in front of a failing plant right now, here’s the sequence we’d walk through with a client, step by step.

Step 1: Isolate and confirm the root cause. 

Sample upstream and downstream of key process points, and check your DO, pH, and sludge volume index against your plant’s historical baseline, remembering again that acceptable ranges here are general indicators and will differ based on your specific design and effluent type. Don’t skip this step to save time; treating the wrong root cause wastes far more time than diagnosing it properly upfront.

Step 2: Stabilize hydraulics before touching biology. 

If flow equalization isn’t in place or isn’t working, fix that first. There’s little point reseeding a bacterial population into a tank that’s still short-circuiting flow, you’ll just shock it again.

Step 3: Reintroduce or boost the bacterial population with targeted bioaugmentation 

Suited specifically to your effluent type, textile dye-bath residues need a different consortia profile than distillery spent wash or pharma solvent-laden streams. Generic, one-size-fits-all cultures tend to underperform against effluent-specific ones for exactly this reason.

Step 4: Monitor and adjust. 

Biological recovery is not instant, and anyone who tells you otherwise is selling you something. Expect a gradual return to stable BOD, COD, and TSS over days to weeks, not hours. Track trends, not single readings, and be prepared to fine-tune nutrient dosing or bioaugmentation rates as the population re-establishes itself.

Preventing the Next Breakdown

Getting the plant stable again is only half the job. The other half is making sure you’re not back here in three months.

A few habits make the biggest difference:

  • Build a routine monitoring cadence. Daily checks on the basics, DO, sludge appearance, settling behavior, and weekly deeper checks on sludge volume index and effluent trends, catch problems while they’re still small.
  • Watch the early warning signs. Sludge color and texture changes, unusual odor near the aeration basin, and a settling time that’s slowly drifting in the wrong direction are all things biology tells you before the outlet report does.
  • Build real buffer and equalization capacity, so shock loads and flow spikes get absorbed before they ever reach your biological reactors unbuffered.
  • Maintain a resilient, diverse bacterial population rather than relying on a single-strain or minimally maintained system. Diversity in your microbial community is what lets the plant absorb the next unexpected load without collapsing.

None of this is complicated. It’s mostly discipline, the kind that’s easy to let slide when things are running fine and hard to rebuild once they’re not.

Frequently Asked Questions

What is ETP and what does ETP stand for?

ETP stands for effluent treatment plant, a system industrial facilities use to treat wastewater before discharge or reuse, typically combining physical, chemical, and biological treatment stages to meet CPCB and SPCB discharge norms.

What is ETP sludge and why does it stop settling?

ETP sludge is the biomass, the living microbial population, that develops in the biological treatment stage and does the actual work of breaking down organic pollutants. It stops settling well when that population is stressed, typically from toxic shock, nutrient imbalance, or filamentous bulking, and needs biological correction rather than just a coagulant dose to recover.

How can I reduce COD in an ETP plant without over-relying on chemicals?

Sustainable COD reduction generally comes from restoring the biological population’s health, through targeted bioaugmentation, nutrient balancing, and proper hydraulic retention time, rather than from oxidant dosing alone, which addresses the water in the tank today but not the underlying system.

Why does my ETP meet BOD limits but still fail on COD?

This pattern often points to non-biodegradable or slowly biodegradable organic load, common in pharma, textile dye, and certain industrial chemical streams, where standard biological treatment breaks down the readily biodegradable fraction (reflected in BOD) but struggles with the harder-to-degrade fraction that still shows up in COD. It can also point to an under-acclimatized microbial population that needs a more suited bacterial consortia.

How long does biological recovery take after a toxic shock load?

Recovery timelines vary considerably by plant and severity of the shock, but as a general indicator, expect a gradual improvement over days to a few weeks rather than an overnight fix, and remember that actual recovery time depends heavily on your specific plant design, effluent characteristics, and how quickly the root cause was addressed.

Stop Firefighting, Start Fixing the Biology

Most ETP breakdowns come down to one of three things: a toxic shock load hitting your biomass unbuffered, a nutrient imbalance quietly starving your microbial population, or a hydraulic overload cutting your retention time short. Once you know which one you’re dealing with, the fix isn’t mysterious, it’s methodical, and it’s biological.

Chemical dosing has its place, particularly when you need to hit a number before tomorrow’s inspection. But it’s a stopgap, not a solution. The plants that stop cycling through repeated failures are the ones that invest in restoring and protecting their biology, through targeted bioaugmentation, proper equalization, and routine monitoring, so the next shock load doesn’t send them right back to where they started.

The compliance stakes are real. CPCB and SPCB limits aren’t going to loosen, and neither is the pressure that comes with an outlet report that doesn’t pass. But a stable, resilient biological system is what actually keeps you within those limits, not a drum of coagulant you’re refilling every week.

If your ETP is fighting you right now, get a free effluent diagnostic from Team One Biotech’s bioremediation team before your next inspection. Better to know what’s actually broken today than to find out the hard way when the SPCB does.

Looking to improve your ETP/STP efficiency with the right bioculture?
Talk to our experts at Team One Biotech for customised microbial solutions.

Contact+91 8855050575

Email:  sales@teamonebiotech.com

Visit: www.teamonebiotech.com

Discover More on YouTube – Watch our latest insights & innovations!-

Connect with Us on LinkedIn – Stay updated with expert content & trends!
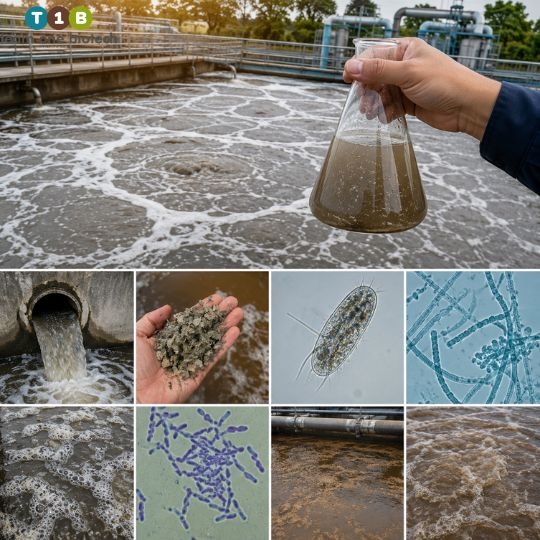
Aerobic vs Anaerobic Wastewater Treatment: Choosing the Right Method

There’s a particular kind of stress that comes with running an effluent treatment plant. It’s not the loud, obvious kind, it’s the quiet dread that builds in the days before a CPCB or SPCB inspection, when you’re not entirely sure your numbers will hold up. It’s the sinking feeling when influent load spikes unexpectedly and you watch your treatment system struggle to keep pace. It’s the budget meeting where someone asks why energy costs keep climbing, and you don’t have a satisfying answer.

If you’re a plant manager, utility head, or process engineer, you already know that the treatment method you choose isn’t just a technical decision, it’s a risk management decision. Pick the wrong system for your load profile, and you’re staring down non-compliance flags, penalty notices, or worse, closure directives. Pick a system that’s technically sound but poorly matched to your space and manpower constraints, and you’re fighting an uphill battle every single day just to keep things running.

This is where the aerobic versus anaerobic wastewater treatment question becomes so important, and so often misunderstood. Both are proven, widely used approaches. Both can deliver compliant discharge quality. But they behave very differently under real-world industrial conditions, and the “right” choice depends heavily on your specific effluent characteristics, available infrastructure, and operational bandwidth.

In this article, we’ll walk through how aerobic sewage treatment and anaerobic wastewater treatment actually work, where each one shines, how they stack up against each other operationally, where an anoxic tank fits into the picture, and how to think through the decision in a way that protects your compliance standing rather than gambling with it. We’ll also touch on the microbiology driving these processes, because understanding what’s actually happening inside your tanks makes troubleshooting, and future-proofing, a lot easier.

Understanding Aerobic Sewage Treatment

Understanding Aerobic Sewage Treatment

Aerobic sewage treatment relies on oxygen-dependent microorganisms to break down organic pollutants in wastewater. Air or pure oxygen is introduced into the treatment tank, through diffusers, surface aerators, or mechanical agitation, creating an environment where aerobic microbes can thrive and metabolize organic matter efficiently. The by-products of this reaction are primarily carbon dioxide, water, and biomass, which is why aerobic systems are generally associated with lower odor generation compared to their anaerobic counterparts.

This method tends to be best suited for effluents with a low-to-moderate organic load, think domestic sewage, or industrial wastewater from sectors like food and beverage, textiles, or light manufacturing, where the organic strength isn’t extreme but consistency and speed of treatment matter.

Energy and aeration considerations:

  • Aerobic systems generally require a continuous or near-continuous supply of oxygen, which translates to a meaningful and ongoing energy demand, a real concern given how energy tariffs have been trending upward across most industrial zones.
  • Aeration equipment (blowers, diffusers, surface aerators) needs regular maintenance, and any inefficiency here directly inflates operating costs.
  • Retention times in aerobic systems tend to fall on the shorter end relative to anaerobic processes, meaning you can often achieve target reductions in a comparatively smaller treatment footprint, a genuine advantage for retrofitted or space-constrained plants.
  • Sludge generation in aerobic systems tends to be higher than in anaerobic systems, which brings its own downstream cost in the form of sludge handling and disposal.

For plants where energy cost isn’t the primary constraint but space and speed of treatment are, aerobic sewage treatment is often the more practical starting point.

Understanding Anaerobic Wastewater Treatment

Understanding Anaerobic Wastewater Treatment

Anaerobic wastewater treatment works in the complete absence of oxygen. Instead of oxygen-breathing microbes, this process relies on anaerobic microbes that break down organic matter through a multi-stage biological pathway, hydrolysis, acidogenesis, acetogenesis, and finally methanogenesis, ultimately producing biogas (a mixture largely composed of methane and carbon dioxide) as a valuable by-product.

This is precisely why anaerobic treatment is often the preferred route for high-strength, high-organic-load effluent, the kind you’d typically see from distilleries, dairies, sugar mills, pulp and paper units, or other sectors where influent BOD and COD levels can vary from moderately high to significantly elevated depending on the process generating the wastewater.

Energy recovery potential vs slower process dynamics:

  • One of the standout advantages of anaerobic treatment is energy recovery. The biogas generated can, in many setups, be captured and used as a fuel source, partially offsetting the plant’s overall energy burden, which is a meaningful counterbalance to rising utility costs.
  • However, anaerobic systems generally operate on longer retention times compared to aerobic systems, since the microbial breakdown pathway is more complex and the organisms involved tend to be slower-growing.
  • Anaerobic microbes are also more sensitive to fluctuations in temperature, pH, and toxic shock loads. A sudden change in influent characteristics can disrupt the microbial balance and take considerably longer to recover from compared to an aerobic system.
  • Odor management is a more prominent consideration here, since by-products like hydrogen sulfide can be generated, meaning that anaerobic systems typically require more robust gas handling and odor control infrastructure.

For plants dealing with consistently high organic loads and looking for a way to offset energy costs through biogas recovery, anaerobic wastewater treatment often makes strong operational and financial sense, provided the system is designed to handle load variability without tipping into instability.

Thinking through whether your influent profile is better suited to aerobic or anaerobic treatment isn’t something you need to work out alone, a plant-specific assessment from Team One Biotech’s bioremediation team can help clarify which direction actually fits your load and infrastructure.

Aerobic and Anaerobic Treatment of Wastewater, Key Operational Differences

Aerobic and Anaerobic Treatment of Wastewater, Key Operational Differences

When you line them up side by side, the aerobic and anaerobic treatment of wastewater differ across nearly every operational dimension that matters to a plant manager under compliance pressure:

  • Organic load handling capacity: Aerobic systems perform well with low-to-moderate organic loads; anaerobic systems are generally better equipped to handle high-strength, high-organic-load effluent.
  • Energy requirement: Aerobic treatment tends to demand higher ongoing energy input for aeration; anaerobic treatment tends to require less external energy and can offset a portion of demand through biogas recovery.
  • Sludge generation: Aerobic processes generally produce a higher volume of sludge requiring disposal; anaerobic processes tend to generate comparatively lower sludge volumes.
  • Space and infrastructure needs: Aerobic systems often need less land area for a given treatment capacity; anaerobic systems, particularly those using lagoons or larger digesters, can require a larger footprint, though compact anaerobic reactor designs have narrowed this gap considerably.
  • Retention time: Aerobic systems typically operate on shorter retention times; anaerobic systems generally require a longer retention period to achieve comparable reductions.
  • Odor and by-product management: Aerobic systems tend to generate lower odor levels; anaerobic systems require more deliberate gas capture and odor mitigation measures, though this is offset by the value of biogas recovery.

None of this is abstract for a compliance-focused plant manager. Your ability to consistently hit target reductions in BOD, COD, and suspended solids, the numbers CPCB and SPCB inspectors care about, depends directly on matching your treatment method to your actual load profile. A plant running an aerobic system against a load it wasn’t designed for will chronically underperform, and repeated underperformance is exactly what triggers regulatory scrutiny and penalty exposure.

Where the Anoxic Tank Fits In

This is where a lot of confusion creeps in, so let’s clear it up directly: an anoxic tank is not the same as an anaerobic tank, even though the terms sound similar and are frequently mixed up in casual conversation.

An anoxic tank in a sewage treatment plant operates in a low-oxygen environment, not entirely oxygen-free like an anaerobic system, but with dissolved oxygen levels low enough that specific microbial processes, particularly denitrification, can occur. In an anoxic tank, facultative bacteria use the oxygen bound in nitrate molecules (rather than free dissolved oxygen) to break down organic matter, converting nitrates into nitrogen gas that’s released to the atmosphere.

The distinction matters because:

  • Anaerobic conditions involve a complete absence of oxygen (and nitrates), typically used for organic load reduction and biogas generation.
  • Anoxic conditions involve a controlled, low-oxygen environment specifically used for nitrogen removal.

This is why many modern ETPs are moving toward a hybrid approach, combining anaerobic, anoxic, and aerobic stages in sequence to tackle organic load reduction, nitrogen removal, and final polishing all within one integrated system. For plants facing stricter nutrient discharge norms alongside conventional BOD/COD requirements, incorporating an anoxic stage is often what closes the compliance gap that a purely aerobic or purely anaerobic system can’t address on its own.

The Microbiology Behind It, Anaerobic Microbes vs Heterotrophic Microbes

The Microbiology Behind It, Anaerobic Microbes vs Heterotrophic Microbes

You don’t need a microbiology degree to run a compliant plant, but understanding the basic players involved makes a real difference when something goes wrong and you’re trying to figure out why.

Anaerobic microbes are organisms that survive and function without oxygen. They work in coordinated stages, some breaking down complex organic molecules into simpler compounds, others converting those compounds into acids, and finally, methanogenic organisms converting those acids into methane-rich biogas. These microbes tend to be slower-growing and more sensitive to environmental swings, which is why anaerobic systems can take noticeably longer to recover from a shock load or process upset.

Heterotrophic microbes, on the other hand, are organisms, typically found in aerobic and anoxic systems, that derive their energy from consuming organic carbon compounds, using oxygen (or in the anoxic case, nitrate-bound oxygen) as part of their metabolic process. They tend to be faster-growing and generally more resilient to moderate fluctuations in load, which contributes to the comparatively quicker recovery times seen in aerobic systems.

Why does this matter for compliance outcomes? Because microbial balance is essentially the engine driving your treatment performance. If your system’s dominant microbial population isn’t well-matched to your actual influent characteristics, too much organic shock for a slow-recovering anaerobic culture, or insufficient oxygen supply for a heterotrophic-dominant aerobic system, you’ll see it directly in your effluent quality reports, and eventually in your inspection outcomes.

Anoxic vs Anaerobic vs Aerobic Treatment, Which One Do You Actually Need?

This is the question that actually matters at the end of the day. Here’s a practical way to think through it:

Choose aerobic sewage treatment if:

  • Your influent organic load is low to moderate and relatively consistent
  • You have significant space constraints and need a smaller treatment footprint
  • You need faster treatment cycles and quicker recovery from minor load variations
  • Energy cost is a manageable line item relative to your overall operating budget

Choose anaerobic wastewater treatment if:

  • Your influent is high-strength or high-organic-load in nature
  • You want to offset energy costs through biogas recovery
  • You have adequate space and can accommodate longer retention times
  • Your influent characteristics are relatively stable, minimizing the risk of shock-load disruption

Consider a hybrid or anoxic-inclusive approach if:

  • You’re facing both organic load and nitrogen removal requirements
  • Your existing system is aerobic-only or anaerobic-only but isn’t consistently hitting compliance targets
  • You’re retrofitting an older plant and need a more flexible, multi-stage design that can absorb fluctuating loads without triggering non-compliance flags
  • You want a more dependable buffer against the kind of variability that industrial effluent often brings

When it comes to reliability under fluctuating load conditions, which is the reality for most industrial plants, a well-designed hybrid system generally offers the most dependable path to consistent compliance, since it isn’t relying on a single microbial process to absorb every kind of variability your influent throws at it.

A Note on the Numbers

Throughout this article, we’ve deliberately avoided citing exact figures for BOD, COD, retention times, or efficiency percentages, and there’s a good reason for that: every ETP is different. The values and ranges referenced here are general industry indicators only. Actual performance figures for your plant will depend on your specific influent characteristics, system design, hydraulic and organic loading rates, temperature conditions, and day-to-day operating practices.

Treating any generic number as a benchmark for your own plant can be misleading, and in a compliance context, misleading assumptions are exactly what create risk. If you want to understand where your plant genuinely stands relative to CPCB and SPCB norms, the most reliable path is a plant-specific assessment, not a generic industry figure.

This is exactly the kind of clarity Team One Biotech’s bioremediation experts can provide, a detailed look at your actual influent profile, existing infrastructure, and compliance gaps, so your treatment decisions are based on your plant’s reality rather than general assumptions.

FAQs

Is aerobic or anaerobic treatment better for compliance with CPCB norms?

Neither is universally “better”, it depends on your influent load and design. Aerobic sewage treatment often performs more predictably for low-to-moderate organic loads, while anaerobic wastewater treatment is generally more effective for high-strength effluent. Many plants achieve the most dependable CPCB and SPCB compliance through a hybrid system that combines both approaches.

Can a plant use both aerobic and anaerobic treatment together?

Yes, and many modern ETPs do exactly this. A common configuration uses anaerobic treatment as a first stage to handle high organic loads and generate biogas, followed by aerobic (and often anoxic) stages for further polishing and nitrogen removal before final discharge.

What is the role of an anoxic tank in a sewage treatment plant?

An anoxic tank operates in a low-oxygen environment specifically to support denitrification, the conversion of nitrates into nitrogen gas, which helps plants meet nutrient-related discharge norms alongside conventional BOD and COD reduction targets.

How do heterotrophic microbes differ from anaerobic microbes in treatment performance?

Heterotrophic microbes generally operate in aerobic and anoxic environments, tend to be faster-growing, and recover more quickly from load fluctuations. Anaerobic microbes operate without any oxygen, work through a multi-stage biological pathway, and tend to be slower-growing and more sensitive to shock loads, though they offer the added benefit of biogas generation.

Making the Right Call for Your Plant

Choosing between aerobic sewage treatment, anaerobic wastewater treatment, or a hybrid anoxic-inclusive design ultimately comes down to a handful of decision factors:

  • Your load profile, how strong and how variable is your influent, realistically?
  • Your space availability, are you working within a fixed retrofitted footprint, or do you have room to expand?
  • Your energy budget, can you absorb the ongoing demand of an aerobic system, or would biogas recovery meaningfully help your bottom line?
  • Your compliance risk tolerance, how much buffer do you need against shock loads and inspection uncertainty?
  • Your manpower and O&M capacity, do you have the skilled staff to manage a more complex multi-stage system, or do you need something more straightforward to operate day to day?

There’s no universally “correct” answer here, only the answer that’s correct for your specific plant. And getting that answer right the first time is far less costly, in every sense, than retrofitting a poorly matched system after a compliance failure.

If you’re weighing this decision right now, whether you’re designing a new ETP from scratch, troubleshooting an underperforming system, or trying to figure out why your current setup isn’t holding up under inspection, Team One Biotech’s bioremediation experts are ready to help. From plant-specific assessments to customized bioaugmentation and treatment optimization solutions, we work directly with plant managers and engineers to build treatment systems that hold up under real operating pressure, not just on paper. Reach out to explore what a properly matched aerobic, anaerobic, or hybrid treatment solution could do for your compliance standing and your operating costs.

Looking to improve your ETP/STP efficiency with the right bioculture?
Talk to our experts at Team One Biotech for customised microbial solutions.

Contact+91 8855050575

Email:  sales@teamonebiotech.com

Visit: www.teamonebiotech.com

Discover More on YouTube – Watch our latest insights & innovations!-

Connect with Us on LinkedIn – Stay updated with expert content & trends!
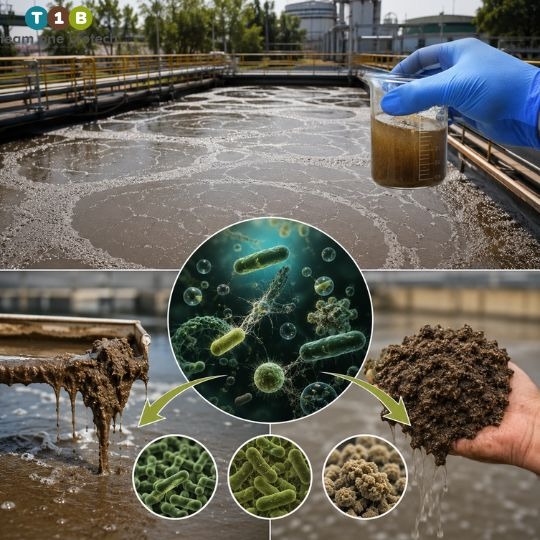
SBR vs Conventional Activated Sludge: Which Is Better For Your Plant

There’s a particular kind of stress that comes with running a wastewater treatment plant that isn’t performing the way it should. It’s the phone call from the pollution control board asking why your effluent samples failed the last inspection. It’s the odor complaint from a neighboring facility that lands on your desk right before a management review. It’s the quiet dread of knowing your plant was designed for a load profile that no longer matches what’s actually coming through the inlet.

Choosing a treatment technology isn’t just an engineering decision, it’s a decision that follows a plant for its entire operating life. Get it right, and you have a system that adapts to your flow, meets your compliance obligations without drama, and doesn’t eat through your operating budget. Get it wrong, and you’re looking at retrofits, penalty notices, and years of firefighting.

Two of the most common technologies plant owners and consultants weigh against each other are the sequential batch reactor (SBR) and conventional activated sludge (CAS). Both are proven, both are widely used across Indian municipal and industrial plants, and both can meet CPCB and SPCB effluent norms when designed and operated well. But they arrive at that outcome very differently, and the differences matter a great deal depending on your plant type, your flow pattern, and how tightly you need to control nutrient removal.

This article walks through how SBR and CAS actually compare, footprint, capital and operating cost, treatment efficiency, and regulatory fit, so you can approach the decision with a clearer head, not just a spec sheet.

What Is SBR? (Sequencing Batch Reactor Explained)

What Is SBR? (Sequencing Batch Reactor Explained)

If you’ve been searching for sbr full form or what is SBR, here’s the plain-language version: a sequential batch reactor, sometimes called a sequencing batch reactor, is a wastewater treatment system that carries out all the major treatment steps, aeration, biological treatment, and settling, inside a single tank, one phase at a time, rather than across multiple tanks running continuously.

Instead of water flowing constantly from one unit to the next, an SBR tank operates in cycles. Each cycle typically moves through the following phases:

  • Fill, raw or partially treated wastewater enters the tank
  • React, aeration and biological treatment take place, breaking down organic load
  • Settle, aeration stops, and solids settle to the bottom of the tank
  • Decant, clarified water is drawn off from the top
  • Idle, the tank rests briefly before the next fill cycle begins

You can think of this as a conceptual SBR process flow diagram, one tank, five phases, repeating in sequence. Because everything happens in one vessel, SBR technology is especially popular in decentralized plants and municipal sewage treatment plants (STPs), where land is limited but treatment flexibility is still needed, and where domestic sewage flow, while it does vary through the day, tends to follow a fairly predictable diurnal pattern that batch cycling handles well.

What Is Conventional Activated Sludge (CAS)?

What Is Conventional Activated Sludge (CAS)?

Conventional activated sludge, or CAS, takes a more traditional route. Instead of batching everything into one tank, CAS relies on continuous flow through a series of separate units, typically an aeration tank followed by a secondary clarifier, sometimes with additional tanks for primary settling or sludge handling.

Wastewater moves through the system constantly. The aeration tank keeps biological treatment running around the clock, while the clarifier continuously separates treated water from settled sludge. There’s no pause, no cycling, just steady, ongoing flow through dedicated units.

This structural difference, continuous flow across multiple tanks versus batch treatment in a single tank, is really the core distinction between the two technologies, and it’s what drives most of the downstream differences in cost, footprint, and flexibility.

CAS tends to show up most often in industrial effluent treatment plants (ETPs), where continuous production processes generate a steady, more concentrated effluent stream that needs round-the-clock treatment without the pauses built into a batch cycle. Many industrial facilities run multi-shift, continuous operations, and CAS’s uninterrupted flow-through design matches that operating rhythm more directly than a cycling tank does.

SBR vs CAS, Key Comparison Factors

SBR vs CAS, Key Comparison Factors

Footprint and Space Requirements

This is usually the first thing plant owners ask about, especially in urban or space-constrained sites.

  • SBR generally needs a smaller footprint because a single tank handles multiple treatment phases sequentially, there’s no need for separate aeration and clarification structures. This is a large part of why SBR is such a common choice for municipal STPs sited in dense urban areas.
  • CAS typically requires more land, since aeration and clarification happen in physically separate units that both need civil construction and piping. Industrial sites, however, are often better positioned to accommodate this, since ETPs are frequently built alongside the industrial facility itself, on land already allocated for utilities.

In general terms, SBR can reduce land requirement by a moderate-to-significant margin compared to CAS, though the exact difference depends heavily on plant capacity and design choices.

Note: The comparisons above reflect general industry patterns and are indicative only. Actual footprint, cost, energy consumption, and compliance performance vary depending on individual plant design, influent characteristics, flow variability, and site-specific conditions. A plant-specific evaluation is recommended before making a final technology decision.

Capital Expenditure (CapEx)

Neither technology is a clear winner on upfront cost, it really comes down to trade-offs.

  • SBR typically needs fewer tanks and less civil construction, but requires more sophisticated automation, instrumentation, and control systems to manage the cycling process.
  • CAS usually involves simpler mechanical and electrical requirements, but the multiple-tank layout means more civil work, more piping, and a larger overall construction footprint.

Which one ends up costing more depends on your plant’s scale, site conditions, and how much automation you’re planning to invest in from day one. A municipal STP with tight land constraints may find SBR’s compact design offsets its automation cost. An industrial ETP with dedicated utility land and a need for robust, continuous treatment may find CAS’s simpler, well-proven equipment keeps costs and performance more predictable over the plant’s life.

Operational Costs (OpEx)

Three things drive ongoing operating cost in either system: power consumption, manpower, and maintenance.

  • SBR systems, thanks to automation, often reduce the need for constant manual monitoring, but energy use can vary depending on how the cycle is designed and how frequently phases run.
  • CAS systems run continuously, which tends to make energy and staffing needs more predictable, an advantage for industrial plants that already run continuous operations and have dedicated technical staff on-site around the clock to manage a steady-state process.

Rather than putting hard numbers on this, it’s more useful to think of it qualitatively: SBR trades manual labor for smarter automation and variable energy cycles, which suits municipal operators managing a facility with a leaner team, while CAS trades some automation simplicity for steady, continuous demand on both power and personnel, a trade-off that fits naturally with an industrial site that already staffs for continuous production.

Treatment Efficiency and Effluent Quality

Both technologies are capable of producing effluent that meets CPCB and SPCB norms for BOD, COD, TSS, and nutrient parameters, the technology itself isn’t usually the reason a plant fails compliance. Poor design or inconsistent operation is.

That said, there are real differences in how each system handles the kind of load each is best suited to:

  • SBR’s cycle timing can be adjusted, which gives it an edge for municipal STPs managing nitrogen and phosphorus removal from domestic sewage, you can extend or modify react and settle phases to target specific nutrient reduction goals as diurnal flow shifts through the day.
  • CAS is well-proven for the steady, high-strength, continuous flows typical of industrial effluent, its round-the-clock aeration and clarification are built for exactly that kind of sustained organic and chemical load, without the interruptions a batch cycle would introduce.

If your plant is a large industrial facility with a continuous production process, that steady-state design tends to match your effluent profile more closely than a batch system would.

Compliance and Regulatory Considerations (CPCB/SPCB Focus)

This is where the decision stops being purely technical and starts being existential for a lot of plant owners. A CPCB or SPCB compliance notice isn’t just a paperwork problem, it can mean fines, forced shutdowns, or reputational damage that follows a facility for years.

  • SBR’s flexible cycle control can help municipal STPs hit variable effluent norms more consistently across the day’s flow pattern, particularly where nutrient limits are strict.
  • CAS’s continuous, well-characterized treatment process is often preferred for industrial ETPs, where effluent composition needs consistent, round-the-clock control and where regulators are used to seeing CAS as the established, proven technology for industrial discharge.

It’s worth repeating: these are general industry patterns, not guarantees. Actual compliance performance depends on your plant’s specific design, your operations and maintenance practices, and how variable your influent really is.

Flexibility, Scalability, and Ease of Upgrade

Plants rarely stay the same size or load profile forever, so it’s worth thinking ahead.

  • SBR systems are generally easier to adjust for municipal STPs, cycle times can be modified to accommodate changing population-driven flow, and the design lends itself well to phased capacity expansion as a town or city grows.
  • CAS systems typically require adding new tanks or units to scale up, which is more common in industrial settings where capacity expansion is planned alongside broader facility upgrades and where land for additional units is already budgeted into the site plan.

Every Plant Is Different, Get a Site-Specific View Before You Decide

Every Plant Is Different, Get a Site-Specific View Before You Decide

Everything above reflects general patterns, but no two plants are identical. Your raw water quality, your flow pattern, your land availability, and your compliance targets all interact in ways that a generic comparison simply can’t capture. Before finalizing a technology, it’s worth getting a professional assessment specific to your site, one that looks at your actual influent characteristics and operational constraints, not just industry averages.

Which One Should You Choose? A Practical Decision Framework

There’s no universal right answer here, but some patterns tend to hold up across most plants.

SBR tends to make more sense when:

  • You’re building or upgrading a municipal sewage treatment plant (STP)
  • Land availability is limited or expensive
  • Domestic flow follows a variable diurnal pattern rather than a continuous industrial load
  • Nutrient removal targets (nitrogen, phosphorus) are strict or likely to tighten in the future
  • You have the ability to invest in automation and skilled operational oversight

CAS tends to make more sense when:

  • You’re running an industrial effluent treatment plant (ETP) tied to a continuous production process
  • Your facility already operates round-the-clock with dedicated technical staff
  • Civil infrastructure and land are already available or established on-site
  • You need a proven, continuous-flow system for steady, high-strength industrial effluent

This is directional guidance, not a one-size-fits-all rule. Every plant has its own quirks, and the right answer often sits somewhere between “textbook SBR plant” and “textbook CAS plant.”

Common Concerns Plant Owners and Engineers Raise

A few objections come up again and again when this decision is on the table. Worth addressing them directly:

“Does SBR have odor issues?”

 Odor control in SBR systems depends heavily on aeration design and tank covering, it’s manageable with the right design choices, but it does need to be planned for, not treated as an afterthought.

“Is sludge handling harder with SBR?” 

Not inherently harder, but different, since settling and decanting happen in the same tank, sludge wasting needs to be timed carefully within the cycle rather than continuously, as it is in CAS.

“Can we retrofit our existing CAS plant with SBR technology?” 

Often possible in municipal settings, depending on existing tank geometry and available land. For industrial ETPs, retrofitting to SBR is less common in practice, since continuous production flows are generally better served by staying with CAS. Retrofit feasibility really needs a site visit rather than a generic answer, since existing civil structures play a big role in what’s practical.

“Does SBR require more skilled manpower to run?” 

Generally, yes to some degree, the automation and cycle-based control mean operators need a solid understanding of the system’s logic, though this is often offset by reduced day-to-day manual monitoring, and is well within reach for the operational teams that typically run municipal STPs.

FAQ Section

What is the full form of SBR in wastewater treatment? 

SBR stands for sequential batch reactor, also referred to as a sequencing batch reactor. It’s a treatment system where fill, react, settle, decant, and idle phases all happen in one tank, in sequence, rather than continuously across separate units.

Is SBR better than conventional activated sludge for municipal STPs? 

For municipal sewage treatment plants, especially those with limited land, SBR is often favored because of its compact single-tank design and its ability to flex with the diurnal flow pattern typical of domestic sewage.

Is CAS better than SBR for industrial ETPs? 

For industrial effluent treatment plants, CAS is generally the preferred technology. Continuous production processes produce a steady, high-strength effluent stream that suits CAS’s round-the-clock, continuous-flow design, and industrial sites are typically better positioned to accommodate the larger footprint CAS requires.

Does SBR need more skilled manpower to operate than CAS? 

Generally, yes, SBR relies on automated cycle control, so operators need to understand the system’s logic and be able to troubleshoot phase timing. CAS, being continuous and more mechanically straightforward, is often considered easier for teams less familiar with automated systems, which is one reason it remains the standard choice for industrial ETPs.

Which technology better supports CPCB/SPCB compliance for industrial effluent?

CAS is the more established and widely accepted technology for industrial ETP compliance, given its proven track record with continuous, high-strength industrial discharge. Actual compliance outcomes still depend more on design quality and operational discipline than on the technology alone.

Making the Right Choice for Your Plant

Neither SBR nor conventional activated sludge is universally “better” in the abstract, but the two technologies do tend to map onto different plant types. Municipal STPs, with their variable diurnal domestic flow and land constraints, are frequently better served by SBR. Industrial ETPs, with their continuous production-driven effluent and typically larger available land, are frequently better served by CAS. What works well for a municipal STP may be entirely wrong for an industrial facility, and vice versa.

Getting this decision right isn’t just an engineering exercise. It’s what protects your plant from regulatory trouble, unplanned budget overruns, and the kind of operational headaches that drag on for years after the concrete has already been poured.

Before you finalize your technology choice, it’s worth talking to people who look at this decision every day. Team One Biotech’s bioremediation and wastewater treatment experts can walk through your plant’s specific land, load, and compliance requirements and help you land on a system that actually fits, not just one that looks good on a comparison chart. Reach out for a site-specific assessment before you commit to a direction you’ll be living with for a long time.

Looking to improve your ETP/STP efficiency with the right bioculture?
Talk to our experts at Team One Biotech for customised microbial solutions.

Contact+91 8855050575

Email:  sales@teamonebiotech.com

Visit: www.teamonebiotech.com

Discover More on YouTube – Watch our latest insights & innovations!-

Connect with Us on LinkedIn – Stay updated with expert content & trends!
Scan the code