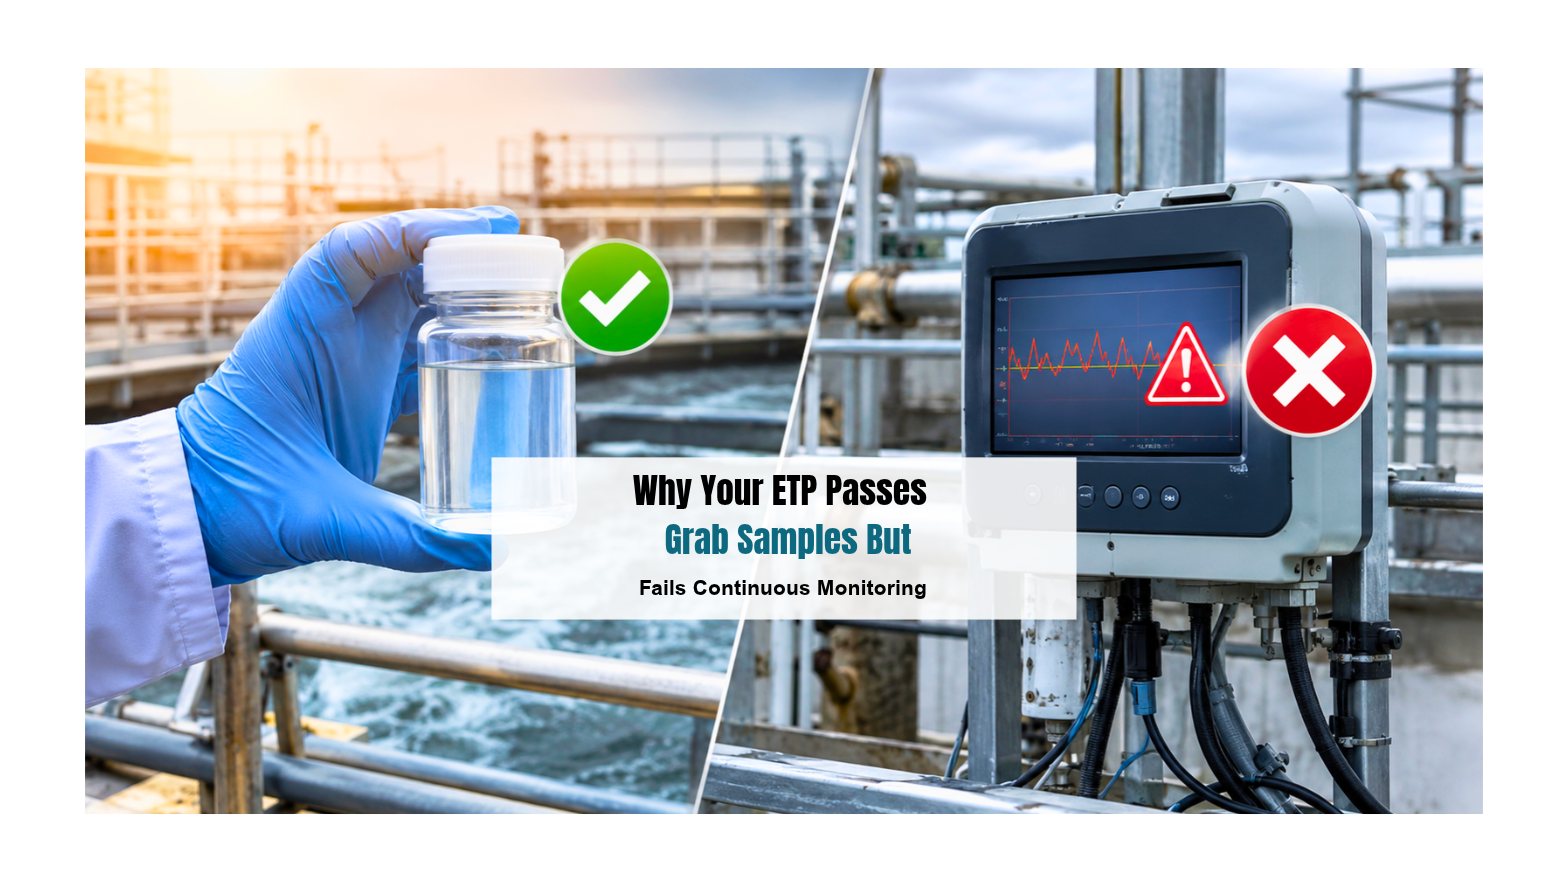
Why Your ETP Passes Grab Samples But Fails Continuous Monitoring
The lab report is clean. The grab sample passed, the team is relaxed, and someone has already said, “We’re fine this month.” Then the OCEMS dashboard turns red. Worse, the alert has reached the regulator’s server before it reached your desk. Your phone starts ringing, management wants answers, and the first question is always the same: how can the lab say we’re compliant while the analyzer says we’re not?
If this is happening at your plant, you’re dealing with a classic OCEMS compliance failure, and you’re not alone. It’s common, it’s explainable, and it’s fixable. This blog explains why grab samples and continuous monitoring disagree, where the real causes sit (in the sensors, the biology, and the operations), and what you can do to flatten the spikes.
Keep reading. The hidden causes are usually closer to your aeration tank than to your analyzer.
What Is Really Happening When Grab Samples and OCEMS Disagree
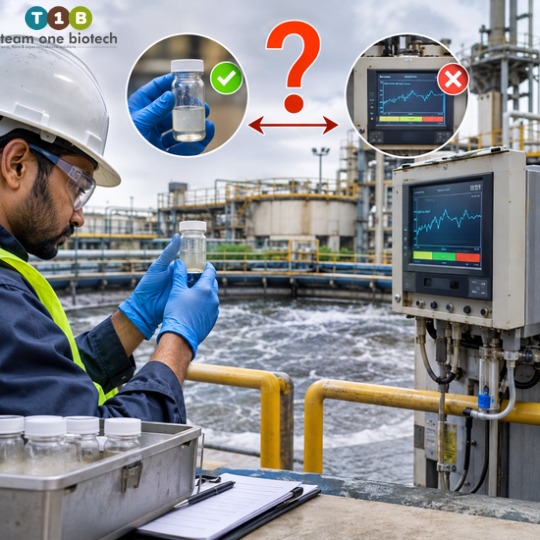
Think of a grab sample as a single photograph. It’s sharp, accurate, and tested by a proper lab method. But it only shows one moment, at one location, collected by one person.
Your continuous effluent quality monitoring system (EQMS) is the entire film. It records what happens before, during, and after that photograph, including the scenes you’d rather not see: the surge after a shift change, the batch drained from a process tank, the sludge carryover when the clarifier is stressed.
Here’s the uncomfortable part. Both can be right at the same time. The grab sample correctly says the effluent was within limits at that moment. The OCEMS correctly says the effluent wasn’t within limits at other moments. The regulator, however, reads the film, not the photograph.
Under current expectations, OCEMS data flows in real time to the CPCB and SPCB servers. Your plant head isn’t the first audience. That’s why ETP grab sample vs online monitoring is no longer a lab argument. It’s a compliance reality.
| Aspect | Grab Sample | Continuous OCEMS |
| Timing | Scheduled, often predictable | Around the clock, unannounced |
| Coverage | One moment, one point | Entire operating period |
| Bias risk | Depends on who samples, where, and when | Depends on sensor condition and placement |
| Peak detection | Usually misses short peaks | Captures peaks and trends |
| Regulatory visibility | Seen when submitted or inspected | Seen live on the regulator’s server |
| What it can miss | Surges, shock loads, off-hour discharges | Lab-grade accuracy if the sensor drifts |
Why Grab Samples Can Hide an OCEMS Compliance Failure
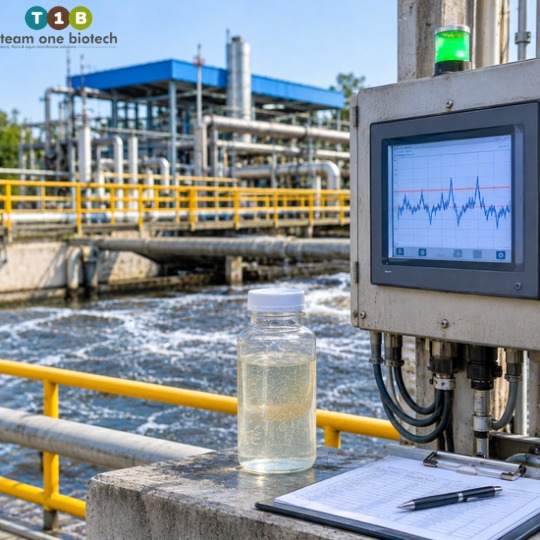
A clean grab sample is not a lie. It’s just incomplete. Here’s how it usually hides the problem.
Sampling bias
Who samples, from where, and at what time matters more than most plants admit. A sample taken from the calm end of the outlet channel, at mid-morning, by a careful technician, will almost always look better than the average of the day.
Predictable testing windows
When sampling follows a schedule, the plant behaves its best during that window. Operators watch the aeration, trim the load, and hold back any batch discharge. That’s human nature, but the microbes and the process don’t behave that way at 2 a.m.
Dilution effects
Rain ingress, cooling water, and mixing in the final tank can mask the true quality. Stored or batch discharge works the other way. The effluent can look fine for hours, then a concentrated slug leaves the plant. In many plants, the variation between a calm period and a peak period can be roughly 20 to 40 percent or more, and that’s enough to cross a limit.
Composite versus instantaneous results
A composite sample averages out the peaks. A sensor reading is instantaneous. If your lab reports a composite and the regulator sees instantaneous trends, the two will never match perfectly, and that gap is where many show-cause notices begin.
Lab method versus sensor method
The lab measures COD or BOD by a defined chemical or biological method. The sensor estimates the same parameter optically. The two methods respond differently to color, turbidity, and organics, so some difference is expected even when everything is working.
Note: The values and ranges mentioned here are general indications only. Actual figures differ from one ETP to another based on industry type, process load, design, and operating conditions.
Why Continuous Monitoring Catches What Spot Tests Miss
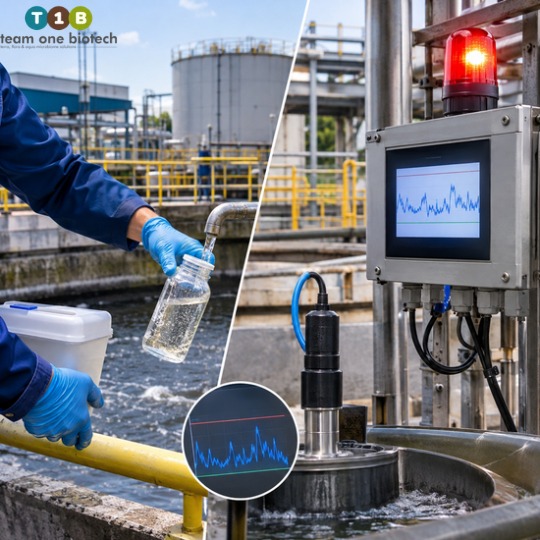
Continuous systems don’t take breaks, don’t know your schedule, and don’t forgive a bad hour. Here’s what they actually pick up.
The sensing principle
Many analyzers use a UV-Vis spectrophotometer COD sensor, which estimates COD, and sometimes BOD and TSS, from how the effluent absorbs light. It reacts quickly to changes in color, turbidity, and dissolved organics. A burst of dye, a puff of solids, or a stronger organic slug shows up almost immediately.
Real operational events
Peak hydraulic surges, shift change discharges, CIP cycles, and batch dumping all produce short, sharp excursions. A grab sample rarely lands on them. A sensor always does.
Probe drift and calibration gaps
Optical sensors drift over time. If calibration is late or the reference isn’t checked against the lab, the baseline slowly moves and readings look worse (or better) than reality.
Bio-fouling and scaling
OCEMS probe drift and bio-fouling often go together. A slimy film on the probe window, scale in the sample line, or a dirty flow cell can push readings up without any real change in effluent quality.
Sensor location and conditioning
Where the sample is drawn and how it’s conditioned (filtered, settled, pumped) affects the reading. A poorly placed line can pick up settled solids or air bubbles.
The honest part: sometimes the sensor is wrong
Not every red alert is a real breach, and blaming the plant blindly is as unhelpful as blaming the instrument blindly. Good practice is to validate: compare OCEMS readings against regular lab results, look at the correlation over weeks, and check whether spikes line up with real events in the plant log. If a spike has no operational explanation and disappears after cleaning the probe, you’ve likely found a sensor issue. If it follows a batch discharge or a clarifier upset, it’s real.
Plant Reality Check
Most “mystery” spikes aren’t mysterious. Pull your shift log, your discharge schedule, and your alert time-stamps side by side. In many plants, the spike and the event are sitting in the same hour, and nobody had put the two sheets next to each other.
The Biological Root Causes Behind Hidden Parameter Spikes
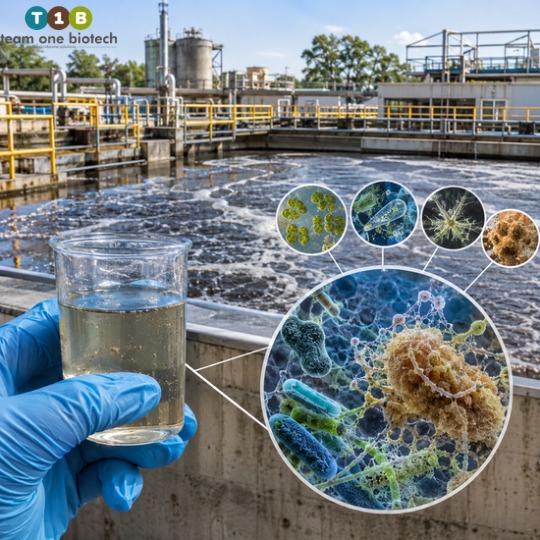
Even when the sensors are perfect, the biology decides what the sensor sees. Short-lived peaks of COD BOD TSS spikes in effluent usually start in the biological stage.
Unstable biomass
When the incoming load swings widely, the microbial population can’t keep pace. A weak or fluctuating biomass degrades organics unevenly, and the outlet quality follows the same pattern.
Nutrient imbalance and oxygen gaps
Missing nitrogen or phosphorus slows degradation. Low dissolved oxygen zones and uneven aeration leave parts of the tank under-performing, even if the average DO looks acceptable.
Sludge bulking and clarifier carryover
In Sludge Bulking – Filamentous growth, floc breakup, or a hydraulic push through the secondary clarifier carries solids over the weir. That drives TSS up, and since those solids carry organic matter, COD rises with them.
Toxic and inhibitory shocks
A sudden dose of biocide, strong acid or alkali, or a concentrated process stream can suppress the microbes. The real damage isn’t just the shock itself. It’s the slow recovery that follows, with poor quality for hours or even days.
Color and recalcitrant organics
Some compounds, especially in dye, chemical, and pharma streams, aren’t broken down by ordinary biomass. They pass through, and an optical sensor notices them quickly.
Note: The values and ranges mentioned here are general indications only. Actual figures differ from one ETP to another based on industry type, process load, design, and operating conditions.
Talk to Team One Biotech’s technical team for a plant-specific assessment. We’ll help you trace whether your spikes begin in the sensor, the process, or the biology.
How to Flatten the Spikes and Achieve True 24/7 Compliance
You can’t remove every disturbance, but you can stop the plant from passing them straight to the outlet. Here’s how plants typically do it.
1. Equalization: smooth the load before it reaches the biology
A well-designed equalization tank ETP buffers flow and load so the biological stage sees a steadier feed. Check three things: whether the tank is sized for your actual peak pattern, whether it’s mixed properly so concentrated slugs don’t sit in dead zones, and whether pumping is controlled rather than surge-driven. Pumping on a gentle, steady profile often does more for your OCEMS trend than any single equipment upgrade.
2. Biological stabilization: build a population that can take a hit
Biological stabilization of ETP means keeping a strong, diverse, active microbial community that handles load swings and recovers quickly. This is where bioremediation for effluent treatment becomes a practical tool. Team One Biotech’s bioremediation solutions are used to support stable biology, improve shock-load resilience, and help the plant return to normal faster after a disturbance. The goal is consistent effluent quality, not a promise of zero violations. Results depend on the plant’s design, load, and how well the basics are managed.
3. Process control: keep the basics tight
Control dissolved oxygen so no zone starves. Dose nutrients to match load. Watch the food-to-microorganism balance and manage sludge age deliberately instead of by habit. Many bulking and carryover problems trace back to drift in these basics.
4. OCEMS hygiene: treat the analyzer like process equipment
Schedule cleaning, calibrate on time, and validate against lab results regularly. Set internal alert thresholds below your regulatory limits so the team gets an early warning, not a notice. A hydraulic surge and shock load in ETP rarely appears out of nowhere. The trend usually starts climbing before the breach.
5. Operations discipline: plan discharge, don’t just react to it
Plan shift-wise discharge, schedule batch dumps and CIP drains so they don’t stack up, and make real-time dashboard review part of the shift routine. When the plant team sees the data before the regulator’s server does, the whole conversation changes.
Note: The values and ranges mentioned here are general indications only. Actual figures differ from one ETP to another based on industry type, process load, design, and operating conditions.
Request a free consultation or ETP performance review from Team One Biotech.
A Quick Self-Check Before the Next OCEMS Compliance Failure
Ask these questions about your own plant:
- Do our grab samples follow a fixed routine that operators can predict?
- Have we compared OCEMS trends against lab results in the last few weeks?
- Is the equalization tank mixed well, and is outflow controlled rather than surge-driven?
- Do our alert thresholds sit below regulatory limits for early warning?
- When was the last time the probe, sample line, and flow cell were cleaned and calibrated?
- Do batch discharges and CIP drains overlap with shift changes?
- Do we see DO, MLSS, and nutrient trends daily, or only when something goes wrong?
- Does the plant team review the live dashboard, or only the lab team?
If you answered “no” or “not sure” to more than a few, you’ve found your starting point.
Frequently Asked Questions
Why does my ETP pass lab tests but fail OCEMS limits?
Lab tests capture a single moment, while OCEMS records the entire day. Peaks from surges, batch discharges, and clarifier carryover appear in continuous data but are easy to miss in a scheduled sample.
Can OCEMS sensor drift cause a false compliance failure?
Yes. Drift, bio-fouling, and poor sample conditioning can push readings away from true values. Regular calibration and correlation checks against lab results help separate sensor error from real excursions.
How can an equalization tank reduce COD and TSS spikes in online monitoring?
It buffers flow and load, so the biological stage receives a steadier feed. With proper mixing and controlled pumping, sudden slugs are diluted and the clarifier is less likely to be overloaded.
Can bioremediation help prevent OCEMS compliance failure?
It can support the biological side by building a more stable, shock-resilient microbial population that recovers faster. It works best alongside good equalization, process control, and OCEMS maintenance.
Conclusion
An OCEMS compliance failure rarely means your team isn’t trying. It usually means the plant behaves differently across the day than a single sample can show. Better equalization, stronger biology, disciplined operations, and a well-kept analyzer close that gap.
Please confirm requirements with your SPCB consent conditions and applicable CPCB directions.
Don’t wait for the next show-cause notice to find out what your OCEMS data has been telling you. Talk to Team One Biotech’s bioremediation experts today, and get your plant reviewed.
Looking to improve your ETP/STP efficiency with the right bioculture?
Talk to our experts at Team One Biotech for customised microbial solutions.
Contact: +91 8855050575
Email: sales@teamonebiotech.com
Visit: www.teamonebiotech.com
Discover More on YouTube – Watch our latest insights & innovations!-
Connect with Us on LinkedIn – Stay updated with expert content & trends!