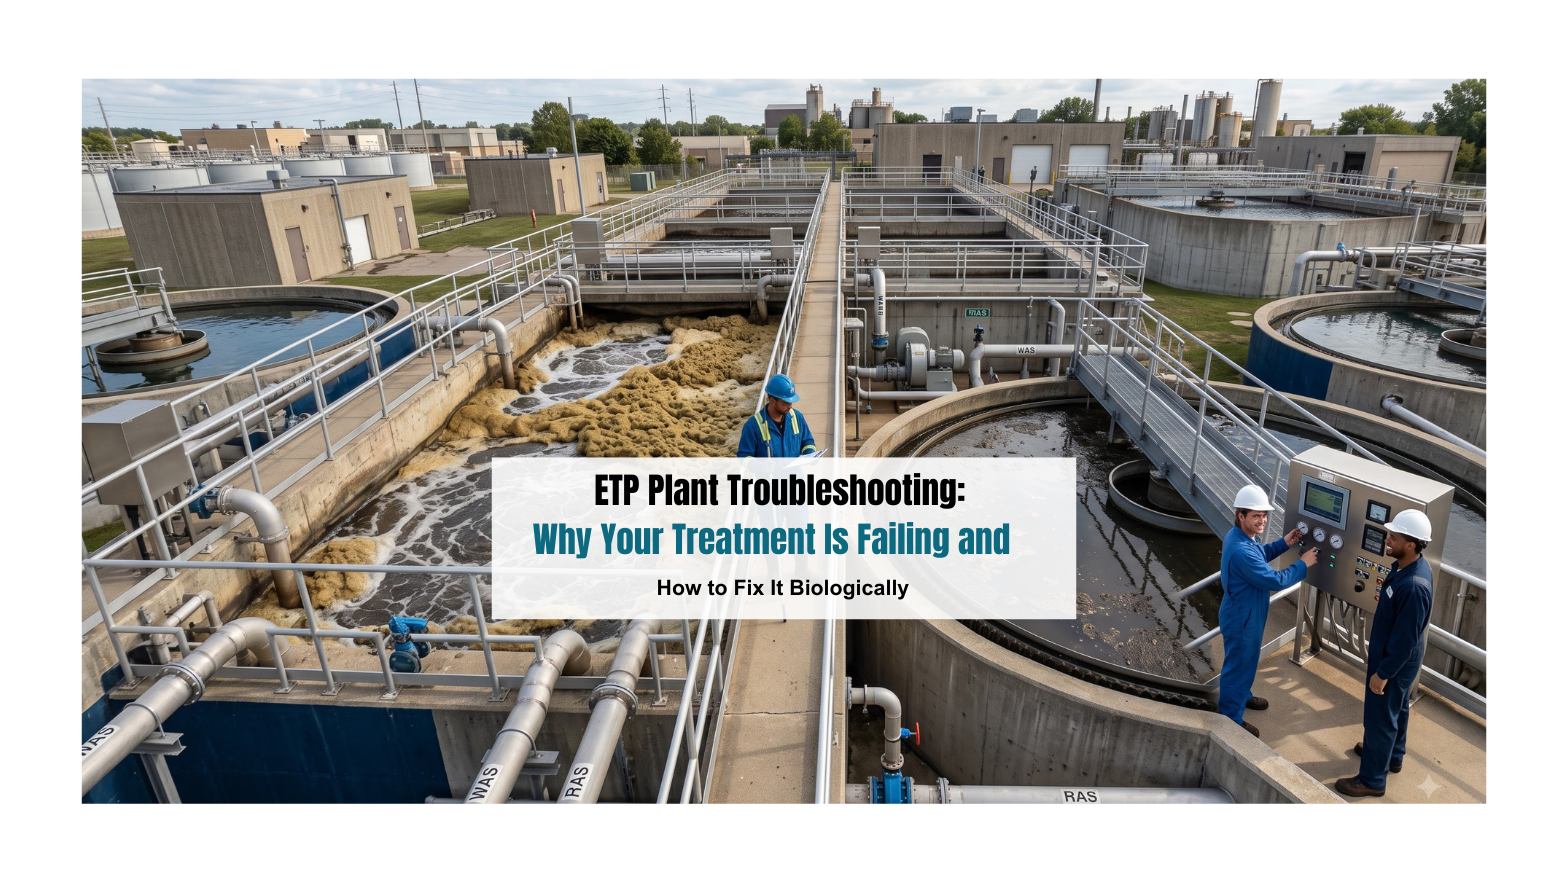
ETP Plant Troubleshooting: Why Your Treatment Is Failing and How to Fix It Biologically

There’s a particular kind of dread that sets in when the lab hands you an outlet report that doesn’t match what your gut was telling you all week. Maybe it’s a COD number that’s crept past your comfort zone for the third day running. Maybe it’s sludge that just won’t settle, no matter how much coagulant you throw at the clarifier. Or maybe it’s worse, an SPCB inspection is already on the calendar, and you’re standing next to an aeration tank at some odd hour trying to figure out what changed.

If any of that sounds familiar, you’re not alone, and you’re not doing anything obviously wrong. Most ETP failures aren’t mysterious once you know where to look. They’re also rarely permanent, provided you’re willing to treat the actual disease instead of dosing your way through the symptoms.

Quick definition for anyone who landed here searching “ETP full form” or “what is ETP”: an effluent treatment plant (ETP) is the system that treats industrial wastewater before it’s discharged or reused, typically combining physical, chemical, and biological stages to bring parameters like BOD, COD, and TSS within regulatory limits. If you’re already running one and it’s misbehaving, you probably don’t need that definition, you need answers. So let’s get into those.

Most ETP breakdowns trace back to a small handful of root causes, and the encouraging part is that most of them can be corrected biologically rather than papered over with another drum of chemical dosing. This piece walks through what failure actually looks like, the three root causes we see most often in the field, and a practical recovery sequence you can start applying this week.

Before we go further, one important note: every range, threshold, or figure mentioned anywhere in this article is a general industry indicator only. Actual acceptable values depend entirely on your plant’s design, influent characteristics, hydraulic load, and the specific CPCB and SPCB norms that apply to your state and industry category. Nothing here should replace your plant’s own baseline data or your consulting engineer’s site-specific recommendations.

What “ETP Failure” Actually Looks Like
What "ETP Failure" Actually Looks Like

Before diagnosing anything, it helps to separate the symptoms from the disease. Operators often chase the symptom, dosing more coagulant, adjusting pH again, running the blower harder, without asking what’s actually breaking down underneath.

The usual suspects show up like this:

  • Rising or erratic COD even though aeration looks completely normal on paper, DO is fine, blowers are running, nothing seems obviously wrong.
  • BOD creeping upward over days or weeks, even while the plant “looks fine” on a walkthrough.
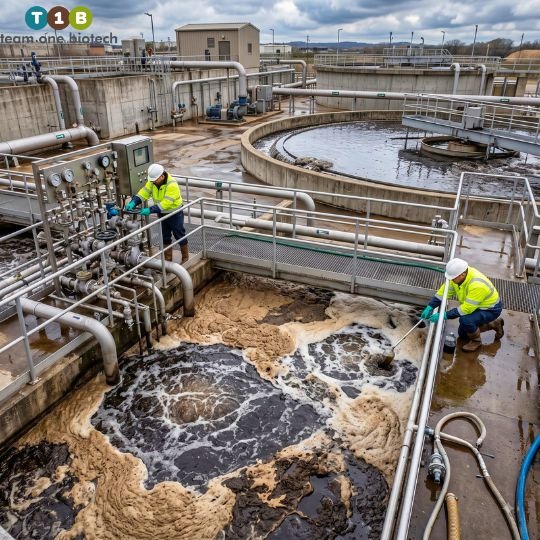
  • Poor sludge settling, bulking sludge, foul odor near the aeration basin, or unexpected foaming on the surface.
  • TSS spikes at the outlet that seem to appear out of nowhere, sometimes only during certain shifts or after certain production batches.

None of these are the actual problem. They’re symptoms of a biological system under stress. Your activated sludge process is, at its core, a living population of microorganisms doing a job, and like any living population, it responds to what you feed it, how much you feed it, and how badly you shock it. Once you start reading these symptoms as biology telling you something, the diagnostic path gets a lot clearer.

The Three Root Causes Behind Most ETP Breakdowns
The Three Root Causes Behind Most ETP Breakdowns

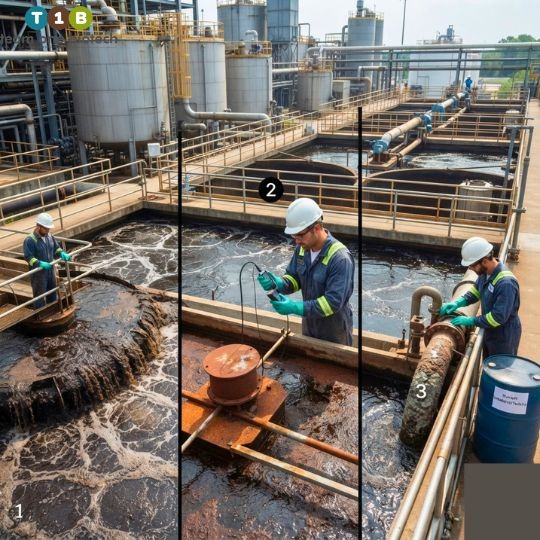
In our experience walking plants back from failure, across textile dyeing units, pharma and API manufacturing, food and beverage facilities, tanneries, and distilleries, nearly every ETP breakdown traces back to one of three root causes, sometimes two working together at once.

Toxic Shock Load

This is the one that scares people, and rightly so. A toxic shock happens when something enters the biological system that the microbial population simply can’t handle, a sudden discharge of disinfectants or cleaning agents, a solvent slug from a batch process, a spike in heavy metals, or an unplanned dump from production that bypasses equalization entirely.

Textile units dealing with dye-bath discharges know this pattern well, and so do pharma and API plants where a solvent recovery miss or an off-spec batch gets routed straight to the ETP instead of being held back.

How it presents is usually unmistakable once you know what you’re looking at: biomass die-off, sludge that goes from healthy brown floc to dark, dead, or sluggish material within hours, and a COD or BOD spike that seems to come from nowhere because the bugs that were supposed to be breaking it down simply aren’t functioning anymore.

The biological fix here isn’t a single dose, it’s a sequence. Reseeding the system with resilient, acclimatized bacterial consortia gives you a microbial population that’s better suited to handle the specific effluent characteristics of your stream. Pairing that with load buffering through equalization tanks means shock loads get diluted and evened out before they ever reach your biology unbuffered. And reintroducing flow in stages, rather than all at once, gives the recovering population room to stabilize instead of getting hit again mid-recovery.

Nutrient Deficiency

This one is quieter and easier to miss because nothing “dramatic” happens, there’s no obvious spill, no foaming crisis, just a slow decline in performance that operators often chalk up to “the plant just isn’t as efficient as it used to be.”

Biology needs a workable balance of organic carbon, nitrogen, and phosphorus to build healthy cell mass and floc structure. Without going into exact ratios, because the right balance genuinely does shift by effluent type and plant design, the short version is that carbon-rich, nutrient-poor streams (distillery effluent and some food and beverage waste streams are classic examples) can starve the microbial population of the nitrogen and phosphorus it needs to grow properly.

The tell-tale signs are weak floc formation that won’t bind together, poor settling in the clarifier even when everything upstream looks chemically normal, and filamentous bulking, those long, thread-like organisms that outcompete the floc-formers when nutrients are out of balance.

The biological fix is targeted nutrient dosing paired with bioaugmentation, so you’re not just adding nitrogen and phosphorus into a system with a depleted microbial population, you’re rebuilding the population itself alongside the nutrient correction. One without the other tends to produce short-lived improvement.

Hydraulic Overload

This is the root cause most likely to get blamed on “the chemistry” when it’s actually a physical problem wearing a chemistry costume. Flow exceeding your plant’s design capacity, whether from a production ramp-up, seasonal demand, or simply more effluent than the ETP was ever sized for, causes short-circuiting through your tanks and cuts your actual retention time well below what your biology needs to do its job.

It presents in a particularly frustrating way: incomplete treatment and TSS carryover at the outlet, even when upstream chemistry, pH, DO, general appearance, looks entirely normal. Operators often spend hours chasing a chemical explanation for a problem that’s fundamentally about time. The water simply isn’t staying in the system long enough for the biology to finish its work.

Fixing this biologically starts with flow equalization and staged loading, so peak flows get smoothed out before they hit your biological reactors. Alongside that, building a more robust and resilient biomass, one that can tolerate variable flow conditions without collapsing every time volumes spike, gives you a system that bends instead of breaking when the next high-flow day arrives.

Why Chemical Fixes Don’t Solve the Real Problem
Why Chemical Fixes Don't Solve the Real Problem

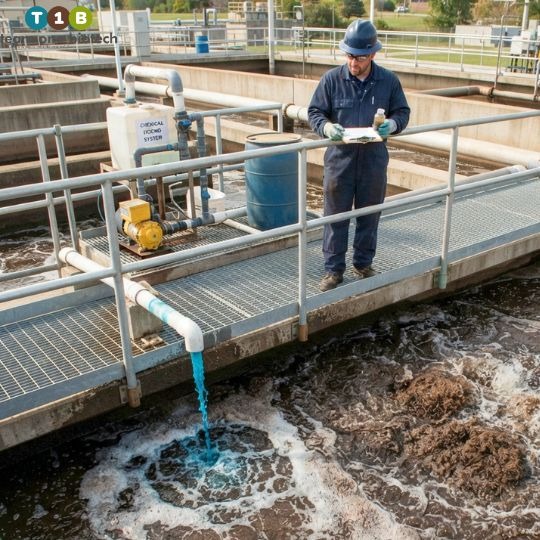
To be clear, chemical treatment has a place. Coagulants, oxidants, and pH correctors are sometimes genuinely necessary, during an active toxic shock, or when you need to hit an outlet number today because an inspection is tomorrow, chemical dosing buys you real, useful time.

But it’s a patch, not a repair. Chemical dosing treats the water sitting in front of you right now. It doesn’t restore the biological population that’s supposed to be breaking down organic load day after day, batch after batch. Once the chemical wears off, or once the next shock load hits, you’re back where you started, because the underlying system that does the actual pollutant breakdown never recovered.

There’s a cost angle here too. Repeated chemical dosing, batch after batch, month after month, tends to be more expensive over the long run than investing in biological recovery once. And critically, it doesn’t build any resilience. A plant running on chemical dosing alone is just as vulnerable to the next shock load as it was before the last one. A plant with a healthy, diverse, acclimatized biological population can absorb some punishment and keep functioning.

Think of it this way: chemistry treats today’s water. Biology treats the system, so tomorrow’s water doesn’t fail too.

A Practical Biological Recovery Plan
A Practical Biological Recovery Plan

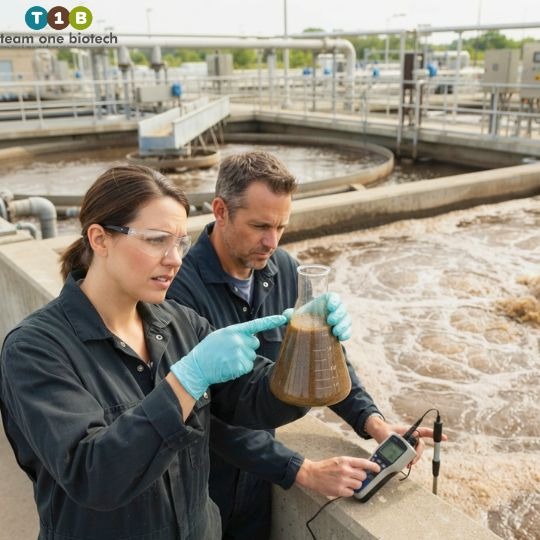
If you’re standing in front of a failing plant right now, here’s the sequence we’d walk through with a client, step by step.

Step 1: Isolate and confirm the root cause. 

Sample upstream and downstream of key process points, and check your DO, pH, and sludge volume index against your plant’s historical baseline, remembering again that acceptable ranges here are general indicators and will differ based on your specific design and effluent type. Don’t skip this step to save time; treating the wrong root cause wastes far more time than diagnosing it properly upfront.

Step 2: Stabilize hydraulics before touching biology. 

If flow equalization isn’t in place or isn’t working, fix that first. There’s little point reseeding a bacterial population into a tank that’s still short-circuiting flow, you’ll just shock it again.

Step 3: Reintroduce or boost the bacterial population with targeted bioaugmentation 

Suited specifically to your effluent type, textile dye-bath residues need a different consortia profile than distillery spent wash or pharma solvent-laden streams. Generic, one-size-fits-all cultures tend to underperform against effluent-specific ones for exactly this reason.

Step 4: Monitor and adjust. 

Biological recovery is not instant, and anyone who tells you otherwise is selling you something. Expect a gradual return to stable BOD, COD, and TSS over days to weeks, not hours. Track trends, not single readings, and be prepared to fine-tune nutrient dosing or bioaugmentation rates as the population re-establishes itself.

Preventing the Next Breakdown

Getting the plant stable again is only half the job. The other half is making sure you’re not back here in three months.

A few habits make the biggest difference:

  • Build a routine monitoring cadence. Daily checks on the basics, DO, sludge appearance, settling behavior, and weekly deeper checks on sludge volume index and effluent trends, catch problems while they’re still small.
  • Watch the early warning signs. Sludge color and texture changes, unusual odor near the aeration basin, and a settling time that’s slowly drifting in the wrong direction are all things biology tells you before the outlet report does.
  • Build real buffer and equalization capacity, so shock loads and flow spikes get absorbed before they ever reach your biological reactors unbuffered.
  • Maintain a resilient, diverse bacterial population rather than relying on a single-strain or minimally maintained system. Diversity in your microbial community is what lets the plant absorb the next unexpected load without collapsing.

None of this is complicated. It’s mostly discipline, the kind that’s easy to let slide when things are running fine and hard to rebuild once they’re not.

Frequently Asked Questions

What is ETP and what does ETP stand for?

ETP stands for effluent treatment plant, a system industrial facilities use to treat wastewater before discharge or reuse, typically combining physical, chemical, and biological treatment stages to meet CPCB and SPCB discharge norms.

What is ETP sludge and why does it stop settling?

ETP sludge is the biomass, the living microbial population, that develops in the biological treatment stage and does the actual work of breaking down organic pollutants. It stops settling well when that population is stressed, typically from toxic shock, nutrient imbalance, or filamentous bulking, and needs biological correction rather than just a coagulant dose to recover.

How can I reduce COD in an ETP plant without over-relying on chemicals?

Sustainable COD reduction generally comes from restoring the biological population’s health, through targeted bioaugmentation, nutrient balancing, and proper hydraulic retention time, rather than from oxidant dosing alone, which addresses the water in the tank today but not the underlying system.

Why does my ETP meet BOD limits but still fail on COD?

This pattern often points to non-biodegradable or slowly biodegradable organic load, common in pharma, textile dye, and certain industrial chemical streams, where standard biological treatment breaks down the readily biodegradable fraction (reflected in BOD) but struggles with the harder-to-degrade fraction that still shows up in COD. It can also point to an under-acclimatized microbial population that needs a more suited bacterial consortia.

How long does biological recovery take after a toxic shock load?

Recovery timelines vary considerably by plant and severity of the shock, but as a general indicator, expect a gradual improvement over days to a few weeks rather than an overnight fix, and remember that actual recovery time depends heavily on your specific plant design, effluent characteristics, and how quickly the root cause was addressed.

Stop Firefighting, Start Fixing the Biology

Most ETP breakdowns come down to one of three things: a toxic shock load hitting your biomass unbuffered, a nutrient imbalance quietly starving your microbial population, or a hydraulic overload cutting your retention time short. Once you know which one you’re dealing with, the fix isn’t mysterious, it’s methodical, and it’s biological.

Chemical dosing has its place, particularly when you need to hit a number before tomorrow’s inspection. But it’s a stopgap, not a solution. The plants that stop cycling through repeated failures are the ones that invest in restoring and protecting their biology, through targeted bioaugmentation, proper equalization, and routine monitoring, so the next shock load doesn’t send them right back to where they started.

The compliance stakes are real. CPCB and SPCB limits aren’t going to loosen, and neither is the pressure that comes with an outlet report that doesn’t pass. But a stable, resilient biological system is what actually keeps you within those limits, not a drum of coagulant you’re refilling every week.

If your ETP is fighting you right now, get a free effluent diagnostic from Team One Biotech’s bioremediation team before your next inspection. Better to know what’s actually broken today than to find out the hard way when the SPCB does.

Looking to improve your ETP/STP efficiency with the right bioculture?
Talk to our experts at Team One Biotech for customised microbial solutions.

Contact+91 8855050575

Email:  sales@teamonebiotech.com

Visit: www.teamonebiotech.com

Discover More on YouTube – Watch our latest insights & innovations!-

Connect with Us on LinkedIn – Stay updated with expert content & trends!
ETP Plant Full Form & Functions: A Guide for "Red Category" Industries
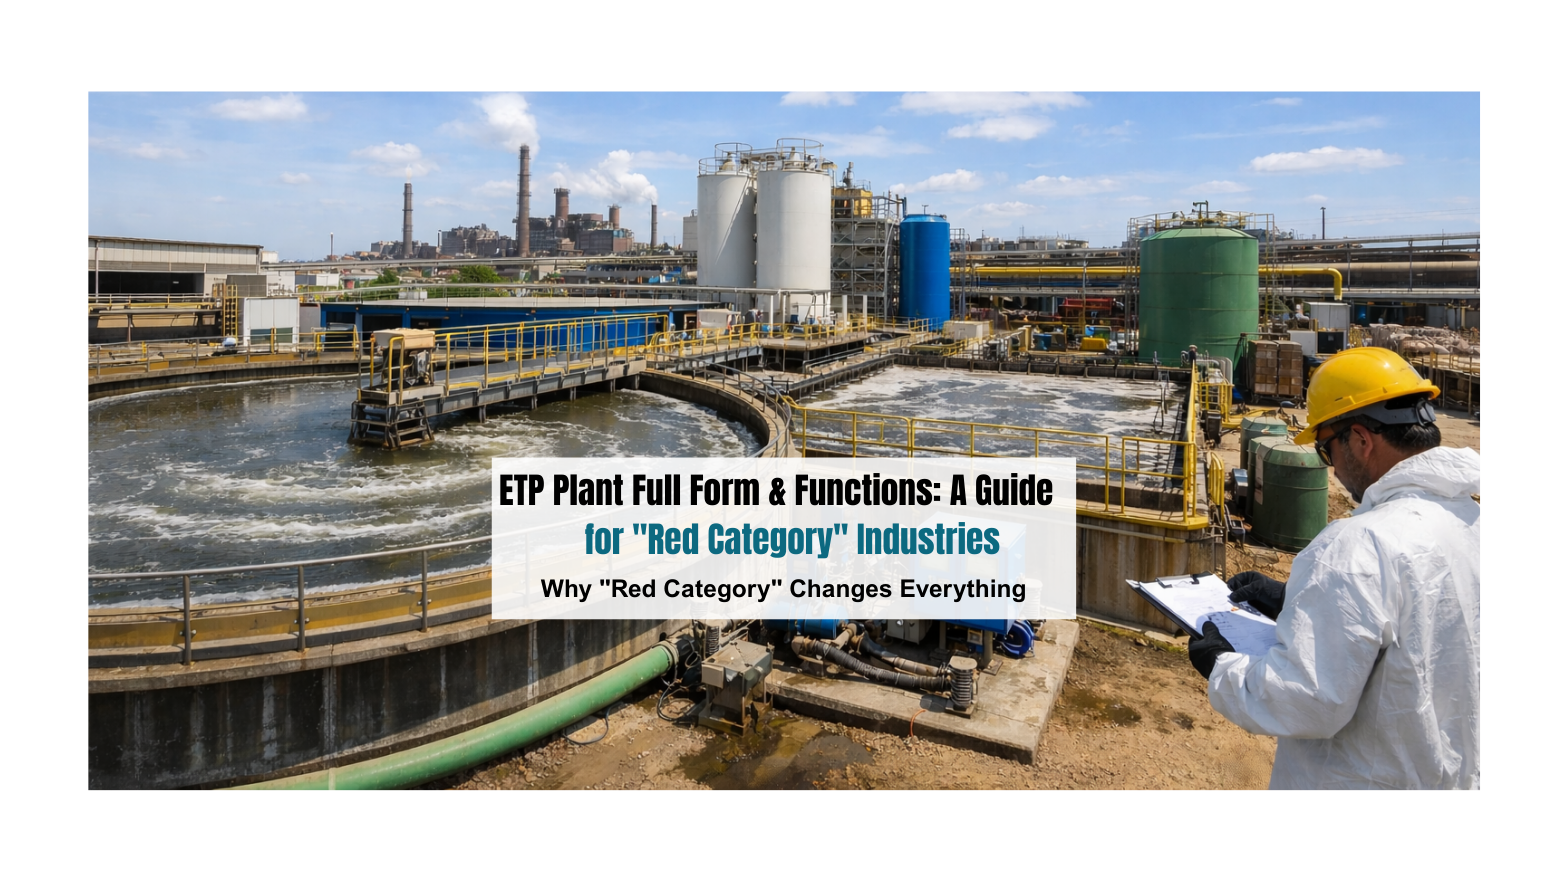
ETP Plant Full Form & Functions: A Guide for “Red Category” Industries

Let’s be direct about something most plant managers already know but rarely say out loud: running a Red Category industry in India right now feels like walking a tightrope over a compliance minefield. One failed effluent test. One surprise inspection from the State Pollution Control Board. One local news story about a nearby river turning colors, and suddenly you’re not just facing a fine. You’re facing a closure notice, a reputational crisis, and the kind of legal liability that follows a business for years.

This isn’t fearmongering. The Central Pollution Control Board (CPCB) has been systematically tightening discharge standards since 2016, and enforcement has become significantly more aggressive in states like Maharashtra, Gujarat, Tamil Nadu, and Uttar Pradesh. The industries feeling this pressure the hardest are exactly the ones doing the heaviest industrial lifting for India’s economy, textiles, dyes, pharmaceuticals, tanneries, paper mills, and chemical manufacturers.

Also Read: The Comprehensive Guide to ETP & STP Design, Process, and Efficiency in India

If you’re in this space, your Effluent Treatment Plant isn’t just infrastructure. It’s survival equipment.

What ETP Stands For, And Why the Full Form Doesn’t Tell the Whole Story

What ETP Stands For, And Why the Full Form Doesn't Tell the Whole Story

ETP stands for Effluent Treatment Plant. The name is simple enough. The reality it represents is anything but.

An effluent treatment plant is a system specifically engineered to treat industrial wastewater, the contaminated water produced during manufacturing processes, before it’s discharged into municipal drains, water bodies, or the ground. Unlike domestic sewage, industrial effluent carries a toxic cocktail of heavy metals, synthetic dyes, suspended solids, oils, acids, and biological oxygen demand (BOD) loads that can devastate aquatic ecosystems within hours of improper discharge.

Here’s what the full form doesn’t tell you: a well-designed ETP is the difference between a factory that runs for decades and one that gets served a closure notice in its tenth year. For Red Category industries, it’s also the single largest variable in your environmental compliance score.

Why “Red Category” Changes Everything

India’s industries are classified into four pollution potential categories by the CPCB, Red, Orange, Green, and White, based on a Pollution Index (PI) score derived from air, water, land, and hazardous waste parameters.

Red Category industries carry a Pollution Index of 60 or above. These include:

  • Textile dyeing and bleaching units
  • Pharmaceutical and bulk drug manufacturers
  • Pesticide and agrochemical plants
  • Tanneries and leather processing units
  • Paper and pulp mills
  • Chemical manufacturers and dye intermediates

What makes Red Category wastewater genuinely difficult to treat is its chemical complexity. You’re not dealing with one pollutant, you’re dealing with hundreds simultaneously. COD (Chemical Oxygen Demand) levels in textile effluent can exceed 3,000 mg/L. Pharmaceutical wastewater often carries recalcitrant organic compounds that resist conventional biological breakdown. Tannery effluent contains chromium concentrations that are acutely toxic to both microbial communities and human health.

Standard treatment approaches frequently fall short here. That’s the core problem Team One Biotech was built to solve.

The Core Functions of an Effluent Treatment Plant

The Core Functions of an Effluent Treatment Plant

A properly functioning ETP works through a staged sequence of treatment processes. Each stage targets a different category of contaminants. Skipping or underperforming at any stage compromises the entire system.

Stage 1: Collection and Equalization

Effluent from different process lines rarely flows at uniform rates or concentrations. The equalization tank buffers this variability, holding incoming wastewater and homogenizing it before treatment begins. This step protects downstream processes from hydraulic shocks and concentration spikes that would otherwise destabilize biological treatment.

Stage 2: Screening and Primary Treatment

Bar screens remove coarse solids. Primary clarifiers allow suspended particles to settle under gravity. The sludge collected here is removed for further processing. This stage significantly reduces suspended solids load before biological treatment begins.

Stage 3: Neutralization

Industrial effluents are frequently highly acidic or alkaline, pH values outside the 6–9 range are common in chemical and pharmaceutical plants. Neutralization brings pH to a range where biological treatment can function effectively. Getting this wrong doesn’t just affect compliance, it kills the microbial communities your secondary treatment depends on.

Stage 4: Coagulation and Flocculation

Chemicals like alum, ferric chloride, or polyelectrolytes are dosed to destabilize colloidal particles and cause them to aggregate into larger flocs that can be physically removed. This step is critical for reducing color, turbidity, and residual suspended solids. However, heavy reliance on synthetic coagulants increases sludge generation and chemical costs, one of the key pain points that bioremediation-based approaches address.

Stage 5: Secondary (Biological) Treatment

This is where the real heavy lifting happens, and where the quality of your approach determines whether you genuinely treat your effluent or merely appear to.

The ETP-STP Plant Process: Where Bioremediation Redefines What’s Possible

The ETP-STP Plant Process: Where Bioremediation Redefines What's Possible

The biological treatment stage of the etp-stp plant process is built around one central mechanism: using microorganisms to break down dissolved organic matter. The most widely deployed method is the activated sludge process.

Understanding the Activated Sludge Process

In the activated sludge process, wastewater enters an aeration tank where it’s mixed with a recirculated mass of microorganisms, the “activated sludge.” Air or oxygen is continuously introduced to support aerobic microbial metabolism. The microorganisms consume dissolved organics (measured as BOD and COD), converting them into carbon dioxide, water, and new cell mass.

The treated water then flows to a secondary clarifier, where the microbial biomass settles out. A portion of this settled sludge is returned to the aeration tank to maintain the active microbial population (return activated sludge). The remainder is wasted (waste activated sludge) for further processing.

In theory, it’s elegant. In practice, for Red Category industries, it frequently underperforms, because generic microbial communities aren’t equipped to handle the specific, often toxic, organic load of pharmaceutical, textile, or chemical wastewater.

Where Traditional Chemical Treatment Falls Short

Many plants default to increasing chemical dosing when biological treatment underperforms. This approach has a ceiling. More coagulants mean more sludge. More sludge means higher disposal costs and stricter hazardous waste compliance requirements. The operational cost curve bends upward fast, and you still don’t consistently hit discharge standards.

How to Retrofit Existing ETPs to meet 2026 Discharge Standards

With the 2026 regulatory shift to Retrofit Existing ETPs, the Central Pollution Control Board (CPCB) and State Boards have moved from “periodic checks” to real-time, performance-based compliance. If your existing ETP was designed for 2016 norms, it likely lacks the precision required for today’s tighter BOD, COD, and nutrient limits.

Retrofitting doesn’t always mean a total teardown. Most Red Category plants can be brought up to 2026 standards through strategic engineering upgrades:

  • Integrating Real-Time Monitoring: 2026 mandates require IoT-connected sensors (RS-485/Modbus) that transmit pH, TSS, and COD data directly to regulatory servers. Retrofitting your outlet with automated monitoring is now the first step in legal “survival.”
  • Upgrading Aeration Efficiency: Many older plants suffer from “dead zones” in aeration tanks. Replacing aging surface aerators with fine-bubble diffused aeration systems can improve oxygen transfer efficiency by up to 30-40%, crucial for handling the higher organic loads seen in pharmaceutical and textile sectors.
  • Adding Tertiary Polishing Units: To meet the new “Mandatory Treated Water Reuse” policies, adding a modular Membrane Bio-Reactor (MBR) or Ultrafiltration (UF) stage to your existing secondary clarifier output can turn discharge-grade water into process-grade water.

By focusing on process correction rather than just equipment replacement, industries can achieve 2026 compliance with minimal downtime and significantly lower capital expenditure.

How Team One Biotech’s Bioremediation Approach Changes the Equation

Team One Biotech’s bioremediation solutions are engineered around specific microbial consortia, selected and cultivated strains of bacteria, fungi, and enzyme-producing organisms that are matched to the actual contaminant profile of your effluent.

Rather than a generic activated sludge population struggling against recalcitrant dyes or pharmaceutical intermediates, you’re deploying organisms that have been specifically developed to metabolize those compounds. The results are measurable:

  • Faster COD/BOD reduction rates compared to conventional activated sludge alone
  • Significantly lower chemical consumption across coagulation and disinfection stages
  • Reduced sludge generation, which directly reduces your hazardous waste disposal burden
  • More stable biological performance during hydraulic and organic load fluctuations
  • Longer intervals between system interventions

This isn’t an additive that temporarily masks compliance numbers. It’s a fundamental upgrade to the biological core of your treatment process.

Ready to see what a bioremediation-optimized ETP looks like for your specific industrial category? Contact Team One Biotech’s technical team for a process consultation, no generic proposals, no guesswork.

STP vs. ETP: Why Industrial Facilities Need to Think About Both

STP vs. ETP: Why Industrial Facilities Need to Think About Both

A sewage treatment plant (STP) is designed to treat domestic wastewater, the water generated from toilets, canteens, washrooms, and general facility use. An effluent treatment plant handles process wastewater from manufacturing operations. They treat fundamentally different waste streams, and mixing them without proper management creates compliance complications.

Here’s why this matters for large industrial facilities:

ParameterSewage Treatment Plant (STP)Effluent Treatment Plant (ETP)
Wastewater SourceDomestic/sanitary useIndustrial process water
Primary ContaminantsBOD, pathogens, nutrientsCOD, heavy metals, dyes, chemicals
Regulatory StandardIS:2490, domestic normsCPCB category-specific norms
Treatment CoreBiological (ASP, MBR)Multi-stage chemical + biological
Sludge ClassificationGeneral wasteOften hazardous waste

Many large manufacturing campuses in India, particularly in pharmaceutical and textile clusters, now operate combined STP-ETP systems or segregated parallel systems. The etp-stp plant process integration requires careful hydraulic design to ensure that the toxicity of process effluent doesn’t overwhelm the biological system designed for domestic sewage.

Team One Biotech’s expertise spans both systems. Whether you’re managing a standalone ETP, a standalone STP, or a combined treatment facility, the bioremediation strategy must be designed around the actual influent chemistry, not generic assumptions.

The Indian Regulatory Reality You Can’t Ignore

The CPCB’s General Standards for Discharge of Environmental Pollutants (under the Environment Protection Act, 1986) set baseline discharge standards. But State Pollution Control Boards frequently impose standards that are stricter than CPCB minimums, and this varies significantly by state, industry cluster, and proximity to sensitive water bodies.

Industries in the Ganga basin face mandatory Zero Liquid Discharge (ZLD) compliance under the National Mission for Clean Ganga. Textile clusters in Surat, Ludhiana, and Tirupur operate under cluster-specific discharge protocols. Pharmaceutical units near ecologically sensitive zones are increasingly being asked to demonstrate advanced treatment capability beyond standard compliance testing.

This regulatory landscape is not getting simpler. Investment in genuinely effective treatment technology, not minimum-compliance infrastructure, is the only position that offers long-term operational certainty.

India’s water stress context adds an ethical dimension to this that goes beyond compliance. With 18% of the world’s population sharing 4% of its freshwater resources, every liter of adequately treated and recycled industrial water is a direct contribution to a problem that affects communities far beyond your fence line.

What an Underperforming ETP Actually Costs You

The compliance fine is the visible cost. The real cost structure looks like this:

  • Repeated third-party effluent testing to chase passing results
  • Increased chemical consumption without proportional treatment improvement
  • Higher sludge disposal frequency and associated hazardous waste costs
  • Downtime risk from regulatory notices requiring system upgrades
  • Reputational exposure in ESG-sensitive supply chains
  • Management bandwidth spent on regulatory responses instead of operations

A properly designed, bioremediation-enhanced ETP converts most of these costs into a single, predictable operational line. That’s the business case, separate from the environmental one.

Is your current ETP delivering consistent compliance, or are you managing the gap between test days and inspection days? Request a free process audit from Team One Biotech. We’ll map your current system against your discharge obligations and identify exactly where the gaps are.

Looking for specific bioremediation products formulated for your industry category? Explore Team One Biotech’s complete range of microbial consortia and enzyme solutions for textile, pharmaceutical, chemical, and tannery wastewater treatment.

Looking to improve your ETP/STP efficiency with the right bioculture?
Talk to our experts at Team One Biotech for customised microbial solutions.

Contact+91 8855050575

Email:  sales@teamonebiotech.com

Visit: www.teamonebiotech.com

Discover More on YouTube – Watch our latest insights & innovations!-

Connect with Us on LinkedIn – Stay updated with expert content & trends!
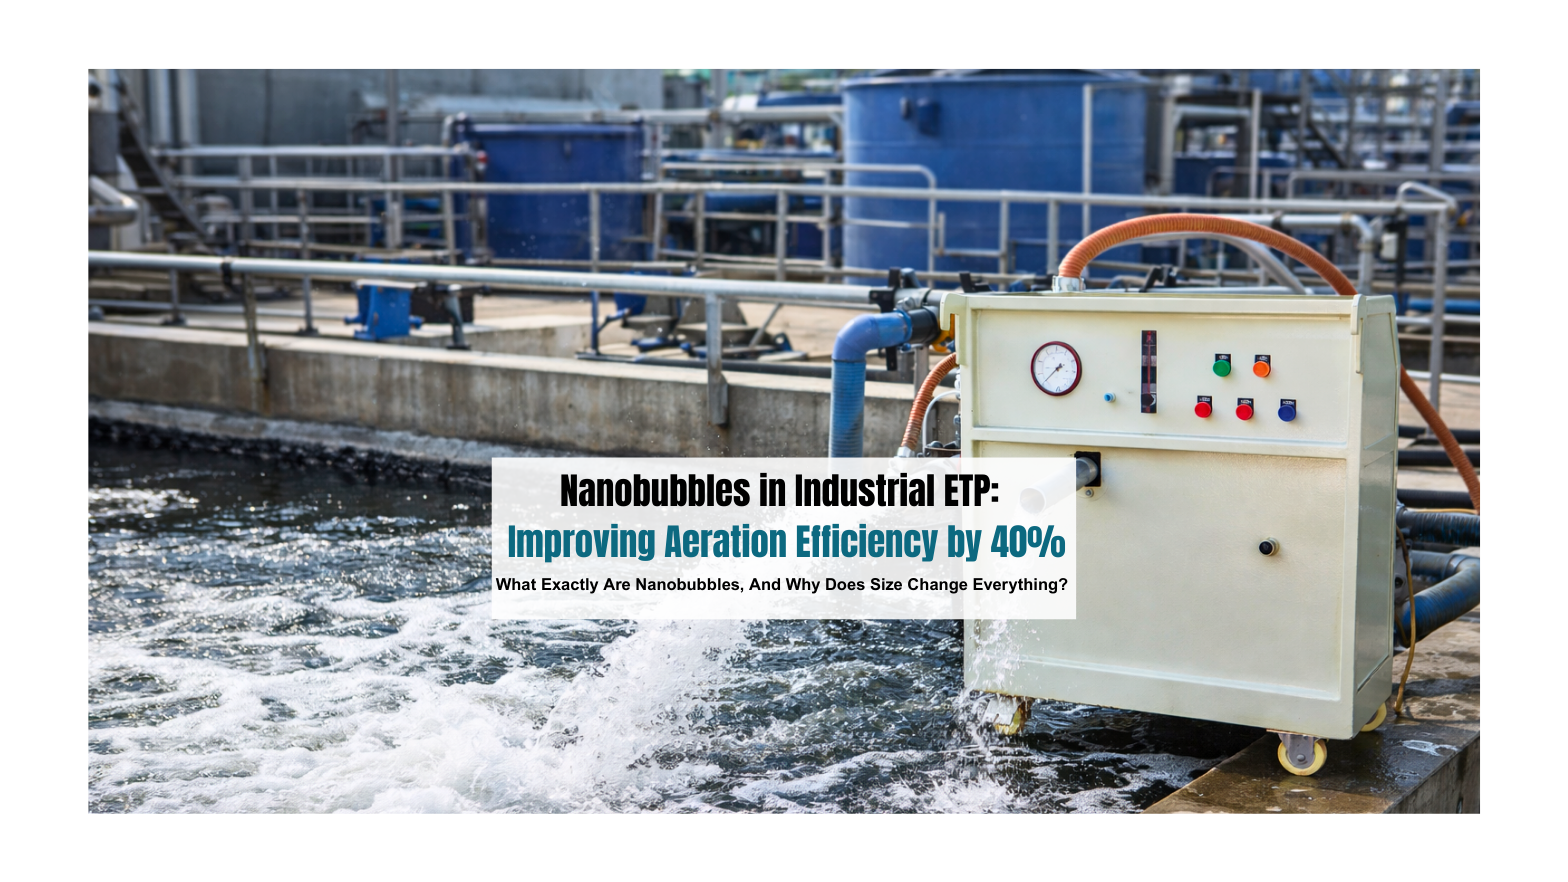
Nanobubbles in Industrial ETP: Improving Aeration Efficiency by 40% 

Water is the UAE’s most politically sensitive resource, and for industrial operators, it is rapidly becoming the most financially dangerous one. The Arabian Peninsula sits atop one of the world’s most water-stressed geographies, and industrial effluent treatment has never carried higher stakes, regulatory, reputational, and economic.

Here is the uncomfortable reality: most industrial Effluent Treatment Plants (ETPs) in Dubai and Abu Dhabi are hemorrhaging operational budgets through one largely overlooked system, aeration. Conventional diffused aeration and surface aerators consume anywhere between 50% to 70% of an ETP’s total energy load. In the UAE’s climate, where ambient temperatures routinely exceed 45°C and reduce dissolved oxygen (DO) saturation to critically low levels in biological treatment tanks, that energy expenditure buys far less oxygen transfer than operators assume.

The result? Biological treatment underperforms. BOD and COD readings breach the thresholds set by Dubai Municipality (DM) Circular 17 and Abu Dhabi Sewerage Services Company (ADSSC) Technical Standards. Penalties follow. Reputational damage follows that.

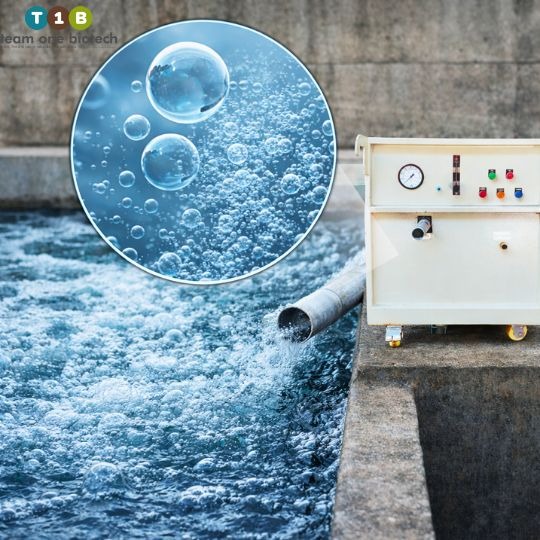
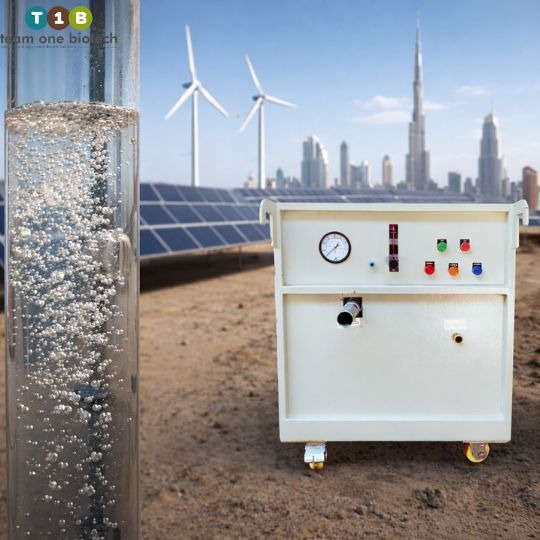
Water Treatment with Nanobubble Generator Technology is the solution every Facility Manager, Sustainability Officer, and plant operator in the Gulf should be looking for; the question is no longer whether their ETP can meet compliance, but whether their aeration strategy is fit for purpose in an environment that actively works against conventional oxygen transfer physics.

What Exactly Are Nanobubbles, And Why Does Size Change Everything?

The physics of bubble-based aeration are straightforward: smaller bubbles mean greater surface area for gas-liquid mass transfer. Conventional coarse-bubble aerators produce bubbles in the 2–5 mm range. Fine-bubble diffusers drop that to 1–3 mm. Both represent incremental improvements on the same fundamental limitation, buoyancy causes bubbles to rise and escape the liquid column rapidly, limiting contact time to fractions of a second.

Nanobubbles (NBs) operate in an entirely different regime.

Nanobubbles are defined as gaseous cavities with diameters below 100 nanometers, roughly 2,500 times smaller than a fine bubble. At this scale, three physical phenomena converge to produce treatment outcomes that conventional aeration simply cannot replicate:

1. Near-Neutral Buoyancy and Extended Residence Time

At sub-100 nm diameters, buoyancy forces are negligible relative to the drag forces exerted by the surrounding liquid. Nanobubbles do not rise and escape, they remain suspended in solution for hours, sometimes days. In a biological aeration basin, this translates directly to prolonged oxygen availability for microbial biomass, even in thermally stratified tanks where DO depletion at depth is a persistent UAE-specific challenge.

2. High Internal Pressure and Accelerated Gas Transfer

Governed by the Young-Laplace equation, the internal pressure of a bubble increases inversely with its radius. A nanobubble at 100 nm diameter carries an internal pressure orders of magnitude higher than a 1 mm fine bubble. This elevated pressure gradient drives oxygen molecules across the gas-liquid interface at significantly accelerated rates, the fundamental mechanism behind the 40% improvement in oxygen transfer efficiency documented in industrial deployments of nanobubble generator UAE systems.

3. Electrostatic Surface Charge and Colloidal Stability

Nanobubbles carry a negative surface charge (zeta potential) that provides electrostatic repulsion between bubbles, preventing coalescence and maintaining population density within the liquid phase. This property also enhances interaction with positively charged suspended solids and biological floc, supporting both biological treatment and physical separation processes.

The 40% Advantage: Breaking Down What This Means for Your ETP’s Bottom Line

When Team One Biotech (T1B) deploys its Nanobubble Generator UAE systems into an industrial ETP, the 40% efficiency improvement is not a marketing figure, it is a measurable, auditable outcome grounded in Standard Oxygen Transfer Rate (SOTR) and Standard Aeration Efficiency (SAE) testing protocols.

Consider what a 40% reduction in aeration energy demand means in practice for a mid-scale industrial ETP in Dubai’s Jebel Ali Industrial Zone processing 500 m³/day of effluent:

  • Baseline aeration energy cost at AED 0.38/kWh: approximately AED 180,000–220,000 annually
  • Post-nanobubble deployment energy savings: AED 72,000–88,000 per year, conservatively
  • Payback period on capital investment: typically 18–30 months depending on plant configuration
  • Reduction in aeration-related CO₂ emissions: directly aligned with UAE Net Zero 2050 decarbonization commitments

Beyond energy, the biological performance gains are equally significant. Elevated and sustained DO levels, maintained at 4–6 mg/L even during peak summer temperatures when conventional systems struggle to hold 2 mg/L, accelerate heterotrophic and nitrifying bacterial activity. In practice, T1B clients document BOD removal efficiencies exceeding 95% in aerobic biological treatment stages, compared to 75–85% with conventional fine-bubble aeration under UAE summer conditions.

This is not marginal optimization. This is the difference between reliable Dubai Municipality Wastewater Compliance and monthly variance reports.

If your ETP has not been benchmarked against nanobubble-enhanced aeration in the last 24 months, you are operating on assumptions that the science has already moved past. Request an efficiency audit from T1B today.

UAE-Specific Challenges That Make Nanobubbles Not Optional, But Necessary

High Salinity Wastewater and Oxygen Transfer Depression

Industrial facilities across Abu Dhabi’s industrial corridors, particularly those involved in produced water handling, brine discharge management, and coastal manufacturing, contend with elevated salinity levels that chemically suppress oxygen transfer coefficients (the alpha and beta factors in aeration design). Saline water holds less dissolved oxygen at saturation, and conventional aeration systems are rarely corrected for this in UAE deployments.

Nanobubble technology exhibits significantly lower sensitivity to salinity-driven oxygen transfer depression due to the pressure-driven transfer mechanism. Where a fine-bubble diffuser may see a 20–30% reduction in effective oxygen transfer in high-TDS produced water streams, T1B’s nanobubble generators maintain transfer rates within 8–12% of freshwater performance benchmarks.

Extreme Temperature and Thermocline Formation

Above 35°C, the oxygen saturation ceiling in water drops precipitously. At 45°C, a realistic surface temperature in an uncovered ETP in July, DO saturation is barely 6.5 mg/L, leaving almost no operational headroom for conventional aerators to maintain the minimum 2 mg/L threshold required by ADSSC Technical Standards for biological treatment performance.

Nanobubble generators integrated with T1B’s bioaugmentation programs (seeding specific microbial consortia adapted to thermophilic UAE conditions) allow biological treatment to remain effective at ambient temperatures where conventional ETPs enter compliance risk.

Sector Deep-Dive: Where Nanobubbles Are Transforming UAE Industry Right Now

Oil and Gas: Produced Water Treatment

Produced water, the largest volume byproduct of hydrocarbon extraction, arrives at treatment facilities loaded with residual hydrocarbons, suspended solids, and often significant hydrogen sulfide. ADNOC onshore facilities and offshore platform operators face escalating scrutiny on produced water discharge quality under UAE environmental frameworks.

T1B’s nanobubble generator UAE systems applied to produced water bioreactors deliver measurable TPH (Total Petroleum Hydrocarbon) degradation improvements by sustaining aerobic conditions in treatment zones that fluctuate violently in organic load. The extended bubble residence time ensures that hydrocarbon-degrading microbial communities are never oxygen-limited during shock loading events, a persistent failure point in conventional produced water ETPs.

Cooling Tower Blowdown: Reducing Chemical Dependence

Industrial cooling towers in Dubai and Abu Dhabi generate blowdown streams that are chemically complex, biologically active, and increasingly regulated under DM Industrial Wastewater Guidelines. Conventional treatment relies heavily on chemical oxidants, which carry their own disposal costs and regulatory footprint.

Nanobubble-enhanced treatment of cooling tower blowdown reduces chemical oxygen demand (COD) through accelerated aerobic biodegradation, and the elevated reactive oxygen species (ROS) generated within collapsing nanobubbles provide a natural biocidal effect that reduces Legionella risk, a growing priority for port authority and hospitality sector facilities in the region.

Aquaculture: Sustainable Water Treatment Meets Food Security

The UAE’s push toward food security under the National Food Security Strategy 2051 has accelerated investment in land-based aquaculture facilities, particularly Recirculating Aquaculture Systems (RAS). Dissolved oxygen management is the single most critical operational parameter in RAS, directly determining fish density, feed conversion ratios, and mortality rates.

T1B’s nanobubble generators installed in RAS oxygenation circuits have demonstrated the ability to maintain DO levels above 8 mg/L in recirculating seawater systems, a benchmark that conventional liquid oxygen injection struggles to achieve economically at scale in the UAE’s climate. The result is higher stocking densities, lower mortality, and a demonstrably more sustainable water treatment footprint.

Meeting Dubai Municipality and ADSSC Standards: T1B as Your Compliance Architecture

Dubai Municipality Circular 17/2016 and ADSSC’s Technical Guidelines on Industrial Effluent set clear discharge quality thresholds: BOD below 20 mg/L, COD below 150 mg/L, TSS below 30 mg/L, and pH within 6–9. For facilities discharging to the sewer network or coastal waters, the compliance burden has never been more rigorously enforced.

T1B’s integrated approach, combining nanobubble generator hardware with precision bioaugmentation using specifically formulated microbial consortia, addresses the root cause of ETP non-compliance: insufficient and inconsistent biological treatment performance. Unlike equipment-only vendors, T1B provides ongoing performance monitoring, microbial health assessments, and process optimization support to ensure that Industrial ETP Efficiency translates into sustained regulatory compliance, not just initial commissioning performance.

Do not wait for a non-compliance notice from Dubai Municipality or ADSSC to initiate your ETP modernization. T1B’s engineering team conducts rapid efficiency audits, contact them before the next inspection cycle.

Aligning with UAE Net Zero 2050: Nanobubbles as a Decarbonization Tool

Aligning with UAE Net Zero 2050: Nanobubbles as a Decarbonization Tool

The UAE’s Net Zero 2050 Strategic Initiative places direct responsibility on industrial operators to reduce Scope 1 and Scope 2 emissions across their operations. Aeration systems, given their energy intensity, are a logical and high-impact decarbonization target.

A 40% reduction in aeration energy consumption across an industrial ETP does not merely save money, it generates verifiable, auditable Scope 2 emission reductions that can be reported against corporate sustainability targets. For organizations pursuing LEED certification, ISO 14001 compliance, or ESG reporting obligations, T1B’s nanobubble deployments provide quantifiable environmental performance data that supports these frameworks directly.

Sustainable Water Treatment is no longer a corporate social responsibility aspiration in the UAE, it is a regulatory and commercial imperative.

Global Accessibility: Source T1B Technology Through the Official Alibaba Store

For procurement teams operating across the UAE and internationally, sourcing advanced nanobubble hardware and microbial formulations through verified, auditable supply chains is a non-negotiable requirement.

Team One Biotech operates a fully verified Official Alibaba Store, providing procurement officers, plant engineers, and international facility managers with direct access to T1B’s complete product range, including nanobubble generator units, replacement components, and proprietary microbial bioaugmentation formulations.

The Alibaba platform provides verified supplier credentials, trade assurance protections, and international shipping logistics support, making T1B’s technology accessible whether your ETP is located in Jebel Ali, the Ruwais Industrial Complex, or internationally across Southeast Asia, South Asia, and Africa.

For UAE-based procurement teams with existing DM or ADSSC vendor approval requirements, T1B’s regional engineering team provides full technical documentation, compliance dossiers, and on-site commissioning support in parallel with Alibaba store procurement.

The platform removes every barrier between your facility’s efficiency gap and the technology that closes it. Visit the T1B Official Alibaba Store today, request a product consultation, and let your procurement team begin the process that your engineering team has already identified as necessary.

One Final Thought for Decision-Makers in Dubai and Abu Dhabi

Every month that an industrial ETP in the UAE runs on conventional aeration is a month of energy cost, biological underperformance, and compliance risk that nanobubble technology could have eliminated. The science is settled. The deployments are documented. The regulatory alignment is direct.

The only remaining variable is whether your organization acts before a non-compliance event, an energy audit, or a competitor’s sustainability report forces the conversation.

T1B’s engineering team is available for rapid ETP efficiency assessments. The audit costs nothing. The delay costs more than you may currently be accounting for.

Looking to improve your ETP/STP efficiency with the right bioculture?
Talk to our experts at Team One Biotech for customised microbial solutions.

Contact+91 8855050575

Email:  sales@teamonebiotech.com

Visit: www.teamonebiotech.com

Discover More on YouTube – Watch our latest insights & innovations!-

Connect with Us on LinkedIn – Stay updated with expert content & trends!
Toxic Shockwaves Travel Through ETPs How to Deal
How Toxic Shockwaves Travel Through ETPs: A Deep Dive into Impact, Zone-Wise Failure, and Recovery

A sudden or abrupt change from regular mechanisms, schedules, habits, or play is detested everywhere, right from living to non-living beings and from nature to industries or the metropolis.  These sudden changes sometimes come with the signs of change that, if identified at the right time, either prevent or make one prepare. But not all thunders come up with lightning.

Here, as we talk about wastewater treatment in ETPs, shock loads remain one of the most common and feared issues.With the onset of shock loads or the sudden introduction of a toxic system with lethal compounds leads to complete disarray in the system, and the whole microbial population gets attacked and damaged and it a tough task to reboot it and get it back to its normal stage.

However, if we know how toxic shockwaves in ETP travel in different systems and what signs the system produces before and during the onset, we can empower us to control this unwanted phenomenon.???? Need expert support in handling or preventing toxic shockwaves in ETP? Contact our team at TeamOne Biotech for consultation, solutions, and support.

Let’s explore the shockwave travel mechanisms, early signs of warning, zone-wise failure and how to recover.

What is Toxic Shock ?

A sudden short-terms ingress of physical or chemical conditions that disrupts routine mechanisms an d disrupts microbial populations.

The Culprits: Common Toxic Agents:

  • Heavy metals (e.g., Cr⁶⁺, Zn²⁺, Cu²⁺): Inhibit enzymes and damage membranes.
  • Phenols and aromatic solvents: Disrupt cell walls, denature proteins.
  • Quaternary ammonium compounds (QACs): Destroy microbial membranes.
  • Strong acids or alkalis: Denature enzymes and destroy extracellular polymeric substances (EPS).
  • High TDS or salts: Cause osmotic shock, dehydration of microbial cells.
  • Temperature spikes: Above 40°C can be lethal to most ETP microbes.

A high COD  is not always directly proportional to toxicity. Even in a batch with COD of 2000 ppm, a 50 ppm phenol will cause disruptions.

How do toxic shockwaves in ETP travel through each zone?

1.Anaerobic Zone:

The anaerobic digestors or UASB reactors break down organics into methane or carbon dioxide by acidogenic and methanogenic bacteria.

The Effect of Toxic Shock:

Methanogens are more prone to shock as they are highly sensitive to pH shifts, metals, and aromatic solvents. A toxic load here may: 

  • Kill methanogens outright, collapsing methane production.
  • Lead to accumulation of VFAs (volatile fatty acids), crashing the pH below 6.5.
  • Result in black sludge, gas bubbles, and floating scum layers.
Indicators:

  • Drop in biogas flow rate (if monitored).
  • pH drop in digester effluent.
  • Sulphide-like odor and gas toxicity.
  • Foaming or bubbling at inlet distribution zones.
Recovery Options :

  • Stop influent flow immediately
  • Neutralize VFAs to bring pH back to 7.2 to 7.6
  • Inoculate with fresh anaerobic bioculture.
  • Feed diluted influent after 3-5 days of stabilization
2.Anoxic Zone: The Invisible Impact Zone

The function of the anoxic zone is highly dependent on nitrifying and denitrifying bacteria. 

The Effect of Toxic Shock:

Denitrifiers are facultative—more robust than methanogens—but still impacted by solvents, surfactants, and metals.

  • Nitrate remains unreduced.
  • Partial reduction leads to nitrite accumulation, which is also toxic.
  • Disruption in redox balance halts nitrogen removal.
Indicators:

  • Rising NO₃⁻ or NO₂⁻ in secondary-treated water.
  • No bubbles or gas generation from the anoxic tank surface.
  • Slight odor of chlorine or nitric oxide due to nitrite oxidation.
  • No apparent foaming or color change—this failure is usually silent.
Recovery Options :

  • Supplement the carbon source ( eg, methanol or acetate ) to restart denitrification.
  • Check and adjust DO and ORP to stay below 0.3 mg/L and -100 to -300 mV, respectively.
  • Restart mixing gently—denitrification is sensitive to turbulence.
3.Aerobic Zone: 

Aerobic microbes (heterotrophs, nitrifiers) oxidize organics and nitrogen, producing CO₂, nitrate, and water.

The effect of Toxic Shock:

It is comparatively easier to identify shocks easily in Aerobic Zones:

  • Increase in soluble COD and turbidity due to Cell lysis.
  • Release of ammonia and phosphates into the water.
  • Poor settling followed by clarifier overflows due to the disintegration of flocs.
  • Pathogen population surge due to collapsed microbial competition.
Indicators:

  • Septic-like: conditions-black, greasy foam with foul smell.
  • A sharp increase in SVI.
  • Filamentous and Nocardia become prominent.
  • Sudden DO depletion even with aeration on.
Recovery:

  • Stop the influent
  • Maintain DO at 3-4 mg/l
  • Slowly start the hydraulic load with 25-30% for the first 5-6 days and then gradually increase.
  • Waste heavily to remove lysed or decayed biomass.
  • Start adding bioculture with robust and shock-tolerant bacteria.
System-Wide Effects Ripple effects:

Secondary Clarifier:

  • Overloaded with dispersed solids → turbid effluent.
  • Sludge blanket floats or rises.
  • Polymer usage increases for sludge settling.
Sludge Dewatering:

  • Decayed biomass becomes non-dewaterable.
  • Centrifuges and belt presses clog easily.
  • Sludge has high moisture content and low calorific value.
Tertiary Treatment:

  • UF/RO membranes foul rapidly with organic colloids.
  • Sand filters choke with fine, dispersed flocs.
  • Chemical dosing (PAC, alum) surges.
Recovery Timeline Framework

PhaseActionTypical Duration
Initial ArrestStop feeding, start aeration, dose buffers0–24 hours
StabilizationAdd bio-culture, monitor parameters1–3 days
Gradual LoadingResume with diluted or treated influent4–7 days
Full RecoveryReturn to design load with full microbial function7–15 days
Conclusion:

AN ETP is like a living ecosystem with uncertainties. If we can find our early warning signs, we can prevent the discrepancies arising due to toxic shock waves in ETP. Although it is a very tough scenario to tackle but if prevented in time, the chances of vulnerability become very less. 

???? Facing recurring issues or need expert intervention? Reach out to TeamOne Biotech — your partners in effective wastewater treatment and process recovery.

???? Email: sales@teamonebiotech.com

???? Visit: www.teamonebiotech.com

???? Discover More on YouTube – Watch our latest insights & innovations!

???? Connect with Us on LinkedIn – Stay updated with expert content & trends!

Seasonal Microbial Shifts Wastewater Treatment
ETP Performance Drift Due to Seasonal Microbial Shifts
Why Weather Matters More Than You Think in Biological Wastewater Treatment

In the evolving field of biological wastewater treatment, the performance of an effluent treatment plant manufacturer-designed system is often expected to be consistent. Yet, seasonal changes bring unseen forces into play—namely, seasonal microbial shifts.

Yes, the weather outside does impact what’s happening inside your biological tank.

From anaerobic wastewater treatment facilities to residential wastewater treatment systems, the health and efficiency of your microbial workforce are key to sustainability. This article dives into how climate-driven microbial dynamics can cause performance drifts—and how proactive strategies can future-proof your system.

???? Contact us to know how your ETP can be adapted for every season using customized biological solutions.

The Invisible Workforce Behind ETPs

The core of any biological treatment system is its microbial community in ETP. These microorganisms are responsible for breaking down organic pollutants, converting ammonia to nitrate, and ensuring compliance with regulatory discharge norms.

But just like any workforce, they too have their comfort zones.

Seasonal Microbial Shifts: More Than Just Temperature

Microbes are sensitive to environmental parameters such as:

  • Temperature: Metabolic rates slow down in colder months, especially for nitrifiers.
  • Dissolved Oxygen (DO): Oxygen solubility increases in winter but may be limited due to reduced blower performance or sludge blanket fluctuations.
  • pH & Nutrient Uptake: Seasonal variations in industrial discharge or rainfall can alter pH and nutrient availability, affecting microbial dynamics.
  • Hydraulic Load: Monsoon seasons often increase flow, diluting influent but stressing retention time and contact efficiency.

These subtle shifts can lead to a noticeable drift in performance—sometimes gradual, sometimes sudden.

Microbial Dynamics in Action

Here’s a simplified breakdown of how microbial populations can change across seasons:

  • Winter: Slow growth of nitrifiers (Nitrosomonas/Nitrobacter) → Ammonia carryover risk. Sludge settling improves due to reduced filamentous growth.
  • Summer: Faster BOD removal but potential filamentous bulking due to low DO at higher temps.
  • Monsoon: Washout of biomass and sudden influx of organics or toxins due to surface runoff or diluted effluent—impacting both MLSS in wastewater and treatment efficiency.
What Your Parameters Are Telling You (Seasonal Indicators)
Parameter Ideal Range Seasonal Variation & What It Indicates
DO (mg/L) 2.0 – 3.5 <2.0 in summer = filamentous growth; >4.0 in winter with low activity = underperforming bugs
MLSS (mg/L) 2500 – 4000 Monsoon may dilute or wash out biomass, dropping MLSS suddenly
SVI (mL/g) 80 – 120 >150 in summer suggests bulking; <70 in winter may indicate compact sludge
F/M Ratio 0.2 – 0.4 Low in winter due to slow bug activity; high post-monsoon due to fresh organic load
Ammonia (mg/L) <5 (in outlet) Elevated in winter due to slow nitrification; low in summer if nitrifiers are active
pH 6.8 – 7.5 Rainfall or industrial shifts can push pH outside this range, affecting bug health

By tracking these parameters monthly or weekly, early warnings of microbial stress can be detected and acted upon proactively.

What Can Be Done?
  1. Seasonal Bioaugmentation
    Introducing robust microbial cultures tailored for low-temp or high-load conditions can bridge seasonal performance gaps.
  2. Data-Driven Monitoring
    Trends in DO, SVI, ammonia, and MLSS can forecast seasonal drifts before they become problematic.
  3. Adjust Operating Parameters
    Fine-tune aeration, sludge wasting, or HRT based on seasonal projections for improved biological nutrient removal.
  4. Preventive Culture Dosing
    Pre-dosing before seasonal change (e.g., winter onset or monsoon) can prepare the system for upcoming stress.
Final Thought

Weather is inevitable, but ETP failures are not. Understanding and anticipating microbial behavior shifts with seasons can be the difference between compliance and chaos.

Let’s stop blaming the bugs—and start working with them.

Have you observed microbial shift or performance drift in your ETP system? Let’s connect and explore how tailored microbial strategies can make your system season-proof.

???? Email: sales@teamonebiotech.com

???? Visit: www.teamonebiotech.com

???? Discover More on YouTube – Watch our latest insights & innovations!-

???? Connect with Us on LinkedIn – Stay updated with expert content & trends!

Microbial-Ecology-of-Wastewater-Treatment-facility
Bacteria and Micro-organisms Involved in Wastewater Treatment

Wastewater treatment is a complex water treatment process that relies heavily on the activity of microorganisms, especially bacteria, to break down pollutants and organic matter. These microscopic allies are the unsung heroes in both municipal and industrial waste effluent treatment plants (ETPs), working silently to purify water and ensure environmental sustainability.Whether it’s reducing fat oil and grease (FOG) buildup or breaking down organic contaminants, micro organisms in wastewater treatment is central to successful alternative.

To learn how your facility can optimize treatment with microbial solutions, feel free to contact us.

Why Microorganisms Matter in Water Treatment

Microorganisms are at the core of biological wastewater treatment, particularly in the secondary sewage water treatment stage. Their role is to:

  • Decompose organic matter into simpler, harmless compounds.
  • Convert nitrogenous compounds through nitrification and denitrification.
  • Flocculate suspended solids by forming biofilms and flocs.
  • Reduce odors and toxic substances through biochemical oxidation, contributing to odour control in wastewater treatment.
  • Shock Loads sustainability.

Let’s dive into the key categories and types of micro organisms in wastewater treatment.

  1. Bacteria – The Backbone of Wastewater Treatment
        a) Heterotrophic Bacteria
  • Function: Degrade organic carbon compounds like proteins, carbohydrates, and fats.
  • Examples: Pseudomonas, Bacillus, Zooglea ramigera
  • Process: Aerobic decomposition (oxidation of organics into CO₂ and H₂O). These bacteria are crucial for fat oil and grease removal in both domestic and industrial effluent streams.

They are frequently supported by bio culture for wastewater treatment solutions, used to maintain consistent microbial balance in residential wastewater treatment systems and eco sewage treatment plant units.

        b) Nitrifying Bacteria
  • Function: Convert ammonia (NH₃) into nitrate (NO₃⁻) in a two-step process.
    • Ammonia to Nitrite: Nitrosomonas
    • Nitrite to Nitrate: Nitrobacter
  • Importance: Removes toxic ammonia, stabilizes nitrogen cycle, and supports wastewater recycling initiatives like sewage recycling system setups.
        c) Denitrifying Bacteria
  • Function: Convert nitrate into nitrogen gas (N₂) under anoxic conditions.
  • Examples: Paracoccus, Pseudomonas denitrificans
  • Role: Helps in total nitrogen removal and reduces eutrophication risks.This process is a key component of anaerobic wastewater treatment and anaerobic digestion wastewater treatment systems.
        d) Phosphorus-Accumulating Organisms (PAOs)
  • Function: Uptake and store excess phosphorus.
  • Examples: Acinetobacter species
  • Use: Enhanced Biological Phosphorus Removal (EBPR) systems. Also useful in managing nutrient-rich industrial waste discharge through biological sewage treatment plant strategies.
  1. Other Important Micro-organisms
        a) Protozoa
  • Role: Predators that consume free-floating bacteria and suspended solids.
  • Types:
    • Flagellates – early indicators of system startup.
    • Ciliates (e.g., Vorticella) – associated with mature, stable systems.
    • Amoebae – dominate during toxic shock or startup.

      These are particularly active in aerobic sewage treatment system setups.

        b) Rotifers
  • Role: Help polish effluent by consuming smaller microbes and particulates.
  • Indicator of: Stable and well-oxygenated systems, particularly in advanced aerobic treatment units.
        c) Fungi
  • Function: Degrade hard-to-digest substances (e.g., lignin, cellulose).
  • Usage: In low pH or low-nutrient conditions, ideal for treating FOG and supporting wastewater treatment products such as enzymes for sewage treatment.
  • Example: Trichoderma, Aspergillus

Often employed in fat oil and grease management due to their capacity to decompose complex organics.

        d) Algae
  • Use: In facultative lagoons and tertiary treatment for oxygenation and nutrient removal.
  • Example: Chlorella, Scenedesmus

They play a vital role in pond treatment and systems focused on eco friendly sewage treatment systems.

  1. Microbial Interactions in Treatment Systems
  • Floc formation: Bacteria like Zooglea ramigera excrete extracellular polymeric substances (EPS) that bind flocs a critical part of wastewater filtration.
  • Synergism: Fungi can break down complex molecules, aiding bacteria.
  • Competition: Nitrifiers and heterotrophs may compete for oxygen, especially in high organic loading conditions influencing reducing BOD in wastewater.
  1. Factors Affecting Microbial Activity
  • Temperature: Most microbes thrive between 20–35°C.
  • pH: Neutral range (6.5–8.5) is optimal.
  • Dissolved Oxygen (DO): Essential for aerobic bacteria (ideal >2 mg/L).
  • Toxicity: Heavy metals, chlorinated compounds, and sudden pH shifts can harm microbial populations.
  • F/M ratio (Food to Microorganism ratio): Critical for maintaining sludge quality and sludge management.

Proper balancing ensures cost-effective sewage treatment plant maintenance and performance optimization across domestic waste water treatment systems.

  1. Role of Bioaugmentation

In systems facing high load or startup issues, bioaugmentation with specialized microbial consortia (commercial biocultures) is used to boost treatment performance. These formulations may include:

  • Mixed heterotrophs
  • Specialized oil, grease, or phenol degraders
  • Nitrifiers and PAOs

Bioaugmentation is especially useful for managing FOG accumulation in sewage treatment plants and sludge digestion systems.It’s often deployed by sewage treatment plant manufacturer teams or effluent treatment plant manufacturer experts offering waste water treatment chemicals.

Conclusion

Understanding the micro-organisms in wastewater treatment is key to optimizing performance, preventing upsets, and achieving regulatory compliance. Bacteria and other micro-organisms are nature’s solution to pollution, and when harnessed properly, they can transform even the dirtiest wastewater into reusable water.

Whether you are managing a sewage treatment plant in Mumbai, planning a sewage treatment plant in Pune, or searching for the best septic tank treatment, knowledge of microbial dynamics will guide you to the right solution, from cheap sewage treatment plants to mini sewage treatment plant cost in India.

From sustainability and waste management to treatment of industrial wastewater, the microbial world offers scalable solutions for every system — large or small. As wastewater professionals, staying informed about microbial communities helps us make better decisions, from choosing the right bioculture to troubleshooting treatment inefficiencies in industrial wastewater management.

Microbial populations act as the biological engine of wastewater treatment systems, continuously breaking down organic matter and converting harmful pollutants into less harmful compounds. Their performance directly influences critical parameters such as BOD, COD, ammonia, nitrate, and sludge production. A healthy microbial ecosystem can improve treatment efficiency, reduce operational costs, and enhance the overall reliability of the treatment process. Regular monitoring of microbial activity can also provide early warning signs of system stress, toxicity, or nutrient imbalances.

With increasing environmental regulations and water reuse requirements, biological treatment technologies are becoming more important than ever. Advanced microbial solutions and bioaugmentation programs can help facilities achieve consistent compliance even under challenging operating conditions. By understanding how different microbial groups interact within the treatment process, operators can optimize aeration, nutrient dosing, and sludge management strategies. Ultimately, investing in microbial health is one of the most cost-effective ways to improve long-term wastewater treatment performance and environmental sustainability.

For tailored solutions to your treatment challenges, contact us.

Email: sales@teamonebiotech.com

Visit: www.teamonebiotech.com

Discover More on YouTube – Watch our latest insights & innovations!-

Connect with Us on LinkedIn – Stay updated with expert content & trends!
Scan the code