The ‘Lag Phase’ Dilemma: Why Fresh Bioculture Doesn’t Work Instantly
In the world of biological treatment of wastewater, a common misconception persists: adding fresh bioculture for wastewater treatment guarantees instant results. Many operators expect immediate improvements in COD/BOD reduction or ammonia removal after dosing microbial culture into an underperforming ETP. But when visible results aren’t observed within a day or two, the bioculture for wastewater is often blamed for being ineffective.
Let’s decode this expectation mismatch, delve into a critical microbial phenomenon – the Lag Phase, and understand why even the best pure microbial culture doesn’t deliver overnight miracles. This is backed by operational realities and biological data that matter.???? Contact us to learn how to optimize your microbial culture application.
Understanding the Microbial Growth Curve
Microorganisms, like all living systems, go through distinct phases of growth when introduced into a new environment:
- Lag Phase
- Log (Exponential) Phase
- Stationary Phase
- Decline (Death) Phase
The Lag Phase is the initial stage where no visible growth or activity is observed. However, this doesn’t mean microbes are inactive. During this phase:
- Microbes adapt to the new environment.
- Enzymatic systems are adjusted.
- Gene expression is modified.
- Cells are gearing up for division, not actively dividing yet.
Why Does the Lag Phase Happen in ETPs?
When fresh bioculture is introduced into the aeration tank or bioreactor, several factors contribute to the length and intensity of the lag phase:
-
Nutrient Profile Mismatch
Fresh microbes are often grown in optimized lab or fermenter media. When transferred to wastewater:
- Nutrients may be imbalanced (e.g., low nitrogen or phosphorus).
- Some carbon sources may be toxic or inhibitory (e.g., phenols, surfactants).
- BOD:N:P ratio may be non-ideal (target is typically 100:5:1).
Example: If influent COD is 1000 mg/L and TKN is 5 mg/L → BOD: N ratio = 200:1 (far from ideal). This stresses fresh microbes, prolonging the lag phase.
This is why bioculture for removing ammoniacal nitrogen from effluent must be paired with proper nutrient profiling.
-
Temperature and pH Shocks
Most bioculture strains are cultivated at optimal temperatures (25–35°C) and pH (6.8–7.5). When added to a field ETP:
- Temperature fluctuations (e.g., influent temp of 18°C in winter) delay enzyme activation.
- pH shocks (acidic wastewater from dye/textile units) inhibit microbial membrane transport.
Field data:
Fresh bioculture added at 5% v/v. Influent pH = 5.8 → no visible BOD reduction for 3 days. After pH correction to 6.8, activity began within 24 hours.
-
Toxicity from Heavy Metals or Residual Chlorine
Heavy metals like Cr, Zn, and Cu or residual disinfectants like chlorine can denature proteins and kill cells, especially during initial exposure.
- Tolerance limit for Cr = <0.5 mg/L
- Chlorine residuals should be <0.1 mg/L before bio-activation
Example:
In one textile ETP, chlorine carryover from pre-treatment caused 90% loss of viable CFUs in 24 hours. Dechlorination was introduced → lag reduced from 4 days to 1.5 days.
Using anaerobic bioculture suppliers and dechlorination agents can significantly aid this transition.
-
Low Dissolved Oxygen (DO) Levels
Bioculture organisms (especially nitrifiers) are aerobic. During start-up:
- Oxygen demand spikes.
- DO may drop below critical level (<2 mg/L).
- Lag extends as microbes cannot activate oxidative enzymes efficiently.
Tip:
Maintain DO at 3–4 mg/L during startup even if it means temporary over-aeration.
-
Microbial Competition and Protozoan Predation
Fresh microbes must compete with native microbes, and also survive protozoan grazing (e.g., Vorticella, rotifers).
- If sludge age (MLSS age) is >20 days, floc-forming bacteria dominate, and new entrants struggle to establish.
???? How to Monitor the Lag Phase in Real Time
Instead of waiting blindly, operators can use data-driven indicators:
| Parameter | Expected Behavior During Lag | Comment |
|---|---|---|
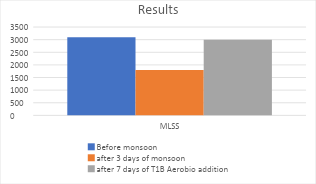
| MLSS | Little to no change | New cells not dividing yet |
| MLVSS/MLSS ratio | Low (<0.65) | High inert fraction initially |
| SOUR (mg O₂/g VSS/hr) | Flat or very low | Microbes not metabolizing |
| COD removal | <10–20% | Bioculture not active yet |
| Microscopic Observation | Small, dispersed cells, few flocs | No protozoa or metazoans yet |
Monitoring distribution of microbes in nature under a microscope can help detect early signs of colonization.
⏳ How Long is the Lag Phase?
The lag phase can last anywhere between:
- 6–24 hours in ideal cases
- 3–5 days in stressed systems
- Up to 7+ days in shock-loaded or toxic wastewater
✅ Strategies to Shorten the Lag Phase
- Condition the System First
- Neutralize pH
- Eliminate residual chlorine
- Adjust BOD:N:P ratio
- Pre-Activate Bioculture
- Incubate with actual wastewater and aerate for 12–24 hours before dosing
- Gradual Acclimatization
- Introduce microbes in stages
- Avoid full load startup
- Supplement DO and Nutrients
- Temporary aeration boost
- Add Urea/DAP if needed
- Use Carriers or Media (optional)
- MBBR or Biofilm carriers provide protection and surface for colonization
Conclusion: Patience Pays
The lag phase isn’t a failure – it’s a biological necessity. It reflects the intelligent adaptability of microbes to their environment. With the right microbial culture methods, proper planning, real-time monitoring, system conditioning, and application this phase can be shortened, and biological performance optimized.
Next time you add a fresh bioculture, don’t just watch the COD meter. Watch the system parameters, the microbes under the microscope, and give them the right conditions and time.
Because in microbiology – nothing works instantly, but everything works eventually.
???? Talk to our experts now to enhance your bioculture performance
To know more:
???? Visit: www.teamonebiotech.com
???? Email: sales@teamonebiotech.com ????: 7769862121
????Watch YouTube for our latest insights & innovations!
????Connect with Us on LinkedIn – Stay updated with expert content & trends!