Biological Wastewater Treatment: Uncovering Dead Zones in Aeration Tanks and Their Impact
Aeration tanks are the heart of biological wastewater treatment. Yet, even in well-run plants, unseen trouble often brews in the quiet corners- dead zones. There are under-mixed, under-related regions where sludge accumulates, oxygen struggles to penetrate, and undesirable microbial growth silently takes over.
In this blog, we explore the causes, consequences, and countermeasures for dead zones—an issue too often overlooked until it begins to cripple performance. Contact us to get a comprehensive strategy to tackle various wastewater treatment issues arising due to dead zones.
What Are Dead Zones?
Dead zones are localized pockets within aeration tanks where:
- Mixing is insufficient
- Dissolved oxygen (DO) levels drop abnormally low
- Sludge settles or accumulates
- Biological activity becomes suboptimal or undesirable.
Think of them as “black holes” in your biological reactor zones where the intended plug-flow or completely mixed flow behaviour is interrupted. Instead of aiding treatment, these zones become hotspots for filamentous bacteria, sludge bulking, septic conditions, or even toxic compound buildup.
The Hidden Causes: Poor Hydraulic and Tank Design
Dead zones are often not caused by process failure, but rather by physical design flaws or hydraulic inefficiencies. Here’s a closer look:
- Suboptimal Tank Geometry
- Corners, Blind spots, or irregular shapes (e.g., square tanks without proper baffle orientation) create areas where flow velocity drops significantly.
- Depth variations can lead to low-velocity pockets at tank bottoms, encouraging sludge accumulation.
2. Improper Diffuser Layout
- Aeration systems that don’t cover the entire tank floor uniformly may leave some regions without adequate oxygen or turbulence.
- Inadequate back pressure balancing between diffusers can create unequal air distributions, especially in older or retrofitted systems.
3. Overloaded Inlets or Wrong Entry Points
- High-velocity influent entering from a single point without directional control can short-circuit across the tank, leaving side areas untouched.
- Multiple inlets without a mixing plan can cause flow imbalances.
4. Mixer Failures or Poor Mixing Strategy
- Absence of mechanical mixers in tanks where air mixing alone isn’t enough can allow MLSS to settle.
- Mixing energy per unit volume (measured in W/m3 ) may fall below the minimum needed for homogeneity.
Why Dead Zones Matter: The Domino Effect
Ignoring dead zones can result in a cascade of problems across your ETP
- Localized Sludge Accumulation
- In these regions, MLSS settles and compacts, especially during low load periods or during blower shutdowns.
- Accumulated sludge may go anaerobic, producing foul odors, sulfides, or toxic intermediates that disturb the biology when re-entrained.
2. Low DO Conditions
- Lack of oxygen allows facultative or anaerobic organisms to dominate. This compromises nitrification, COD removal, and pathogen reduction.
- Ammonia and organic acids can spike downstream.
3. Filamentous Growth
- Type o21N, Thiothrix, and other filamentous bacteria thrive in low DO, Low shear environments.
- This causes sludge bulking, poor settling in the secondary clarifier, and high TSS in treated water.
4. Short-circuiting of Hydraulic Retention Time (HRT)
- The presence of dead zones leads to non-ideal mixing, reducing actual HRT, which directly affects COD/BOD reduction and biomass contact time.
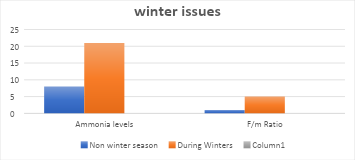
Real-World Red Flags That Indicate Dead Zones
- Uneven MLSS distribution across tank sections during grab sampling
- Sudden drop in DO in specific parts of the tank despite adequate blower output.
- Filamentous bulking despite controlled F/M and good nutrient levels
- Odor generation from aeration zones (not just from sludge handling units)
- Frequent need for desludging or unexpected sludge layer observations
How to Diagnose and Map Dead Zones
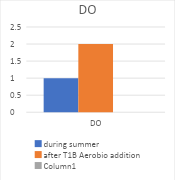
- DO profiling
Perform multi-point dissolved oxygen monitoring using portable probes across the tank length, width, and depth. Dead zones typically register <0.5 mg/L even when others are above 2 mg/L.
2. Tracer Tests
Use salt or dye tracer studies to evaluate hydraulic flow paths and identify stagnant pockets.
3. MLSS Distribution Sampling
Draw sludge samples from different depths and locations. Higher settled solids in specific zones indicate poor mixing.
4. CFD Modelling
Use Computational Fluid Dynamics to simulate flow patterns in tank designs- extremely useful during retrofit planning or new design validation.
Engineering Solutions: Eliminate the Trouble at Its Source
A. Improve Diffuser Coverage
- Ensure uniform grid layout of fine or coarse bubble diffusers.
- For retrofit, use drop-tube aeration or supplemental spot aerators for trouble zones.
B. Add or Reposition Mixers
- Mechanical mixers (submersible or side-entry) can prevent MLSS settlement where airflow alone is inadequate.
- Install in corners or far ends of tanks where air-induced mixing doesn’t reach.
C. Re-evaluate Inlet & Outlet Design
- Use directional baffles or flow splitters to achieve even distribution across tank cross-sectional velocities.
- Consider multi-point inlets instead of single-point discharge, especially in large tanks.
D. Tank Shape Optimization
- In new designs, favor circular or plug-flow channels with controlled cross-sectional velocities.
- Avoid dead-end zones or large side bays that aren’t actively aerated.
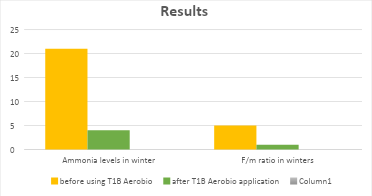
Microbial Recovery After Corrective Action
Once Dead Zones are eliminated or minimized:
- Expect a reduction in filamentous load within 7-10 days.
- DO profile across the tank becomes more uniform, improving nitrification and COD removal.
- Clarifier performance improves due to better sludge settling and compaction.
- Bioculture effectiveness increases as MLSS is more uniformly exposed to substrate and oxygen.
Final Thoughts: Dead Zones Are Silent Killers
Dead zones in aeration tanks are not just hydraulic nuisances — they can stealthily derail your entire biological treatment process. Whether you operate a 100 KLD plant or a 10 MLD facility, regular physical inspections, DO mapping, and hydraulic reviews should be part of your preventive operations strategy.
By addressing these silent trouble spots proactively, you not only stabilize ETP performance but also prolong equipment life, reduce energy wastage, and ensure consistent compliance.
Team One bIotech is one of the top biotech companies in India, addressing multiple issues related to industrial wastewater treatment with its innovative microbial culture solutions. Reach out now to enhance your wastewater treatment efficiency.
Email: sales@teamonebiotech.com
Visit: www.teamonebiotech.com
Discover More on YouTube – Watch our latest insights & innovations!-
Connect with Us on LinkedIn – Stay updated with expert content & trends!