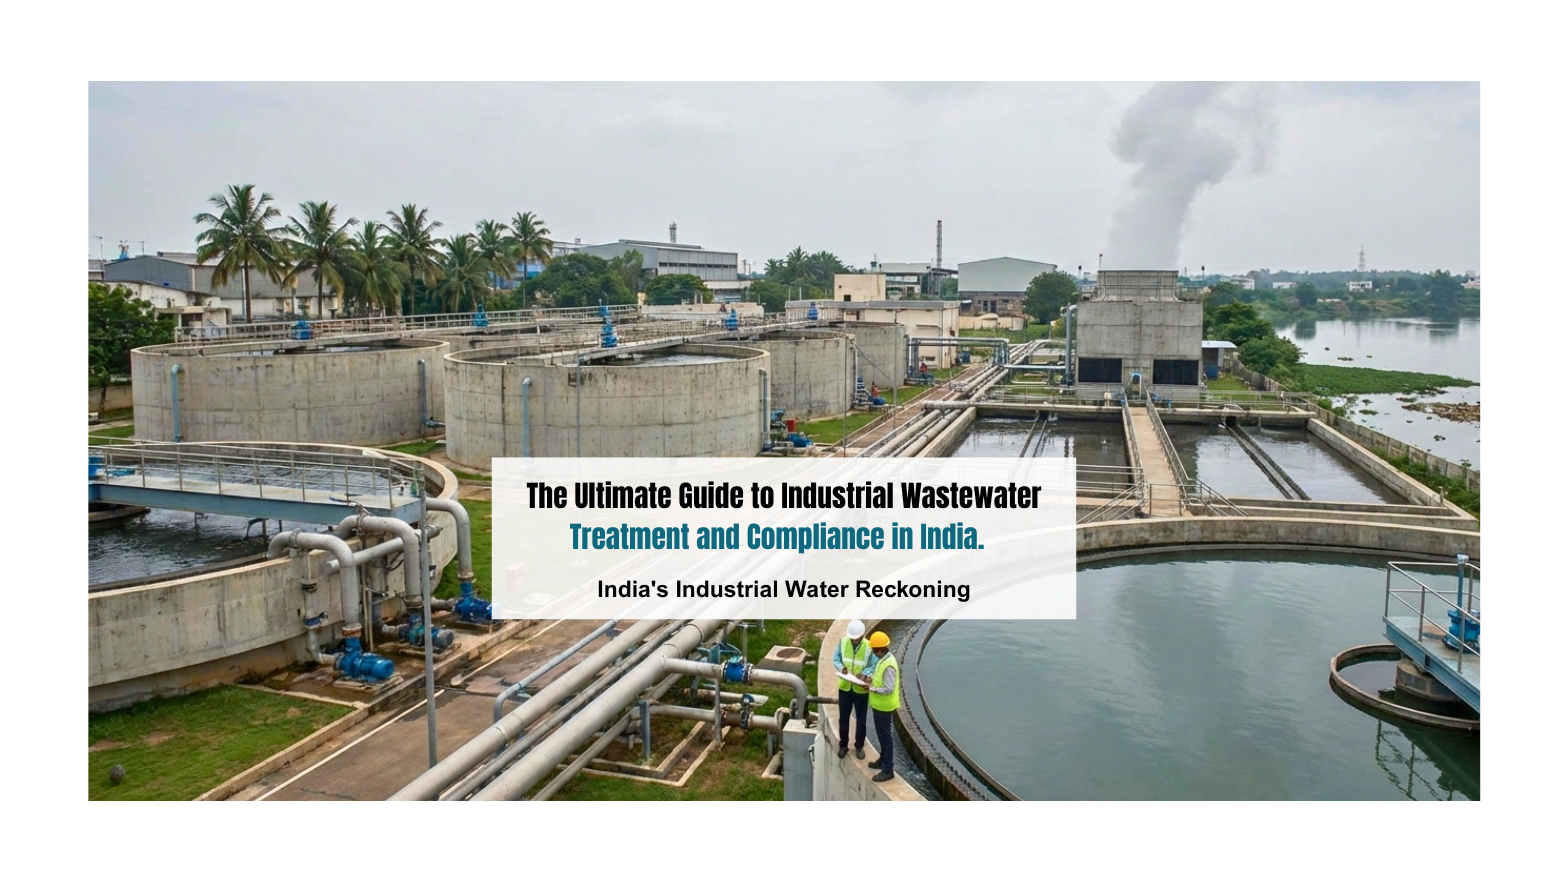
The Ultimate Guide to Industrial Wastewater Treatment and Compliance in India.
When the Tap Runs Dry: India’s Industrial Water Reckoning
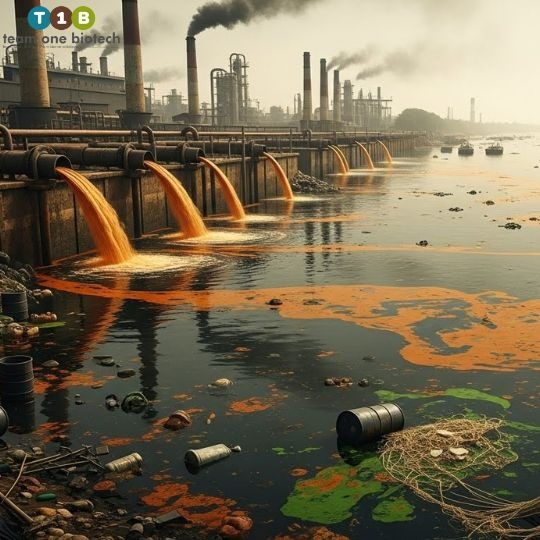
Imagine It’s 2026, and the Noyyal River in Tamil Nadu, once the lifeline of Tirupur’s textile industry, has been declared biologically dead for the third consecutive year. The Central Pollution Control Board has shut down 47 dyeing units in a single month. A Plant Manager in Surat receives a notice: achieve zero liquid discharge within 90 days or face permanent closure.
This isn’t a dystopian future. This is the reality unfolding across India’s industrial corridors today.
Every year, Indian industries discharge approximately 13,468 million liters of wastewater daily, with only 60% receiving adequate treatment. The NITI Aayog has warned that 21 major cities, including Delhi, Bengaluru, and Hyderabad, will run out of groundwater by 2030. For industrial leaders, the question is no longer “Can we afford to treat wastewater?” but rather “Can we afford not to?”. In this guide, you will understand Why Bioremediation & Biocultures In Wastewater Treatment and Compliance in India is a must.
This guide exists for the Plant Manager who lies awake worrying about the next SPCB inspection, the CEO balancing profit margins with planetary responsibility, and the Environmental Officer seeking solutions that actually work in Indian conditions. Because wastewater treatment is not merely a compliance checkbox, it is the legacy we leave for our children, the difference between sustainable growth and environmental bankruptcy.
India’s Industrial Wastewater Crisis
The Scale of the Challenge
India’s industrial growth story is also a water consumption story. The textile industry alone consumes 1,600 billion liters annually, with Tirupur’s 600 dyeing units generating 100 million liters of effluent daily. The pharmaceutical clusters in Hyderabad release complex chemical compounds that conventional treatment plants struggle to neutralize. Sugar mills in Uttar Pradesh operate seasonally, creating treatment challenges that demand adaptive solutions.
The problem compounds when we consider the diversity of Indian industries: automotive manufacturing in Chennai, leather tanning in Kanpur, food processing in Punjab, and chemical manufacturing across Gujarat. Each sector produces unique pollutants requiring specialized treatment approaches, yet many facilities still rely on decades-old chemical treatment methods designed for Western industrial conditions.
The Regulatory Landscape: Beyond Compliance to Survival
The regulatory framework governing industrial wastewater in India has undergone seismic shifts. The National Green Tribunal now possesses the authority to impose penalties reaching up to Rs. 25 crore for severe violations. State Pollution Control Boards have become increasingly vigilant, conducting surprise inspections and mandating real-time effluent monitoring systems.
Key regulatory bodies shaping compliance in 2026:
- Central Pollution Control Board (CPCB): Sets national discharge standards and monitors state-level implementation
- State Pollution Control Boards (SPCBs): Enforce regulations, issue consents, and conduct facility inspections
- National Green Tribunal (NGT): Adjudicates environmental disputes with binding authority
- Ministry of Environment, Forest and Climate Change: Formulates national policy frameworks
The shift from periodic testing to continuous online monitoring represents a fundamental change. Industries in critically polluted areas, classified as such by CPCB, face zero liquid discharge mandates, requiring complete water recycling with no external discharge.
The 2026 CPCB Compliance Checklist: Your Non-Negotiable Standards
This definitive checklist represents the minimum requirements for industrial effluent discharge in 2026. Non-compliance results in consent withdrawal, production shutdowns, and potential criminal proceedings under the Water (Prevention and Control of Pollution) Act, 1974.
General Discharge Standards (Into Public Sewers/Surface Water)
Critical Parameters:
- pH Level: 5.5 to 9.0 (strict enforcement, acidic or alkaline discharge results in immediate notices)
- Biochemical Oxygen Demand (BOD): Maximum 30 mg/L for discharge into surface water; 350 mg/L for sewers
- Chemical Oxygen Demand (COD): Maximum 250 mg/L for surface water; not exceeding 3 times BOD value
- Total Suspended Solids (TSS): Maximum 100 mg/L for surface water; 600 mg/L for sewers
- Total Dissolved Solids (TDS): Maximum 2,100 mg/L (critical for textile and chemical industries)
- Oil and Grease: Maximum 10 mg/L for surface water; 20 mg/L for sewers
- Ammoniacal Nitrogen: Maximum 50 mg/L
- Total Kjeldahl Nitrogen: Maximum 100 mg/L
Industry-Specific Standards
Textile Industry (Dyeing and Printing Units):
- Color: Maximum 1 unit on ADMI scale after dilution
- Chlorides: Maximum 1,000 mg/L
- Sulphides: Maximum 2 mg/L
- Phenolic compounds: Maximum 1 mg/L
Pharmaceutical Manufacturing:
- Antibiotics: Not detectable in discharge
- Heavy metals (Combined): Maximum 2 mg/L
- Specific limits for copper, zinc, chromium, and nickel
Food Processing and Beverage Industries:
- BOD: Maximum 30 mg/L (stringent due to organic load)
- Residual chlorine: Maximum 1 mg/L
Leather Tanning:
- Total chromium: Maximum 2 mg/L
- Sulphides: Maximum 2 mg/L
- TDS: Maximum 2,100 mg/L (critical parameter)
Monitoring and Documentation Requirements
- Continuous Online Monitoring Systems: Mandatory for industries in red and orange categories
- Monthly Testing: All critical parameters must be tested by NABL-accredited laboratories
- Record Maintenance: Minimum 5-year retention of all test reports, consent documents, and operational logs
- Annual Environmental Statement: Submission to SPCB by May 30th each year
Natural Solutions for COD and BOD Reduction
The Science Behind Bioremediation
Traditional wastewater treatment relies heavily on chemical coagulants like alum, ferric chloride, and lime to precipitate pollutants. While effective at removing suspended solids, these methods create massive volumes of toxic sludge and fail to address dissolved organic compounds that drive COD and BOD levels.
Biological treatment represents a paradigm shift. Specialized microbial cultures, carefully selected strains of bacteria that naturally occur in soil and water, consume organic pollutants as their food source. This isn’t genetic engineering; it’s nature optimized for industrial conditions.
How Specialized Microbial Cultures Break Down Complex Organics
In textile effluents, the challenge is formidable: synthetic dyes contain azo bonds, aromatic rings, and complex hydrocarbon chains that resist conventional breakdown. Here’s how targeted bioremediation works:
Stage One: Enzymatic Attack Specialized bacteria produce extracellular enzymes, azoreductases, laccases, and peroxidases, that cleave the molecular bonds of dye compounds. The azo bond (-N=N-), which gives dyes their color stability, becomes the bacteria’s primary target. These enzymes break complex molecules into simpler intermediate compounds.
Stage Two: Metabolic Conversion The bacterial cultures metabolize these intermediate compounds through their cellular respiration processes. What was once a toxic dye molecule becomes carbon dioxide, water, and new bacterial biomass. This is true mineralization, complete conversion of pollutants into harmless end products.
Stage Three: Consortium Synergy No single bacterial species can handle the diversity of compounds in industrial wastewater. Team One Biotech’s formulations contain carefully balanced consortiums where different species specialize in different compound classes. While Pseudomonas species excel at aromatic compound breakdown, Bacillus strains handle lipids and proteins. Nitrosomonas bacteria convert ammonia to nitrates, addressing nitrogen parameters.
The Technical Advantage: Why Biology Outperforms Chemistry
Parameter-Specific Reduction:
- BOD Reduction: Biological cultures achieve 85-95% BOD reduction naturally, compared to 60-70% with chemical treatment alone
- COD Reduction: Complex organics that inflate COD readings are systematically degraded, achieving reductions from 1,500 mg/L to under 250 mg/L without coagulants
- Color Removal: Enzymatic decolorization removes color at the molecular level rather than merely precipitating it into sludge
- Nutrient Balance: Biological systems maintain optimal C:N:P ratios automatically, ensuring stable treatment performance
The critical difference lies in selectivity. Chemical coagulants precipitate everything indiscriminately, creating massive sludge disposal challenges. Bacteria target specific pollutants, converting them into non-toxic biomass that settles efficiently and can even be composted in some applications.
Solving the Silent Crisis: Odor Control Through Biological Intervention
The Five Root Causes of Foul Odor in STPs
Industrial Sewage Treatment Plants often become neighborhood nuisances due to overwhelming odors. Understanding the source is essential to implementing effective solutions.
Cause One: Hydrogen Sulfide (H₂S) Generation When organic matter decomposes under anaerobic conditions, in septic tanks, collection sumps, or poorly aerated zones, sulfate-reducing bacteria convert sulfates into hydrogen sulfide. This compound produces the characteristic “rotten egg” smell and is toxic at elevated concentrations.
Cause Two: Anaerobic Pockets in Aeration Tanks Insufficient dissolved oxygen creates microenvironments where anaerobic degradation dominates. These pockets generate volatile fatty acids, mercaptans, and indoles, all malodorous compounds that pervade the entire facility.
Cause Three: Septic Influent When wastewater remains in collection systems too long before treatment, it turns septic. The transition from aerobic to anaerobic metabolism releases ammonia, volatile sulfur compounds, and organic acids that create penetrating odors.
Cause Four: Sludge Putrefaction Accumulated sludge in clarifiers or thickeners undergoes anaerobic decay if not removed promptly. Dead bacterial biomass becomes substrate for putrefactive bacteria, generating offensive odors.
Cause Five: Inadequate Mixing and Dead Zones Poor hydraulic design creates stagnant zones where solids accumulate and decompose anaerobically. These dead zones become continuous odor sources regardless of overall system performance.
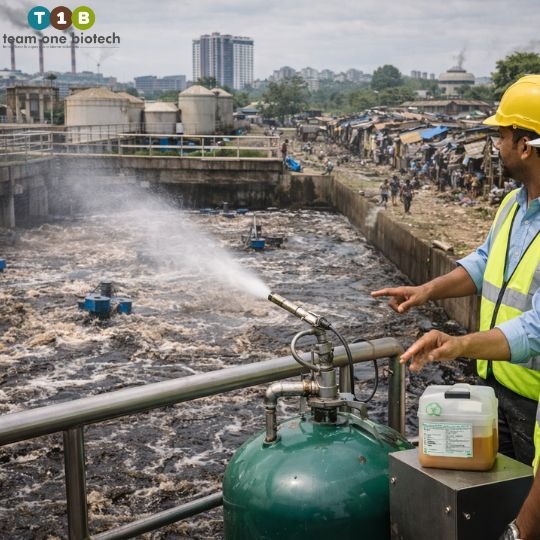
The Biological Mechanism of Odor Neutralization
Team One Biotech’s odor control formulations don’t mask smells, they eliminate the compounds generating them through three biological pathways.
Pathway One: Direct Sulfur Oxidation Specialized Thiobacillus species oxidize hydrogen sulfide directly to elemental sulfur and sulfate. These chemoautotrophic bacteria derive energy from sulfur compound oxidation, rapidly converting H₂S to odorless forms. The reaction is elegant: H₂S + O₂ → S⁰ + H₂O, followed by further oxidation to sulfate.
Pathway Two: Enhanced Aerobic Metabolism By dramatically increasing the population of efficient aerobic bacteria, biological additives shift the metabolic balance. These bacteria outcompete slower-growing anaerobic species for substrate, preventing the formation of odorous intermediate compounds. The result is rapid, complete oxidation of organics to CO₂ and H₂O rather than partial degradation to smelly intermediates.
Pathway Three: Nitrification Enhancement Ammonia, a major odor component, is systematically converted to nitrate through biological nitrification. Nitrosomonas bacteria oxidize ammonia to nitrite, while Nitrobacter species complete the conversion to nitrate. Both forms are odorless, and the process occurs at neutral pH without chemical addition.
The Biofilm Advantage: In properly managed systems, beneficial bacteria colonize all surfaces, creating active biofilms that continuously process odorous compounds before they volatilize into the air. This represents persistent, 24/7 odor control rather than periodic chemical treatment.
Financial Case Study: The 30% Cost Reduction Reality
Company Profile: Midsize Textile Processing Unit, Surat
Facility Specifications:
- Effluent generation: 500 KLD (kiloliters per day)
- Primary pollutants: High COD (2,200 mg/L), elevated BOD (650 mg/L), color from reactive dyes
- Treatment system: Conventional physico-chemical ETP with biological secondary treatment
The Pre-Intervention Reality
Monthly Chemical Consumption:
- Alum (coagulant): 15,000 kg @ Rs. 18/kg = Rs. 270,000
- Lime (pH adjustment): 8,000 kg @ Rs. 6/kg = Rs. 48,000
- Polyelectrolyte (flocculation): 250 kg @ Rs. 180/kg = Rs. 45,000
- Sodium hypochlorite (disinfection): 600 liters @ Rs. 85/L = Rs. 51,000
- Total Monthly Chemical Cost: Rs. 414,000
Additional Operating Costs:
- Sludge disposal: 180 tons/month @ Rs. 1,200/ton = Rs. 216,000
- Power consumption (higher due to inefficient aeration): Rs. 125,000
- Non-compliance penalties (quarterly average): Rs. 50,000
- Total Monthly Operating Cost: Rs. 805,000
The Intervention: Biological Culture Integration
Team One Biotech implemented a phased biological enhancement program:
- Phase 1 (Month 1-2): Introduction of specialized microbial consortium to activated sludge system
- Phase 2 (Month 3-4): Optimization of aeration and nutrient dosing based on bacterial population dynamics
- Phase 3 (Month 5-6): Gradual reduction of chemical coagulant dosing as biological performance stabilized
Post-Intervention Results (Month 12)
Monthly Chemical Consumption:
- Alum: 4,500 kg @ Rs. 18/kg = Rs. 81,000 (70% reduction)
- Lime: 5,000 kg @ Rs. 6/kg = Rs. 30,000 (37% reduction)
- Polyelectrolyte: 100 kg @ Rs. 180/kg = Rs. 18,000 (60% reduction)
- Sodium hypochlorite: 300 liters @ Rs. 85/L = Rs. 25,500 (58% reduction)
- Biological culture: Rs. 35,000 (new recurring cost)
- Total Monthly Chemical Cost: Rs. 189,500
Chemical Cost Savings: Rs. 224,500 per month (54% reduction)
Additional Benefits:
- Sludge generation reduced to 95 tons/month = Rs. 114,000 (47% reduction)
- Power consumption optimized = Rs. 105,000 (16% reduction)
- Zero compliance penalties = Rs. 50,000 saved
- Total Additional Savings: Rs. 122,000 per month
Combined Monthly Savings: Rs. 346,500 Annual Savings: Rs. 4,158,000
The Broader ROI Picture
Beyond direct cost savings, the facility experienced:
Operational Improvements:
- Consistent discharge compliance (100% of tests within limits for 10 consecutive months)
- Elimination of foul odors, improving worker safety and community relations
- Reduced manpower for sludge handling and chemical dosing
- Extended equipment life due to reduced chemical corrosion
Strategic Advantages:
- Enhanced corporate sustainability profile, improving customer perception
- Qualification for green financing at preferential interest rates
- Reduced regulatory scrutiny, allowing focus on production rather than compliance management
- Improved employee morale and retention in plant operations
The 30% figure represents the conservative estimate focusing solely on chemical and sludge costs. When accounting for penalty avoidance, reduced labor, and operational efficiency, total cost reduction approached 43%.
Conventional Treatment vs. Team One Biotech Bioremediation: A Comparative Analysis
| Parameter | Conventional Chemical Treatment | Team One Biotech Bioremediation |
| Initial Capital Cost | Lower (basic chemical dosing systems) | Moderate (biological seeding and optimization) |
| Monthly Operating Cost | High (continuous chemical purchase) | 30-50% lower (reduced chemical dependency) |
| COD/BOD Reduction | 60-70% (variable performance) | 85-95% (consistent, natural degradation) |
| Sludge Generation | 3-5 kg per m³ treated | 1-2 kg per m³ treated (50-60% reduction) |
| Odor Control | Requires separate chemical dosing | Inherent in biological process |
| Compliance Stability | Fluctuates with chemical quality | Stable with proper bacterial maintenance |
| Environmental Impact | High (chemical production, sludge toxicity) | Minimal (natural processes, compostable biomass) |
| System Resilience | Vulnerable to chemical supply disruptions | Self-sustaining once established |
| Operator Skill Required | Moderate (chemical handling) | Moderate (biological monitoring) |
| Long-term Scalability | Costs increase linearly with flow | Costs increase sub-linearly (bacterial reproduction) |
The Implementation Roadmap: Making the Transition
Phase 1: Baseline Assessment (Week 1-2)
A comprehensive audit of your existing treatment infrastructure establishes the starting point. Team One Biotech’s technical team evaluates:
- Current effluent characteristics across 24-hour cycles
- Existing biological activity (MLSS, SVI, microscopic examination)
- Hydraulic retention times and flow patterns
- Chemical dosing rates and costs
- Historical compliance performance
Phase 2: Biological Seeding and Acclimatization (Week 3-6)
Introduction of specialized microbial consortiums must be staged carefully to avoid shocking existing biological systems:
- Week 3: Initial seeding at 25% of recommended dosage, monitoring dissolved oxygen and pH stability
- Week 4: Increase to 50% dosage, begin reducing chemical coagulant by 20%
- Week 5: Full biological dosage achieved, chemical coagulant reduced by 40%
- Week 6: System stabilization, monitoring for consistent COD/BOD reduction
Phase 3: Optimization and Chemical Reduction (Week 7-12)
As biological populations establish dominance, chemical dependencies decrease systematically. Daily monitoring guides gradual reductions while maintaining discharge compliance.
Phase 4: Sustained Performance and Continuous Improvement (Month 4+)
Established biological systems require ongoing nutrient balancing and periodic reseeding to maintain populations. Monthly performance reviews ensure sustained compliance and identify opportunities for further optimization.
The Strategic Value of Sustainable Wastewater Management
Water Security as Competitive Advantage
Industries that achieve water recycling rates exceeding 70% position themselves strategically as freshwater scarcity intensifies. Zero liquid discharge facilities command premium market positioning, attracting environmentally conscious customers and investors.
Carbon Credits and Green Financing
Biological treatment systems consume significantly less energy than chemical alternatives, reducing Scope 2 carbon emissions. This qualifies facilities for carbon credit generation under voluntary markets and improves eligibility for green bonds at favorable interest rates.
Workforce and Community Relations
Facilities known for environmental stewardship attract and retain higher-quality talent. Eliminating odors and visible pollution transforms industrial units from neighborhood liabilities to responsible corporate citizens, reducing community opposition to expansion plans.
Future-Proofing Against Regulatory Tightening
CPCB standards will only become more stringent. Systems designed for biological treatment adapt easily to tighter limits through population optimization, while chemical systems require expensive infrastructure additions.
Common Implementation Challenges and Solutions

Challenge: Fluctuating Influent Characteristics
Reality: Industrial production varies seasonally or with order cycles, creating wastewater quality fluctuations that stress biological systems.
Solution: Equalization tanks buffer flow variations, while robust microbial consortiums tolerate wider parameter ranges than conventional activated sludge systems. Strategic bacterial seeding during production ramp-ups maintains population adequacy.
Challenge: Temperature Extremes
Reality: Indian climates range from 5°C winters in North India to 45°C summers in Central regions, affecting bacterial metabolism.
Solution: Team One Biotech’s formulations include psychrotolerant strains active at low temperatures and thermotolerant strains for heat resistance, ensuring year-round performance.
Challenge: Toxic Shock Loads
Reality: Accidental discharges of concentrated chemicals or biocides can devastate biological populations.
Solution: Real-time monitoring systems provide early warning, while emergency reseeding protocols restore functionality within 48-72 hours. Proper segregation of toxic waste streams prevents most shock events.
The Team One Biotech Difference: Science Meets Service
Proprietary Microbial Formulations
Two decades of research into Indian industrial effluents have produced consortiums specifically adapted to textile dyes, pharmaceutical residues, food processing organics, and heavy industrial compounds. These aren’t generic bacterial products but precision-engineered solutions.
Technical Support Infrastructure
Every Team One Biotech client receives:
- Dedicated environmental engineer for system optimization
- 24/7 helpline for operational emergencies
- Quarterly performance audits with detailed reporting
- Ongoing training for plant operators on biological system management
Proven Track Record
With over 300 installations across India’s industrial heartland, from Surat’s textile clusters to Hyderabad’s pharma corridor, Team One Biotech has demonstrated consistent results in the most challenging conditions.
Your Path Forward: Three Steps to Transformation
Step One: Knowledge
You’ve taken this step by reading this comprehensive guide. You now understand the regulatory landscape, the science of biological treatment, and the financial case for change.
Step Two: Assessment
Engage Team One Biotech’s technical team for a no-obligation facility assessment. Understand your specific challenges, opportunities, and the customized solution pathway.
Step Three: Implementation
Begin the transformation from chemical dependency to biological excellence. Join the growing community of Indian industries proving that profitability and environmental responsibility are not competing goals but complementary strategies.
The Moral Imperative: Water for the Next Generation
Every liter of wastewater your facility treats properly is a liter available for agriculture, for drinking water, for life itself. India’s water crisis is not an abstract environmental concern, it is the defining challenge of our industrial generation.
The Noyyal River can flow again. The communities downstream from your facility can thrive. Your plant can operate profitably while contributing to planetary healing rather than degradation.
Partner with Team One Biotech for a Sustainable Future
The choice is clear: continue down the path of chemical dependency, rising costs, and regulatory uncertainty, or embrace the biological revolution transforming Indian industrial wastewater treatment.
Team One Biotech stands ready to guide your transformation. Our expertise, proven formulations, and unwavering commitment to your success make us the partner you need for this critical journey.
Looking to improve your ETP/STP efficiency with the right bioculture?
Talk to our experts at Team One Biotech for customised microbial solutions.
Contact: +91 8855050575
Email: sales@teamonebiotech.com
Visit: www.teamonebiotech.com
Discover More on YouTube – Watch our latest insights & innovations!-
Connect with Us on LinkedIn – Stay updated with expert content & trends!