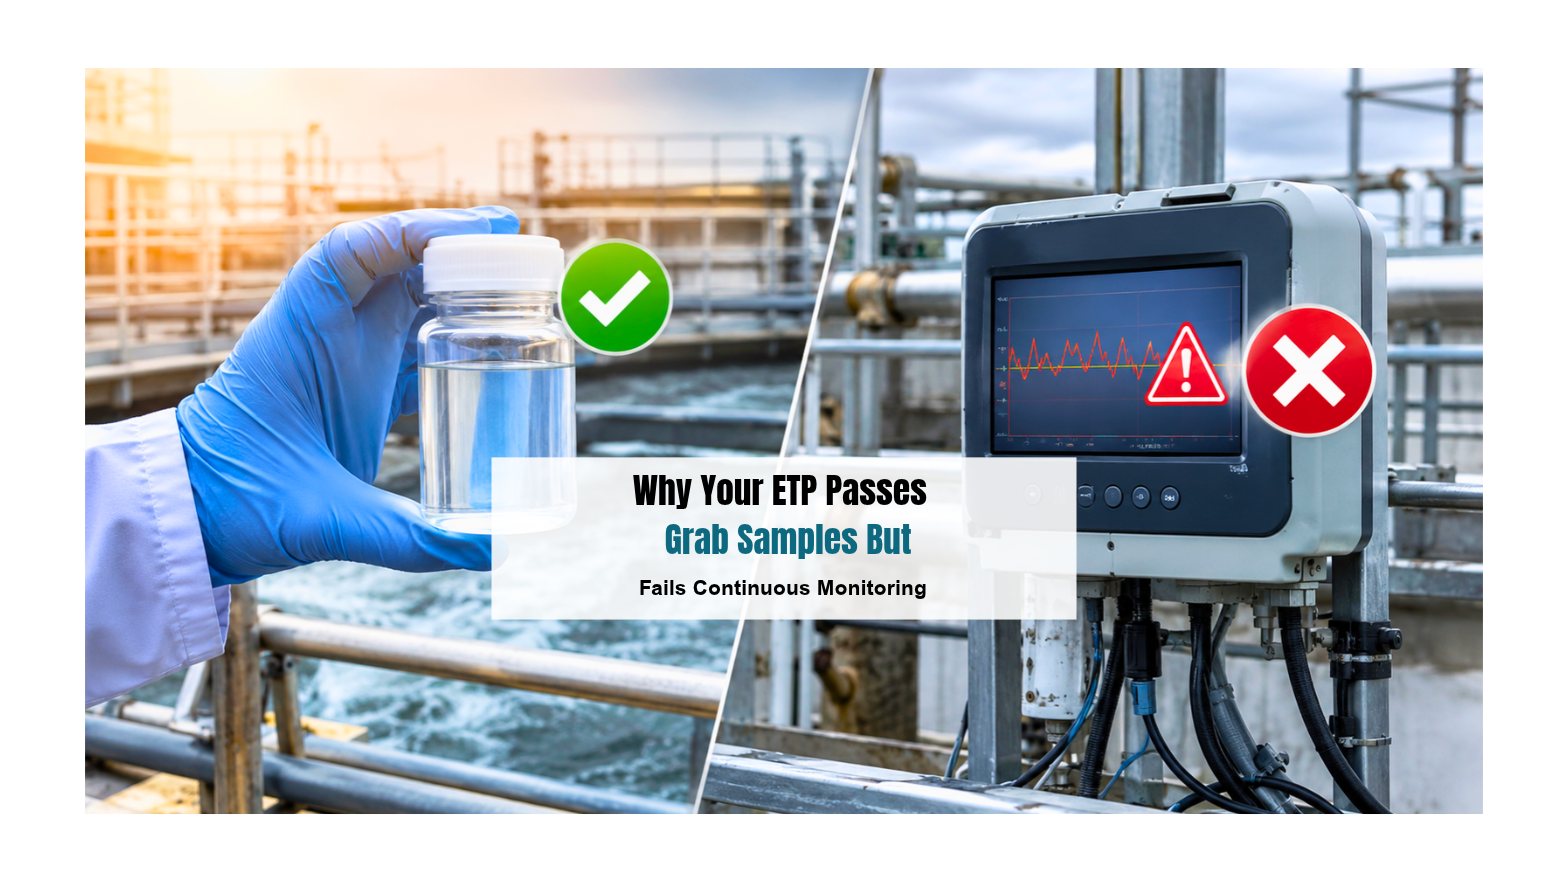
Why Your ETP Passes Grab Samples But Fails Continuous Monitoring

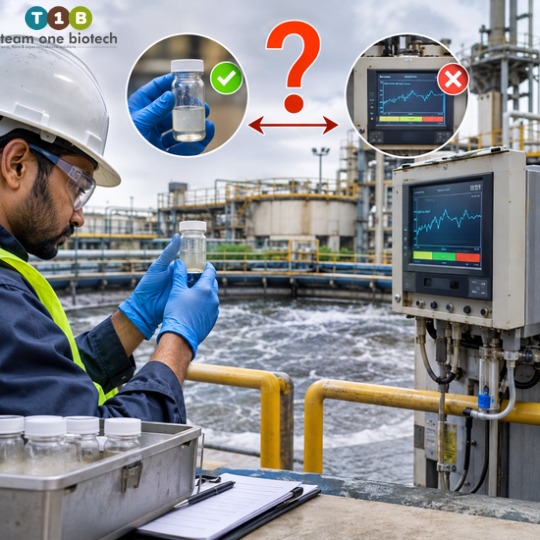
The lab report is clean. The grab sample passed, the team is relaxed, and someone has already said, “We’re fine this month.” Then the OCEMS dashboard turns red. Worse, the alert has reached the regulator’s server before it reached your desk. Your phone starts ringing, management wants answers, and the first question is always the same: how can the lab say we’re compliant while the analyzer says we’re not?

If this is happening at your plant, you’re dealing with a classic OCEMS compliance failure, and you’re not alone. It’s common, it’s explainable, and it’s fixable. This blog explains why grab samples and continuous monitoring disagree, where the real causes sit (in the sensors, the biology, and the operations), and what you can do to flatten the spikes.

Keep reading. The hidden causes are usually closer to your aeration tank than to your analyzer.

What Is Really Happening When Grab Samples and OCEMS Disagree
What Is Really Happening When Grab Samples and OCEMS Disagree

Think of a grab sample as a single photograph. It’s sharp, accurate, and tested by a proper lab method. But it only shows one moment, at one location, collected by one person.

Your continuous effluent quality monitoring system (EQMS) is the entire film. It records what happens before, during, and after that photograph, including the scenes you’d rather not see: the surge after a shift change, the batch drained from a process tank, the sludge carryover when the clarifier is stressed.

Here’s the uncomfortable part. Both can be right at the same time. The grab sample correctly says the effluent was within limits at that moment. The OCEMS correctly says the effluent wasn’t within limits at other moments. The regulator, however, reads the film, not the photograph.

Under current expectations, OCEMS data flows in real time to the CPCB and SPCB servers. Your plant head isn’t the first audience. That’s why ETP grab sample vs online monitoring is no longer a lab argument. It’s a compliance reality.

AspectGrab SampleContinuous OCEMS
TimingScheduled, often predictableAround the clock, unannounced
CoverageOne moment, one pointEntire operating period
Bias riskDepends on who samples, where, and whenDepends on sensor condition and placement
Peak detectionUsually misses short peaksCaptures peaks and trends
Regulatory visibilitySeen when submitted or inspectedSeen live on the regulator’s server
What it can missSurges, shock loads, off-hour dischargesLab-grade accuracy if the sensor drifts

Why Grab Samples Can Hide an OCEMS Compliance Failure
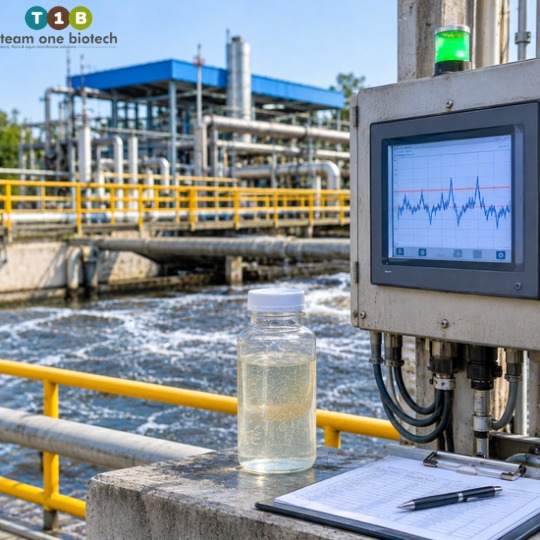
Why Grab Samples Can Hide an OCEMS Compliance Failure

A clean grab sample is not a lie. It’s just incomplete. Here’s how it usually hides the problem.

Sampling bias

Who samples, from where, and at what time matters more than most plants admit. A sample taken from the calm end of the outlet channel, at mid-morning, by a careful technician, will almost always look better than the average of the day.

Predictable testing windows

When sampling follows a schedule, the plant behaves its best during that window. Operators watch the aeration, trim the load, and hold back any batch discharge. That’s human nature, but the microbes and the process don’t behave that way at 2 a.m.

Dilution effects

Rain ingress, cooling water, and mixing in the final tank can mask the true quality. Stored or batch discharge works the other way. The effluent can look fine for hours, then a concentrated slug leaves the plant. In many plants, the variation between a calm period and a peak period can be roughly 20 to 40 percent or more, and that’s enough to cross a limit.

Composite versus instantaneous results

A composite sample averages out the peaks. A sensor reading is instantaneous. If your lab reports a composite and the regulator sees instantaneous trends, the two will never match perfectly, and that gap is where many show-cause notices begin.

Lab method versus sensor method

The lab measures COD or BOD by a defined chemical or biological method. The sensor estimates the same parameter optically. The two methods respond differently to color, turbidity, and organics, so some difference is expected even when everything is working.

Note: The values and ranges mentioned here are general indications only. Actual figures differ from one ETP to another based on industry type, process load, design, and operating conditions.

Why Continuous Monitoring Catches What Spot Tests Miss
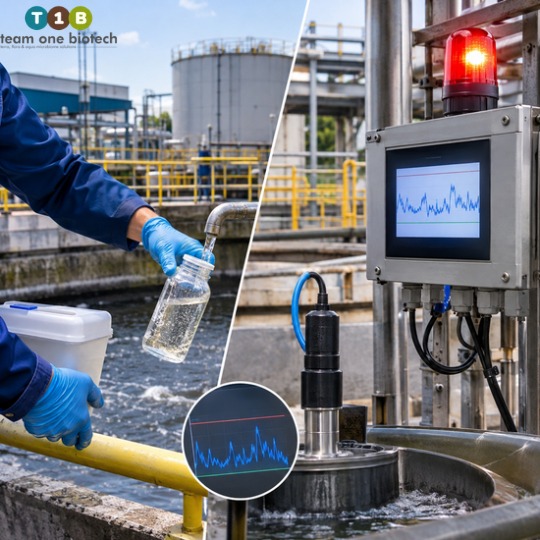
Why Continuous Monitoring Catches What Spot Tests Miss

Continuous systems don’t take breaks, don’t know your schedule, and don’t forgive a bad hour. Here’s what they actually pick up.

The sensing principle

Many analyzers use a UV-Vis spectrophotometer COD sensor, which estimates COD, and sometimes BOD and TSS, from how the effluent absorbs light. It reacts quickly to changes in color, turbidity, and dissolved organics. A burst of dye, a puff of solids, or a stronger organic slug shows up almost immediately.

Real operational events

Peak hydraulic surges, shift change discharges, CIP cycles, and batch dumping all produce short, sharp excursions. A grab sample rarely lands on them. A sensor always does.

Probe drift and calibration gaps

Optical sensors drift over time. If calibration is late or the reference isn’t checked against the lab, the baseline slowly moves and readings look worse (or better) than reality.

Bio-fouling and scaling

OCEMS probe drift and bio-fouling often go together. A slimy film on the probe window, scale in the sample line, or a dirty flow cell can push readings up without any real change in effluent quality.

Sensor location and conditioning

Where the sample is drawn and how it’s conditioned (filtered, settled, pumped) affects the reading. A poorly placed line can pick up settled solids or air bubbles.

The honest part: sometimes the sensor is wrong

Not every red alert is a real breach, and blaming the plant blindly is as unhelpful as blaming the instrument blindly. Good practice is to validate: compare OCEMS readings against regular lab results, look at the correlation over weeks, and check whether spikes line up with real events in the plant log. If a spike has no operational explanation and disappears after cleaning the probe, you’ve likely found a sensor issue. If it follows a batch discharge or a clarifier upset, it’s real.

Plant Reality Check

Most “mystery” spikes aren’t mysterious. Pull your shift log, your discharge schedule, and your alert time-stamps side by side. In many plants, the spike and the event are sitting in the same hour, and nobody had put the two sheets next to each other.

The Biological Root Causes Behind Hidden Parameter Spikes
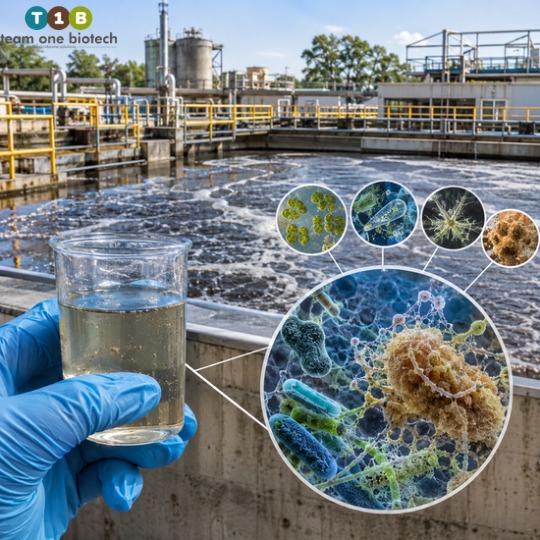
The Biological Root Causes Behind Hidden Parameter Spikes

Even when the sensors are perfect, the biology decides what the sensor sees. Short-lived peaks of COD BOD TSS spikes in effluent usually start in the biological stage.

Unstable biomass

When the incoming load swings widely, the microbial population can’t keep pace. A weak or fluctuating biomass degrades organics unevenly, and the outlet quality follows the same pattern.

Nutrient imbalance and oxygen gaps

Missing nitrogen or phosphorus slows degradation. Low dissolved oxygen zones and uneven aeration leave parts of the tank under-performing, even if the average DO looks acceptable.

Sludge bulking and clarifier carryover

In Sludge Bulking – Filamentous growth, floc breakup, or a hydraulic push through the secondary clarifier carries solids over the weir. That drives TSS up, and since those solids carry organic matter, COD rises with them.

Toxic and inhibitory shocks

A sudden dose of biocide, strong acid or alkali, or a concentrated process stream can suppress the microbes. The real damage isn’t just the shock itself. It’s the slow recovery that follows, with poor quality for hours or even days.

Color and recalcitrant organics

Some compounds, especially in dye, chemical, and pharma streams, aren’t broken down by ordinary biomass. They pass through, and an optical sensor notices them quickly.

Note: The values and ranges mentioned here are general indications only. Actual figures differ from one ETP to another based on industry type, process load, design, and operating conditions.

Talk to Team One Biotech’s technical team for a plant-specific assessment. We’ll help you trace whether your spikes begin in the sensor, the process, or the biology.

How to Flatten the Spikes and Achieve True 24/7 Compliance

You can’t remove every disturbance, but you can stop the plant from passing them straight to the outlet. Here’s how plants typically do it.

1. Equalization: smooth the load before it reaches the biology

A well-designed equalization tank ETP buffers flow and load so the biological stage sees a steadier feed. Check three things: whether the tank is sized for your actual peak pattern, whether it’s mixed properly so concentrated slugs don’t sit in dead zones, and whether pumping is controlled rather than surge-driven. Pumping on a gentle, steady profile often does more for your OCEMS trend than any single equipment upgrade.

2. Biological stabilization: build a population that can take a hit

Biological stabilization of ETP means keeping a strong, diverse, active microbial community that handles load swings and recovers quickly. This is where bioremediation for effluent treatment becomes a practical tool. Team One Biotech’s bioremediation solutions are used to support stable biology, improve shock-load resilience, and help the plant return to normal faster after a disturbance. The goal is consistent effluent quality, not a promise of zero violations. Results depend on the plant’s design, load, and how well the basics are managed.

3. Process control: keep the basics tight

Control dissolved oxygen so no zone starves. Dose nutrients to match load. Watch the food-to-microorganism balance and manage sludge age deliberately instead of by habit. Many bulking and carryover problems trace back to drift in these basics.

4. OCEMS hygiene: treat the analyzer like process equipment

Schedule cleaning, calibrate on time, and validate against lab results regularly. Set internal alert thresholds below your regulatory limits so the team gets an early warning, not a notice. A hydraulic surge and shock load in ETP rarely appears out of nowhere. The trend usually starts climbing before the breach.

5. Operations discipline: plan discharge, don’t just react to it

Plan shift-wise discharge, schedule batch dumps and CIP drains so they don’t stack up, and make real-time dashboard review part of the shift routine. When the plant team sees the data before the regulator’s server does, the whole conversation changes.

Note: The values and ranges mentioned here are general indications only. Actual figures differ from one ETP to another based on industry type, process load, design, and operating conditions.

Request a free consultation or ETP performance review from Team One Biotech.

A Quick Self-Check Before the Next OCEMS Compliance Failure

Ask these questions about your own plant:

  • Do our grab samples follow a fixed routine that operators can predict?
  • Have we compared OCEMS trends against lab results in the last few weeks?
  • Is the equalization tank mixed well, and is outflow controlled rather than surge-driven?
  • Do our alert thresholds sit below regulatory limits for early warning?
  • When was the last time the probe, sample line, and flow cell were cleaned and calibrated?
  • Do batch discharges and CIP drains overlap with shift changes?
  • Do we see DO, MLSS, and nutrient trends daily, or only when something goes wrong?
  • Does the plant team review the live dashboard, or only the lab team?

If you answered “no” or “not sure” to more than a few, you’ve found your starting point.

Frequently Asked Questions

Why does my ETP pass lab tests but fail OCEMS limits?

Lab tests capture a single moment, while OCEMS records the entire day. Peaks from surges, batch discharges, and clarifier carryover appear in continuous data but are easy to miss in a scheduled sample.

Can OCEMS sensor drift cause a false compliance failure?

Yes. Drift, bio-fouling, and poor sample conditioning can push readings away from true values. Regular calibration and correlation checks against lab results help separate sensor error from real excursions.

How can an equalization tank reduce COD and TSS spikes in online monitoring?

It buffers flow and load, so the biological stage receives a steadier feed. With proper mixing and controlled pumping, sudden slugs are diluted and the clarifier is less likely to be overloaded.

Can bioremediation help prevent OCEMS compliance failure?

It can support the biological side by building a more stable, shock-resilient microbial population that recovers faster. It works best alongside good equalization, process control, and OCEMS maintenance.

Conclusion

An OCEMS compliance failure rarely means your team isn’t trying. It usually means the plant behaves differently across the day than a single sample can show. Better equalization, stronger biology, disciplined operations, and a well-kept analyzer close that gap.

Please confirm requirements with your SPCB consent conditions and applicable CPCB directions.

Don’t wait for the next show-cause notice to find out what your OCEMS data has been telling you. Talk to Team One Biotech’s bioremediation experts today, and get your plant reviewed.

Looking to improve your ETP/STP efficiency with the right bioculture?
Talk to our experts at Team One Biotech for customised microbial solutions.

Contact: +91 8855050575

Email:  sales@teamonebiotech.com

Visit: www.teamonebiotech.com

Discover More on YouTube – Watch our latest insights & innovations!-

Connect with Us on LinkedIn – Stay updated with expert content & trends!

SPCB Show-Cause Notice for Your STP? A 30-Day Response Framework

You know the feeling. The email lands, or the courier hands over the envelope, and your stomach drops. A show-cause notice. Your mind jumps straight to the worst outcomes: power or water disconnection, action on your bank guarantee, a direction of closure, and a very uncomfortable conversation with residents, tenants, or management.

Take a breath. A notice is serious, but it isn’t the end of the road. A show-cause notice is a formal request from your State Pollution Control Board (SPCB) asking you to explain, in writing, why action shouldn’t be taken for non-compliance. It sits within the powers the board holds under Section 33A of the Water (Prevention and Control of Pollution) Act, 1974. In general terms, that includes issuing directions, including closure and the stoppage or regulation of electricity or water supply.

This guide gives you a clear, week-by-week plan to fix what’s failing and build a strong SPCB show cause notice reply. It’s a general compliance framework, so please involve your legal or compliance team from day one.

The 30-Day Roadmap at a Glance

The 30-Day Roadmap at a Glance

WeekGoalKey Output
Week 1 (Days 1 to 7)Stabilize and investigateNotice analysis, root-cause findings, stabilized operations
Week 2 (Days 8 to 14)Restore biological performanceBioaugmentation plan, daily monitoring records
Week 3 (Days 15 to 21)Verify with dataNABL-accredited lab reports, organized documentation
Week 4 (Days 22 to 30)Draft and fileEvidence-backed reply, proof of submission

These are general values. Actual figures differ for every STP and ETP based on design, load, and site conditions.

What an SPCB Show-Cause Notice for an STP Really Means

What an SPCB Show-Cause Notice for an STP Really Means

A notice rarely comes out of nowhere. Usually, something triggered it: a routine inspection, a sampling visit, a complaint from neighbors, or lab results that showed your treated effluent didn’t meet the prescribed standards. This is what we call STP effluent non-compliance.

The parameters most often flagged are BOD (biochemical oxygen demand, the amount of oxygen microbes need to break down organic matter), COD (chemical oxygen demand, a broader measure of pollutants), TSS (total suspended solids), and FOG (fats, oils, and grease). Sometimes pH, ammoniacal nitrogen, and coliform counts appear too. Your treated water is measured against CPCB discharge norms and any specific limits your SPCB has set for your site.

Is a pollution board notice ETP different from an STP notice?

Not in the way that matters. Whether it’s a pollution board notice ETP (effluent treatment plant, usually industrial) or one for an STP (sewage treatment plant, usually residential or commercial), the logic is the same. The board has found a gap between what your plant discharges and what it’s supposed to discharge, and it wants a written explanation and a fix.

Show-cause notice vs. direction of closure

Think of it as an escalation path. A show-cause notice is the board asking you to explain. If the explanation or the corrective action isn’t convincing, the next step can be a formal direction, which may include closure and stoppage or regulation of power or water supply. A direction of closure for an STP is the stage you want to avoid, and this is exactly why your first response matters.

Possible consequences, if things escalate:

  • Environmental compensation or penalties
  • Action on the bank guarantee
  • Stoppage or regulation of electricity or water supply
  • A direction of closure
  • Reputational damage with residents, tenants, customers, and regulators

Received a notice today? Speak to a Team One Biotech compliance expert before your timeline runs out.

Week 1 (Days 1 to 7): Stabilize and Investigate

Week 1 (Days 1 to 7): Stabilize and Investigate

The first week is about two things: understanding exactly what the board is saying, and finding out why your plant failed. Don’t skip straight to fixes. A fix without a diagnosis is just a guess.

Read the notice line by line

Sit down with the document and highlight everything. Note the reply deadline, the parameters cited, the sampling dates, the sampling location, and exactly what the board is asking you to submit. Missing a small detail here can cost you later.

Assemble your response team

You need the right people in the room early:

  • Your plant operator, who knows the daily reality
  • The EHS head or facility director
  • Your legal or compliance team
  • An external microbial or process expert who can look at the plant with fresh eyes

Run a root-cause audit

This is the heart of the first week. A proper root cause analysis for your STP looks at what changed before the failure. Ask these questions:

  • Did the inflow load or flow pattern change, perhaps from new occupancy, a new kitchen, or a seasonal shift?
  • Did aeration fail or weaken? Check blowers, diffusers, and dissolved oxygen levels.
  • Is sludge age off, or has sludge built up or been wasted too aggressively?
  • Is there short-circuiting in tanks, so that water isn’t getting its full treatment time?
  • Were there chemical dosing errors?
  • Is FOG overloading the system from kitchens, canteens, or food outlets?

Don’t forget equipment health. Pumps, blowers, diffusers, and clarifier mechanisms all need an honest inspection.

Start immediate stabilization

You don’t need to wait for the full audit to stop the bleeding. Keep the steps general and safe:

  • Balance the inflow load with an equalization tank where available
  • Correct aeration so the biology gets the oxygen it needs
  • Manage sludge by removing excess and avoiding carryover
  • Control FOG at the source with grease traps and cleaning schedules
  • Fix obvious mechanical faults right away

Document everything you do and when you do it. This record becomes part of your reply later.

Week 2 (Days 8 to 14): Biological Recovery with Fast-Track Bioaugmentation

Week 2 (Days 8 to 14): Biological Recovery with Fast-Track Bioaugmentation

Here’s the plain truth about most STP failures. The machinery is usually fine. The microbes are struggling.

Your plant depends on a living microbial population to break down pollutants. When that population is shocked by a toxic load, starved of oxygen, or simply outnumbered, treatment performance collapses. BOD, COD, TSS, and FOG numbers drift out of limits, and a notice follows.

What bioaugmentation actually does

Bioaugmentation for STP means introducing selected, high-performing microbial cultures into the treatment system to strengthen or rebuild the working population. Microbial re-seeding is closely related. It restores the biology after a shock event, a shutdown, or a major washout. Done properly, these approaches help the system recover its ability to degrade organic load, reduce suspended solids, and break down grease.

How a structured program works

A credible program isn’t a bucket of powder tossed into a tank. It typically follows a clear sequence:

  • Baseline testing. Measure current performance and understand the inflow characteristics.
  • Tailored strain selection. Choose microbial cultures that suit your wastewater, whether it’s high in grease, high in organic load, or nitrogen-heavy.
  • Dosing schedule. Apply cultures at planned intervals, usually over a period of a few days to a couple of weeks depending on conditions.
  • Monitoring. Track parameters regularly and adjust the program based on what the data shows.

Many plants begin to see measurable improvement within a window of a few days to a few weeks, but this varies widely.

These are general values. Actual figures differ for every STP and ETP based on design, load, and site conditions.

At Team One Biotech, this is what we do every day as a provider of bioremediation solutions in India. We work with plant teams to design a recovery plan around their specific wastewater, not a generic one. You can explore our bioaugmentation for STP range and our wider effluent treatment solutions for both STP and ETP effluent treatment.

Need a fast-track bioaugmentation plan for your STP? Request a free effluent assessment, Contact a free assessment from Team One Biotech.

What to monitor daily

  • Dissolved oxygen in the aeration tank
  • pH of the incoming and treated water
  • Visual checks: color, odor, foam, and sludge settling
  • Sludge volume and settling behavior
  • Treated water clarity at the outlet
  • Equipment running hours and any faults

For deeper guidance on the numbers themselves, see our related blog on how to reduce BOD and COD in your STP.

Week 3 (Days 15 to 21): Verify with Data and Document Everything

By now your plant should be responding. But the board won’t take your word for it, and honestly, you shouldn’t take your own either. This week is about proof.

Collect samples at defined points, typically the inlet, the aeration tank, and the final outlet. Send them to a NABL-accredited laboratory. NABL stands for the National Accreditation Board for Testing and Calibration Laboratories, and accreditation tells the reader that the lab follows recognized testing standards.

Why does this matter so much? Because in-house readings, however careful, are easy to question. A third-party certified report carries independent weight. It tells the board you’ve measured honestly and that you’re serious about compliance.

Compare your results against the limits that apply to you, meaning the CPCB norms and the specific limits stated in your SPCB notice or consent conditions. Always treat your SPCB’s stated limits as the final reference.

Keep these documents ready:

  • NABL lab reports with sampling dates and locations
  • Operator logbooks and daily operating data
  • Dosing records for any bioaugmentation or chemicals
  • Calibration records for meters and instruments
  • Dated photographs of equipment, repairs, and the plant
  • Maintenance records and work orders
  • Any correspondence with the board

If your results show improvement but sit close to the limit, don’t panic. Plants often need a few more days to a couple of weeks to settle into steady performance after biological recovery.

These are general values. Actual figures differ for every STP and ETP based on design, load, and site conditions.

Want a second pair of eyes on your reply and lab data? Share your notice and parameters with our team. We’ll tell you honestly where you stand.

Week 4 (Days 22 to 30): Draft and File a Strong SPCB Show Cause Notice Reply

This is where all your work turns into a document the board will actually read. A strong SPCB show cause notice reply doesn’t need to be long. It needs to be clear, honest, and backed by evidence.

What a credible show cause reply contains

  • Acknowledgment. Confirm receipt of the notice and its reference details.
  • Root cause. State plainly what went wrong, based on your audit.
  • Corrective actions taken. List what you did, with dates.
  • Verifiable lab evidence. Attach your NABL-accredited reports.
  • An engineering compliance timeline. Share a realistic schedule for any remaining work. This is your STP compliance action plan.
  • A preventive maintenance plan. Show how you’ll keep the plant stable going forward.

Tone matters

Keep it factual, respectful, and evidence-led. Don’t make excuses. Don’t blame the board, the contractor, or the residents. Boards respond far better to accountability than to defensiveness. Own the problem, show the fix, and demonstrate the plan.

Submit properly

File within the deadline stated in the notice. Keep proof of submission, whether that’s a stamped copy, a courier receipt, or an email acknowledgment. If your situation calls for it, consider requesting a re-inspection or a hearing so the board can see the improvements for itself. Your legal or compliance team should guide this step.

Before you hit send

  • Does the reply address every point raised in the notice?
  • Are all lab reports attached, legible, and dated?
  • Do the numbers in your text match the lab reports exactly?
  • Is the timeline realistic and not overpromised?
  • Has your legal or compliance team reviewed it?
  • Have you kept a complete copy and proof of submission?

Common Mistakes That Weaken Your Show Cause Reply

After seeing plants go through this process, certain patterns show up again and again. Avoid these:

  • Waiting too long to act. Every day spent hoping the problem goes away is a day lost from your response window.
  • Relying on in-house readings only. Without independent lab proof, your claims are easy to dismiss.
  • Ignoring root causes. If you treat only the symptom, the failure will come back.
  • Submitting without lab evidence. A reply with no data is just a promise.
  • Overpromising timelines. A deadline you can’t meet damages your credibility more than a realistic, longer one.
  • Treating a quick fix as a permanent fix. A short-term improvement isn’t the same as sustained compliance. Plan for the long run.

Frequently Asked Questions

How long do I have to reply to an SPCB show-cause notice?

The deadline is stated in the notice itself, and it varies from one board and one case to another. Many notices allow somewhere from a few days to a few weeks. Always follow the exact timeline in your notice. If you need more time, speak to your legal team about requesting an extension in writing before the deadline passes.

Can bioaugmentation help bring my STP within limits quickly?

It can help, especially when the root cause is a weakened or shocked microbial population. Many plants see early improvement within a few days to a few weeks. However, results depend on your design, load, and site conditions, and bioaugmentation works best alongside proper mechanical and operational fixes. It supports compliance but doesn’t guarantee a specific outcome.

Do I need a NABL-accredited lab report for my reply?

It’s strongly advisable. Independent, accredited lab results make your reply far more credible than in-house readings. Check your notice and consent conditions for any specific laboratory requirements, and follow what your SPCB asks.

What happens if my STP still fails after the reply?

The board may review your reply, order a re-inspection, ask for further action, or escalate to formal directions under its powers, which in general terms can include closure or stoppage or regulation of utilities. This is why genuine corrective action and clear lab evidence matter. Involve your legal or compliance team and keep the board informed of your progress.

Do Not Let a Notice Become a Closure

Here’s the 30-day framework in a nutshell. Stabilize and investigate in week one. Rebuild your plant’s biology in week two. Prove it with accredited data in week three. File a clear, honest, evidence-backed SPCB show cause notice reply in week four.

A notice feels like a verdict, but it’s really a deadline with a path through it. Plants that act early, document well, and respond with humility give themselves the strongest possible case. You don’t have to figure it out alone.

Your 30-day clock is already ticking. Contact Team One Biotech now and move from notice to compliance with a clear plan. 

Disclaimer: The values, ranges, and timelines shared in this article are general indicators only. They differ for every STP and ETP depending on inflow characteristics, treatment technology, capacity, and the specific conditions in your notice. Always follow the limits and directions stated by your SPCB and consult a qualified professional before acting.

Looking to improve your ETP/STP efficiency with the right bioculture?
Talk to our experts at Team One Biotech for customised microbial solutions.

Contact: +91 8855050575

Email:  sales@teamonebiotech.com

Visit: www.teamonebiotech.com

Discover More on YouTube – Watch our latest insights & innovations!-

Connect with Us on LinkedIn – Stay updated with expert content & trends!

Tannery Effluent: Chrome, Sulphides and Biological Limits

It’s a Tuesday morning at your leather industry ETP, and the aeration tank looks wrong. Last week the mixed liquor was a healthy brown and the clarifier gave you a clean overflow. Today the tank has gone pale and grey, and the oxygen readings make no sense. Anyone who has done tannery effluent treatment for a few seasons has seen this.

Overnight, a slug of sulphide-rich liming liquor reached the equalisation tank, or a batch of chrome wastewater slipped past the tanyard drain. Your culture took the hit. The outlet sample goes to the lab, the report comes back failed, and then the phone rings. It’s the SPCB or the CETP management, and the word they use is penalty.

You can’t remove chrome, sulphide and salt from a tannery. You can stop them from killing your biology. This post walks through a practical way to do that, from stream segregation to bioaugmentation, without pretending any single step does the job alone.

Why Tannery Effluent Treatment Is One of the Toughest Jobs in Industrial Wastewater

Few industries hand an ETP operator a harder mix. A tannery doesn’t produce one effluent. It produces several, and they rarely arrive at a steady rhythm. Soaking, liming, unhairing, deliming, pickling, chrome tanning, retanning and dyeing each release different chemistry at different hours.

Then there’s hide-to-hide variation. Raw stock, wet-blue processing, buffalo versus goat skins, fresh versus long-cured hides: every change moves your load. A CETP serving a cluster has it worse. You receive the combined chemistry of many units, each with its own recipes and shift pattern.

The result is an influent that swings in pH, colour, salinity and toxicity within a single day. Biology likes stability. Tannery effluent offers almost none.

Five problem areas do most of the damage:

  • Trivalent chromium (Cr3+) from tanyard and chrome-tanning streams, toxic to microbes and stubborn in sludge
  • Sulphides (S2-) from beamhouse liming and unhairing, toxic, odorous and oxygen-hungry
  • Extreme salinity and TDS from hide curing salt, pickling and neutralisation chemicals
  • Recalcitrant proteinaceous solids from fleshing, hair and trimmings that hydrolyse slowly
  • Refractory organic nitrogen and ammoniacal nitrogen from protein breakdown and deliming salts

None of these is new. What catches plants out is the combination, arriving unbuffered in front of a biological system that never got a chance to cope. Treat each as its own problem with its own fix, and the aeration tank finally gets a fair chance.

Chrome Wastewater: Why Cr3+ Carryover Hurts Your Biology

Chrome Wastewater: Why Cr3+ Carryover Hurts Your Biology

Chrome wastewater is rarely your largest volume, but it’s often the most damaging per litre. Modest carryover, repeated day after day, can wear down a biological system that still looks fine on paper.

Where chrome enters the system

The main source is spent chrome-tanning liquor from the tanyard. Exhaustion is never complete, so some chromium always stays in the float. Rinse waters, draining and piling floors, sammying and shaving areas, and retanning washes add more.

Leaking valves and sloppy drain discipline do the rest. In a CETP, one member unit dumping chrome without pre-treatment can undo the discipline of everyone else.

How it inhibits microbial activity and settles in sludge

Trivalent chromium binds to cell surfaces and proteins, interfering with enzymes and slowing respiration. Nitrifiers go first because they’re slow-growing and sensitive. Heterotrophs follow, and the floc weakens.

Much of the chromium then precipitates into the biological sludge. That raises handling and disposal stress and complicates how you manage that sludge later.

Watch for these warning signs in the aeration tank:

  • Mixed liquor turning pale, thin or greyish-green
  • Oxygen uptake falling while dissolved oxygen climbs
  • Pin floc, turbid supernatant and a clarifier that won’t clear
  • Ammoniacal nitrogen rising in the outlet as nitrification stalls
  • Sudden foaming or a change in the smell of the tank

Chrome recovery and precipitation as the first line of defence

Collect spent chrome liquor separately, precipitate it with an alkali in a controlled pH window (roughly in the range of 8 to 9), settle it, and remove the bulk before the biology ever sees it. Many plants redissolve the recovered chromium sludge and reuse it in tanning, which cuts both toxicity and chemical cost. That pH range is a general value and varies from ETP to ETP, so confirm it with jar tests.

Chrome recovery isn’t a replacement for biology. It’s what lets biology survive. The trace chromium that still gets through is where chromium-resistant cultures step in.

Keep chrome liquor strictly off the general drain. A dedicated collection sump with a locked valve costs far less than restarting a dead aeration tank.

Sulphides in Beamhouse Effluent: The Silent Biomass Killer

Sulphides in Beamhouse Effluent: The Silent Biomass Killer

Beamhouse effluent is where most sulphide trouble starts. Liming and unhairing use sodium sulphide and lime, so the spent liquor is strongly alkaline and loaded with sulphide, hair pulp and dissolved protein. Tanyard effluent looks very different, which is why mixing the two is risky.

Toxicity, odour and oxygen demand effects

Sulphide is toxic to many aerobic microbes even at low concentrations. It also grabs oxygen chemically before your bacteria can use it.

A shock load can pull dissolved oxygen down within an hour or two. The culture starts to suffocate, and floc quality slips with it.

Odour follows because sulphide converts to hydrogen sulphide when pH drops. That’s a safety issue, not just a nuisance. Hydrogen sulphide is dangerous to your people.

Anywhere alkaline beamhouse flow meets acidic streams can release it: deliming and pickling drains, acid dosing points, or an equalisation tank whose pH has drifted down. Gas monitoring, ventilation and clear confined-space rules aren’t optional.

Catalytic sulphide oxidation and why segregation matters

Segregation comes first. Keep beamhouse effluent separate from tanyard and acidic streams at source, so sulphide-rich liquor reaches its own treatment tank.

There, catalytic oxidation (air with a manganese-based catalyst under alkaline conditions) converts sulphide into thiosulphate and eventually sulphate, which are far less harmful. Operating pH is usually kept alkaline, roughly in the range of 8 to 9, with contact time of several hours. These are general values and vary from ETP to ETP.

The aim isn’t perfection. It’s turning a violent shock into a steady, manageable load.

If you smell rotten egg at the equalisation tank around shift change, don’t blame the biology first. Check what the beamhouse released and what the pH did over the previous hour.

Salinity, Proteins and Organic Nitrogen: The Hidden Limiters

Salinity, Proteins and Organic Nitrogen: The Hidden Limiters

Handle chrome and sulphide well, and three quieter problems still cap what your biological system can deliver.

High TDS and osmotic stress

Hide-curing salt, pickling and neutralisation chemicals push tannery TDS well beyond what conventional activated sludge cultures tolerate. Cells lose water, activity drops and floc disperses.

Swinging salinity is worse than steady salinity. Microbes adapt to a stable level, not to constant jumps. Biology also doesn’t remove TDS, so high TDS wastewater is a limit you manage through segregation, dilution strategy and reject handling.

Proteinaceous solids and slow hydrolysis

Fleshings, hair pulp and trimmings are protein-rich and break down slowly. Without cultures that produce active proteases in saline, alkaline conditions, solids accumulate and COD stays stubborn. Your anaerobic unit then ends up overloaded with partly hydrolysed material.

Ammoniacal nitrogen and sensitive nitrifiers

Protein breakdown releases ammoniacal nitrogen, and deliming salts add more. Nitrifiers are slow-growing autotrophs and the first to suffer from chrome, sulphide and salt.

When nitrification fails, ammonia goes straight to your outlet report. Nitrifiers need adequate alkalinity, steady oxygen (dissolved oxygen typically in the range of 2 to 4 mg/L), and a long enough sludge age to hold on. As always, those ranges are general values and vary from ETP to ETP.

Untreated Stream ProblemPre-Treatment FixBiological Support
Chrome carryover from tanyardSegregation, recovery and precipitationChromium-resistant consortia for trace residuals
Sulphide shock from beamhouseSegregation and catalytic oxidationCultures that recover fast after oxygen dips
High and swinging TDSEqualisation, dilution and reject managementHalotolerant bacteria
Slow-hydrolysing proteinsScreening and fines removalProtease-active cultures
Ammoniacal nitrogen build-uppH and alkalinity controlAutotrophic nitrifying cultures

CPCB and SPCB Discharge Norms: What Non-Compliance Really Costs

Your consent conditions set the finish line, and for tanneries they’re tight. CPCB and the state boards regulate chromium, sulphides, ammoniacal nitrogen, BOD and COD, and the limits sit in the stringent low mg/L range. Chromium and sulphide are often held in the single-digit mg/L range or lower.

The exact figures depend on your state, your cluster and whether you discharge to a CETP, land or a water body. Check your current consent conditions rather than relying on any article, this one included.

Failing them carries consequences well beyond a bad lab report:

  • Environmental toxicity: chromium and sulphide harm aquatic life and soil microbes
  • Groundwater contamination: saline, chrome-bearing seepage from lagoons and drains is slow and costly to reverse
  • CETP penalties and over-fee charges: many CETPs levy extra charges on members whose inlet quality exceeds agreed limits
  • Closure directions: repeated violations can escalate from notices to closure directions for the unit or plant

Every one of these starts upstream. A stable biological unit is the cheapest compliance margin you’ll ever own.

How Biocultures Stabilise Aerobic and Anaerobic Units

Pre-treatment lowers the shock. Biology handles what’s left. That’s where bioaugmentation earns its place, as a stabiliser and not a substitute for good housekeeping.

Halotolerant, chromium-resistant consortia

Strains selected from saline and metal-exposed environments keep working when TDS rises and trace Cr3+ gets past your recovery step. They help hold the floc together and keep BOD and COD reduction going. They give the system a stable core population that doesn’t collapse at every swing.

Autotrophic nitrifying cultures

Nitrifiers convert ammoniacal nitrogen to nitrite and then nitrate. Because they grow slowly, a washout can take weeks to recover from on its own. Seeding with dedicated nitrifying bacteria for ammonia removal can shorten that recovery and protect your ammoniacal nitrogen compliance. Results depend on the site, and they’re never guaranteed.

Handling aerobic and anaerobic units correctly

In the aerobic tank, keep MLSS, oxygen and pH inside a workable window instead of chasing extremes. In the anaerobic unit, keep unoxidised sulphide out, since it inhibits methanogens, and keep pH and alkalinity steady.

Sulphate left after sulphide oxidation can still be reduced back to sulphide in anaerobic zones. That’s why oxidation and segregation upstream matter so much.

Recovery after shock loads

When a shock does hit, waiting for natural regrowth costs you days of non-compliance. A well-chosen bioculture for ETP and CETP re-seeds the system with active, tolerant cells, so recovery is quicker than it would be on its own.

Practical benefits you can expect to see:

  • Faster recovery after chrome, sulphide or salinity shocks
  • Steadier BOD and COD reduction through load swings
  • Lower sludge handling stress through better floc and hydrolysis
  • A wider compliance margin on ammoniacal nitrogen and COD

Is your biological unit losing ground to chrome or sulphide shocks? Talk to the Team One Biotech technical team for a site-specific assessment of your ETP. Explore our bioremediation solutions for industrial effluent or contact our technical team.

A Practical Stabilisation Checklist for Leather Industry ETP and CETP Teams

Disclaimer: The values and ranges mentioned in this article are general figures for reference. Actual values differ in every ETP depending on process, chemicals, hide type, water source and local consent conditions. Always validate through lab analysis and a site-specific trial.

Use this as a working list for your next review meeting:

  • Segregate streams at source. Keep beamhouse, tanyard and acidic flows separate so toxic liquors never mix.
  • Equalise properly. Give the plant enough mixing and buffering to flatten daily swings in pH, salinity and load.
  • Recover chrome. Collect spent liquor, precipitate, settle and reuse or dispose of it as per your regulations.
  • Oxidise sulphides. Treat beamhouse liquor through catalytic oxidation before it joins the main flow.
  • Check pH and dissolved oxygen. Track both at the equalisation tank and aeration tank, at least once every shift.
  • Seed with the right cultures. Use halotolerant, chromium-resistant and nitrifying cultures matched to your effluent.
  • Monitor closely. Follow oxygen uptake, floc quality, ammoniacal nitrogen and sludge settling, not only the outlet report.
  • Document everything. Log shocks, dosing and recoveries so you can show boards and management what happened and why.

Ready to put this into practice? Request a bioculture trial plan and sample analysis support from our process team, and we’ll help you set up a site-specific trial.

Frequently Asked Questions

Why does my aeration tank fail after chrome or sulphide shocks?

Chrome inhibits enzymes and floc formation, while sulphide poisons microbes and strips dissolved oxygen. Together they can collapse activity within hours, especially in unsegregated plants. Recovery takes longer when nitrifiers are lost.

Can biocultures work in high-TDS tannery effluent?

Yes, if they’re halotolerant strains selected for saline conditions. Conventional cultures lose activity as salinity climbs and swings. Results depend on your TDS range, stability and pre-treatment, so a site trial is the right way to confirm.

Is chrome recovery necessary if my ETP is already biological?

In most cases, yes. Biology can only handle trace chromium. Recovery and precipitation take the bulk away before it harms your culture and loads your sludge.

How do I improve ammoniacal nitrogen removal in a leather CETP?

Protect nitrifiers from chrome, sulphide and salinity shocks first. Then keep alkalinity, dissolved oxygen and sludge age in a supportive range, and consider seeding with autotrophic nitrifying cultures. Ranges vary from ETP to ETP.

Protect Your Plant Before the Next Shock Load Arrives

Reliable tannery effluent treatment comes down to sequence. Segregate at source, recover chrome, oxidise sulphide, then give your biology halotolerant, chromium-resistant and nitrifying cultures that can survive what’s left. Treat your leather industry ETP that way and chrome wastewater stops being a threat to your discharge report.

Do not wait for a failed discharge report or a closure notice. Contact Team One Biotech today to design a biological stabilisation plan for your tannery or CETP. Book a technical consultation, request a site assessment, or speak to our process team.

Disclaimer: The values and ranges mentioned in this article are general figures for reference. Actual values differ in every ETP depending on process, chemicals, hide type, water source and local consent conditions. Always validate through lab analysis and a site-specific trial.

Looking to improve your ETP/STP efficiency with the right bioculture?
Talk to our experts at Team One Biotech for customised microbial solutions.

Contact: +91 8855050575

Email:  sales@teamonebiotech.com

Visit: www.teamonebiotech.com

Discover More on YouTube – Watch our latest insights & innovations!-

Connect with Us on LinkedIn – Stay updated with expert content & trends!

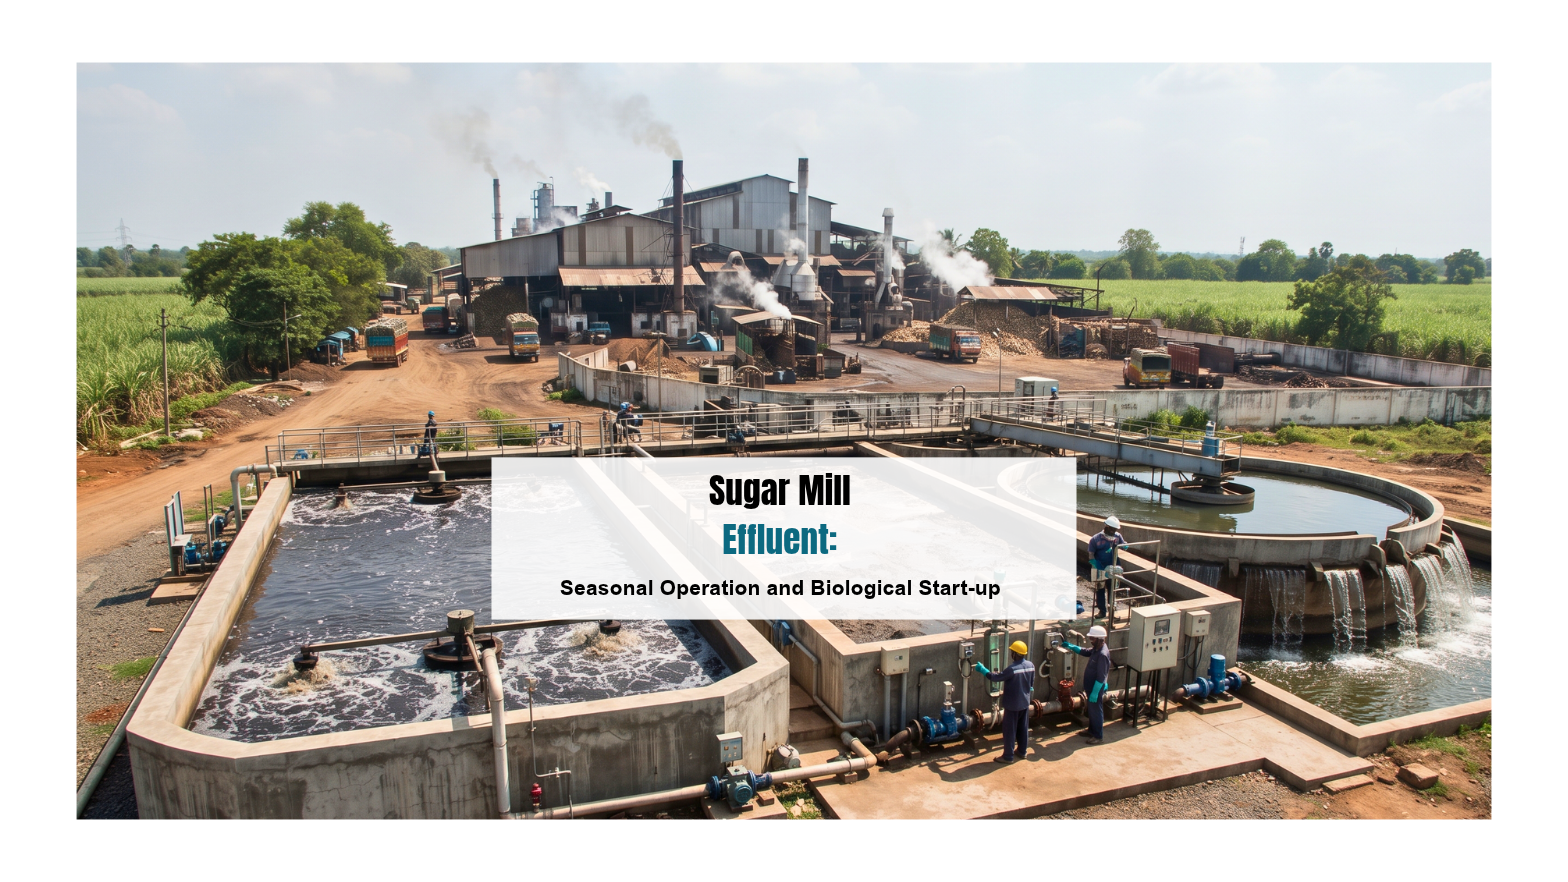
Sugar Mill Effluent: Seasonal Operation and Biological Start-up

The crushing season is days away. The cane yard is filling, the boilers are being lit, and the mill is coming back to life. Down at the effluent plant, the aeration basin has sat still for months. The surface is dull, the walls are crusted, and nobody is quite sure what’s living in the bottom layer.

If you run the ETP, you already know what’s coming. The first week of effluent will test the biology and your compliance record at the same time. You can almost smell the complaints: a septic odour drifting towards the nearest village, a phone call from the board, an inspection at the worst possible moment. Then there’s the fear every ETP manager carries, a washout on the first day, with the basin turning sour before the biomass has a chance to establish.

This article is about getting through that moment. We’ll look at why sugar mill effluent treatment behaves so differently from other industries, where a sugar industry ETP usually stumbles at start-up, and how a structured biological start-up protocol can get a dormant basin working reliably, without weeks of anxious waiting.

A note before we begin: wherever we give numbers in this article, they are ranges and general values. They will differ from ETP to ETP depending on design, load, and site conditions.

Why Sugar Mill Effluent Treatment Is Different From Other Industries

Why Sugar Mill Effluent Treatment Is Different From Other Industries

Most industrial plants discharge effluent at a fairly steady rate all year. A sugar mill doesn’t. It runs hard for the length of the crushing season, then goes quiet for the long off-season. Your ETP has to wake up from near-zero activity and take a full load almost immediately. That’s the first thing that sets sugar mill wastewater treatment apart.

Seasonal swings are extreme

During the off-season, the biomass in the basin starves, dies off, or turns dormant. When crushing begins, effluent arrives in volume, and there is no gentle ramp-up on the mill side. The cane doesn’t wait for your biology.

The organic load moves constantly

Even within the season, high BOD COD effluent is the norm, and it doesn’t arrive evenly. The main contributors include:

  • Juice spillage and leakage from the extraction and clarification area
  • Floor and equipment washings, which can spike sharply during cleaning shifts
  • Barometric condenser water, which carries sugars and organics when entrainment occurs
  • Press mud contact wastewater, rich in dissolved and suspended organics

Any one of these can push a sudden seasonal shock load into the basin. In a mill where several things go wrong in the same shift, the combined load can be several times the usual level.

Plenty of carbon, almost no nitrogen or phosphorus

Sugar effluent is mostly sugars, which means carbon. What it lacks is nitrogen and phosphorus, the nutrients bacteria need to build new cells. Without proper N:P nutrient balancing, the biomass can’t grow in step with the load. You end up with weak, slimy, poorly settling sludge, or no real growth at all.

Anaerobic acidification happens fast

Sugars ferment quickly. If effluent sits in the equalisation tank or arrives in a basin without enough active biomass and oxygen, anaerobic acidification sets in. Volatile fatty acids build up and pH drops. That stresses whatever biomass is present, and the characteristic sour, septic smell follows. Once the basin has gone acidic, recovery is slow and painful.

Put these four problems together and you can see why a generic start-up approach fails here. Treating this as ordinary industrial wastewater is how most start-up trouble begins.

The Compliance Clock Starts on Day One of Crushing

The Compliance Clock Starts on Day One of Crushing

Here’s the uncomfortable reality. Regulators don’t give sugar mills a grace period for biological stabilisation. Your consent conditions apply from the first day effluent leaves the plant, and many mills also operate under Zero Liquid Discharge expectations for the sugar mill and its associated units.

In general terms, the CPCB SPCB discharge norms and your state’s consent conditions expect treated effluent to meet specified limits for parameters such as BOD, COD, suspended solids, and pH. Because limits and conditions vary by state, unit, and consent, we won’t quote values here. Please check your current consent to operate and any recent directions issued to your unit.

What happens when the early season goes wrong?

  • Biological washout, where the biomass is flushed or killed before it can establish, and the basin has to be re-seeded from scratch
  • Foul septic odour, which is often the first thing neighbours and local officials notice
  • Statutory penalties and environmental compensation
  • Show-cause notices, and in serious or repeated cases, closure directions

None of this is theoretical. A few bad days at the start of the season can leave a mark on a compliance record for the whole year, and it takes weeks of good performance to rebuild trust with the board.

Don’t let the first week of crushing decide your compliance record. If you’d like a second pair of eyes on your basin before the season begins, talk to the Team One Biotech technical team about a pre-season ETP assessment. It’s far easier to fix readiness issues in the off-season than during a washout.

Where Sugar Industry ETP Start-ups Usually Go Wrong

Where Sugar Industry ETP Start-ups Usually Go Wrong

After enough seasons, the same mistakes show up again and again. Most of them come from reasonable assumptions that don’t hold in a sugar effluent system.

  • Waiting for the effluent to “seed itself.” Some plants fill the basin and hope the incoming wastewater carries enough microbes to get going. It might, eventually. But sugar effluent acidifies faster than a natural population can establish, so the basin often sours before the right organisms take hold.
  • Relying only on old sludge or cow dung seeding. These are familiar, and they do provide some biomass. But old sludge from a long-idle basin is often weak and mixed in quality, and cow dung is a general-purpose seed that isn’t selected for high-carbon sugar wastewater. Both can work as part of a plan. On their own, they’re unreliable.
  • Ignoring nutrient dosing. This one is common. The basin is full, the aerators are running, and the biomass still doesn’t thrive, because there isn’t enough nitrogen and phosphorus to support growth against the carbon load.
  • Loading the basin too fast. The mill is running, the pressure is on, and the full effluent flow goes in before the biomass is ready. A young culture can’t handle a full load, and the result is a crash.
  • Skipping the pre-season inspection. Choked diffusers, damaged aerators, silted channels, and blocked lines turn up at the worst moment if nobody has checked them earlier.

Does any of this sound familiar? If so, you’re in good company. The good news is that each of these has a practical fix.

A Structured Biological Start-up Protocol That Works

A Structured Biological Start-up Protocol That Works

A good biological start-up protocol isn’t complicated. It’s disciplined. Each step prepares the ground for the next, and skipping one tends to cost more time than it saves.

Step 1: Pre-season basin readiness

Start well before the first cane is crushed. Walk the entire treatment train and check:

  • Aeration system: diffusers, blowers, surface aerators, and air lines for fouling, damage, and uniform mixing
  • Basin condition: accumulated sludge, grit, scum, and any dead zones that won’t mix
  • Equalisation and buffer tanks: capacity, mixing, and condition, since these protect the basin from sudden spikes
  • Pumps, valves, and flow measurement: you can’t control a load ramp-up you can’t measure
  • Dosing systems: nutrient and bioculture dosing points should be ready and calibrated
  • Lab readiness: meters for pH and DO, tools for SV30 and MLSS, and a microscope if available

Fix what’s broken now. A failed aerator in the first week of crushing is a problem you can avoid entirely.

Step 2: Rapid-activation bioaugmentation

This is where bioaugmentation for sugar industry effluent earns its place. Instead of waiting for a suitable population to develop on its own, you introduce a specialised microbial consortium selected to work on high-carbon, sugar-rich wastewater.

A well-matched consortium helps in three ways:

  • It establishes quickly, shortening the usual stabilisation period
  • It handles sugars and organic acids efficiently, which reduces the risk of acidification
  • It builds a stable, well-settling floc instead of weak, slimy growth

The consortium is typically dosed during the initial charging of the basin and then maintained at a lower level through the early weeks. Dosing rates depend on basin volume, available seed, and expected load, so they should be worked out with your technical team rather than copied from another plant.

Many mills find that combining bioaugmentation with a small amount of good-quality seed sludge gives the best result. The sludge provides biomass and the consortium provides the targeted capability.

Step 3: N:P balancing

Because sugar effluent is so carbon-rich, nutrient dosing is not optional. The aim is to keep nitrogen and phosphorus available in a proportion that matches the incoming organic load, so the biomass can grow and not merely survive.

In practice, N:P ratios are commonly targeted within a defined range relative to the BOD load, and the exact figures depend on your effluent characteristics and treatment configuration. Typical nutrient sources include urea or ammonium compounds for nitrogen and phosphate salts for phosphorus.

A few practical points:

  • Dose based on measured load, not a fixed routine
  • Check residual nutrients in the treated water, since too little starves the biomass and too much wastes money and adds to downstream load
  • Adjust as the load changes through the season

As always, ratios and doses are general and will differ from ETP to ETP depending on design, load, and site conditions.

Step 4: Controlled load ramp-up

Patience here pays off. Rather than sending the full flow in on day one, bring the load up in stages while the biomass builds.

  • Begin with a fraction of the design load, often somewhere in the range of a quarter to a half
  • Increase in steps once the basin shows stable pH, healthy DO, and improving settling
  • Use equalisation to smooth out peaks while the culture is still young
  • Expect a stabilisation period of roughly 5 to 10 days for many plants, though some settle sooner and some take longer

If the mill can divert or hold back the strongest streams, such as concentrated washings, during the first days, that helps considerably. A short conversation between the ETP team and the process team before start-up is worth more than most people expect.

These figures are general. Your own ramp-up schedule should reflect your design and the condition of your basin.

Step 5: Monitoring and shock load buffering

Once the basin is running, monitoring tells you whether the biology is healthy. Check these regularly during stabilisation, and more often when the load is changing:

  • pH: typically maintained between 6.5 and 8.0, with early warning of acidification if it begins to fall
  • Dissolved oxygen (DO): enough in the aeration basin to support aerobic activity throughout, with attention to dead zones
  • MLSS: a measure of how much biomass you’re carrying, expected to build steadily through start-up
  • SV30: a quick settling test that reveals sludge quality, with trends more useful than single readings
  • F/M ratio: keeps the food-to-microorganism balance within a workable range as load increases
  • Microscopic observation: healthy floc, active protozoa, and filament levels tell you things no meter can

Microscopy is often the first place trouble shows. A change in the microbial picture can appear a day or two before parameters shift, which gives you time to act.

For the rest of the campaign, plan for shocks. Maintain a bioculture top-up dose during the season, keep the equalisation tank mixed and in use, watch the weak points in the mill that generate spills, and have a response plan ready when pH starts to drop. A basin with a healthy, well-fed population recovers from a shock load far faster than one running on the edge.

Ranges for pH, DO, MLSS, and F/M are general guidance. Your own targets should be set from your ETP’s design and operating history.

Ready to plan your own start-up? Contact Team One Biotech to talk through your basin, your expected load, and the timeline to crushing. A short technical discussion now can save you a very long first week.

A Season-Wise Operating Snapshot

Here’s the whole year at a glance. Treat it as a planning aid, not a rulebook.

StageMain focusKey actions
Pre-season (weeks before crushing)ReadinessInspect aerators, diffusers, pumps, and tanks; clean and repair; calibrate dosing and monitoring; plan seed, bioculture, and nutrient supply
Start-up week (first days of crushing)Establish the biologyCharge basin with bioculture and seed; begin N:P dosing; start at a partial load; monitor pH, DO, and SV30 closely; observe under the microscope
Mid-season (stable campaign)Hold and protectRamp to design load as the basin allows; maintain bioculture top-ups; adjust nutrients to load; use equalisation to buffer spikes; track MLSS, F/M, and settling
End-of-season (closing weeks)PreservationReduce load gradually; keep the basin aerated at a low level where possible; avoid abrupt shutdown; remove excess sludge; plan the off-season care

All timelines are approximate and depend on the mill’s crushing schedule and ETP design.

The last stage is one that many plants overlook. How you close the season largely determines how easy next season’s start-up will be. A basin that is gently wound down and kept in reasonable condition is far easier to revive than one abandoned to rot over the off-season.

How Team One Biotech Supports Your Crushing Season Start-up

We make bioremediation solutions, and we work with plants that face exactly these problems every year. Our approach is practical. We’d rather help you avoid a crisis than rescue you from one.

Here’s what that support looks like:

  • Bioremediation solutions for sugar effluent: microbial products suited to high-carbon wastewater, applied through bioaugmentation as part of a planned start-up
  • Technical guidance on commissioning or reviving dormant aeration basins, from readiness checks through load ramp-up
  • Help with nutrient planning so your N:P balance matches your actual load
  • Advice on shock load management during the campaign, including what to do when pH or odour trends go the wrong way
  • Site-level discussion, because no two plants are alike, and what works at one mill may need adjusting at another

The goal is simple: to bring your aeration basin revival forward so you aren’t left waiting through a long, uncertain stabilisation period or watching a crash unfold. For ETP start-up for sugar mills, speed matters, but reliability matters more.

If your plant also includes a distillery, co-generation unit, or other linked processes, we can look at the full picture, because effluent streams from these units affect each other.

Frequently Asked Questions

How long does a sugar industry ETP take to stabilise at the start of the season?

It varies with design, seed quality, temperature, and how carefully the load is ramped. Many plants stabilise in roughly 5 to 10 days when bioaugmentation, nutrient balancing, and staged loading are done properly. Plants relying on natural seeding often take longer. These are general ranges and differ from site to site.

Is cow dung or old sludge enough to start a sugar mill ETP?

They can supply some biomass, but they rarely deliver the speed or consistency needed for sugar effluent. The organisms in them aren’t selected for high-carbon wastewater, and old sludge is often weak. Most plants get better results combining seed with a targeted microbial consortium and proper nutrient dosing.

Why is nutrient dosing so important in sugar mill wastewater treatment?

Sugar effluent is rich in carbon but short on nitrogen and phosphorus. Without enough of both, biomass can’t grow properly, settling suffers, and treatment efficiency drops. Nutrient dosing based on measured load keeps the biology healthy and helps the plant meet its consent conditions throughout the campaign.

What causes foul odour in a sugar mill ETP?

Mostly anaerobic acidification. Sugars ferment quickly when oxygen or active biomass is short, producing volatile acids and sulphide compounds that smell sour and septic. Common triggers include sudden shock loads, weak biomass, poor mixing, and equalisation tanks left standing. Good aeration, buffering, and active bioculture usually bring it under control.

Can a dormant aeration basin be revived quickly before crushing?

Yes, in most cases, provided the mechanical equipment is sound. Revival usually involves clearing accumulated solids, checking aeration, charging the basin with a suitable microbial consortium and seed, dosing nutrients, and ramping up load in stages. Starting preparation well before crushing gives the best outcome.

Plan the Start-up Before the Cane Arrives

The first week of crushing is where a sugar mill’s effluent record is quietly decided. A dormant basin, a carbon-heavy load, missing nutrients, and fast-souring effluent are a hard combination to meet without preparation. With a structured start-up, though, it’s a very manageable one.

To recap the essentials of good sugar mill effluent treatment:

  • Inspect and repair before the season, not during it
  • Introduce a suitable microbial consortium instead of waiting for natural seeding
  • Balance nitrogen and phosphorus against the carbon load
  • Ramp up gradually and watch the biology closely
  • Buffer shocks and wind the season down with next year in mind

A dependable sugar industry ETP is built in the weeks before crushing begins. Book a pre-season ETP assessment with Team One Biotech before the crushing starts. Call or write to our technical team, share your basin details and expected load, and plan your biological start-up now. Don’t let the first week decide your compliance record.

Disclaimer: The values, ranges, and timelines mentioned in this article are general in nature. Actual figures vary from one ETP to another based on design, effluent characteristics, seasonal load, and operating conditions. Please consult our technical team for a site-specific assessment.

Looking to improve your ETP/STP efficiency with the right bioculture?
Talk to our experts at Team One Biotech for customised microbial solutions.

Contact: +91 8855050575

Email:  sales@teamonebiotech.com

Visit: www.teamonebiotech.com

Discover More on YouTube – Watch our latest insights & innovations!-

Connect with Us on LinkedIn – Stay updated with expert content & trends!

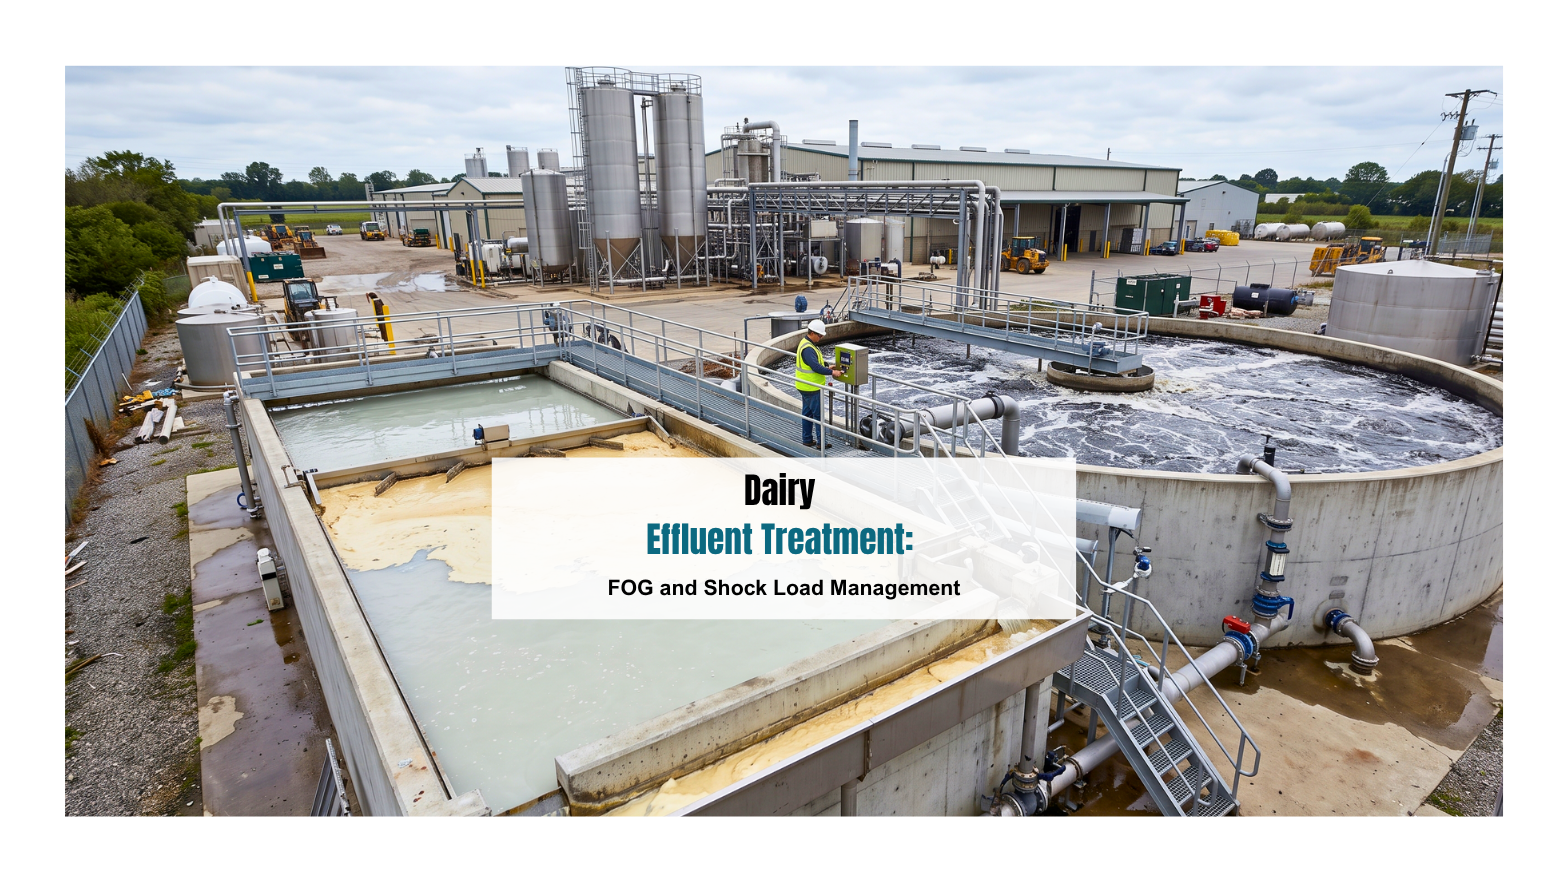
Dairy Effluent Treatment: FOG and Shock Load Management

It is Monday morning, and you have barely parked the car. You walk over to the aeration tank and there it is: a thick, greasy scum layer sitting on the surface, grey and stubborn. A sour smell is drifting toward the plant gate. Before you reach your desk, the phone rings. The environment officer wants to know what happened over the weekend. If that scene feels uncomfortably familiar, you are not alone.

Almost every ETP manager in a dairy has lived some version of this morning. The cause is rarely one big failure. It is usually a quiet build-up of fats, a cleaning cycle that dumped a sudden load, and a biomass that simply could not keep up.

Dairy effluent treatment is hard because the wastewater changes character through the day, and fats do not behave like ordinary organic matter. This article walks you through what really happens inside your dairy ETP, why FOG and shock loads cause so much trouble, and how lipolytic biocultures, enzymatic pre-treatment and biological equalization can bring your system back under control. We will also cover what your team can do this week, before a single product is dosed.

Why Milk Processing Wastewater Is One of the Toughest Streams to Treat

Why Milk Processing Wastewater Is One of the Toughest Streams to Treat

Milk is food. That is the root of the problem. Every drop that reaches the drain carries lactose, proteins and fat, all easy meals for bacteria. The result is milk processing wastewater with an organic strength far above most domestic and many industrial streams. Raw BOD and COD commonly sit in the thousands of mg/L.

Strength is only half the story. Variation is the real enemy. A cheese plant, a butter line and an ice cream unit each produce different effluent, and even inside one plant the stream changes by shift, by product and by season. Peak milk season brings more volume and more whey. Hot weather brings warmer effluent that sours faster.

Then come the cleaning chemicals. Caustic washes and acid rinses from CIP systems push the pH well outside the comfortable range for microbes, which prefer roughly 6.5 to 8.5. Add sanitisers and detergents, and you have a stream that feeds your bacteria and stresses them at the same time.

Note: These are general values. Actual figures vary from one ETP to another depending on product mix, plant design, cleaning practices and operating conditions.

Dairy wastewater is not just strong. It is strong, changeable and chemically unpredictable, and your treatment plan has to respect all three.

Understanding FOG in Dairy Effluent: What Really Happens Inside Your ETP

Understanding FOG in Dairy Effluent: What Really Happens Inside Your ETP

How fats turn into LCFAs and why they inhibit biomass

Milk fat is made of triglycerides: three fatty acid chains attached to a glycerol backbone. Bacteria cannot swallow that whole molecule. They first need enzymes called lipases to cut the chains loose. Once that happens, you get glycerol, which is easy to digest, and long-chain fatty acids, or LCFAs, which are not.

Here is where plants get caught. When fats arrive faster than the biomass can process them, LCFAs accumulate. At high concentrations they coat bacterial cell walls and interfere with how cells take in food and oxygen. Picture a thin oily film over every microbe in your tank. Activity slows, treatment efficiency drops, and the fat that should have been consumed floats to the top instead.

Cold effluent makes it worse. Fats solidify, stick together and travel through the system as lumps rather than fine droplets that bacteria can reach.

Scum, clogged diffusers, foul odor and filamentous growth: the chain reaction

Once fats collect, a chain reaction begins. It usually runs in this order:

  • Fats float and form a scum layer in the equalization tank and aeration basin.
  • Grease coats diffuser membranes and pipework, cutting oxygen transfer.
  • Dissolved oxygen falls in pockets of the tank, and anaerobic zones appear.
  • Those zones release sour, rotten odors from volatile fatty acids and sulfur compounds.
  • Filamentous bacteria, which thrive on low oxygen and fatty food, take over and cause sludge bulking.
  • Sludge settles poorly in the clarifier, solids carry over, and TSS, BOD and oil and grease in the final discharge climb.

Every step feeds the next. That is why chasing odor alone, with masking agents or extra chemicals, rarely works. You have to break the chain where it starts, at the point where fat enters.

Scum, odor and bulking are usually one problem seen from three angles. Control the FOG, and the other two often ease.

Shock Loads and pH Swings: The Silent Killers of Your Aeration Basin

Common shock load sources inside a dairy plant

A shock load is any sudden jump in organic strength, flow or pH that your biomass has not had time to adapt to. In dairy plants, the usual suspects are:

  • CIP cycles, especially when pre-rinse and final rinse streams go straight to the drain
  • Product changeovers that flush concentrated residues out of pipelines and tanks
  • Whey or buttermilk spills, and rejected batches sent to drain instead of being collected
  • Batch dumping of expired, returned or off-spec product
  • Shift-end washdowns, when several sections discharge together
  • Fat-heavy cleaning from butter, cheese vat and ice cream lines

Most of these are not failures. They are normal operations. The problem is timing. Everything arrives together, and your ETP sees it as one big gulp.

What a shock does to the microbial population

Your aeration basin is a living community. The bacteria in it need steady food, steady oxygen and a steady pH. A sudden organic surge makes them consume oxygen faster than your blowers can supply it. Dissolved oxygen collapses, sensitive species die back, and the survivors tend to be the filamentous ones that cope better with low oxygen.

A pH swing does similar damage in a different way. A strong caustic slug can rupture cells outright, while an acid slug favours fungi and filaments over healthy flocs. Recovery is slow because the community has to rebuild, and rebuilding takes days to weeks while your discharge keeps going to the regulator.

The signs are familiar: rising foam, brown or grey scum, cloudy supernatant, poor settling and a sharp smell. If your microscope also shows fewer protozoa and more filaments, shock has already done its work.

Note: These are general values. Actual figures vary from one ETP to another depending on product mix, plant design, cleaning practices and operating conditions.

Aeration basin stability depends on predictability. Shock management is really about making your load and pH arrive in a way your biomass can handle.

Struggling with recurring scum or sudden BOD spikes? Talk to the Team One Biotech technical team about a site-specific assessment of your dairy ETP.

The Biological Approach to Dairy ETP Management

The Biological Approach to Dairy ETP Management

A biological approach does not mean doing nothing and hoping. It means giving your biomass the tools to handle fats and fluctuations, and the conditions to do its job. Three tools carry most of the weight.

Lipolytic biocultures for FOG breakdown

Lipolytic biocultures are selected bacterial strains that produce lipases and can break down fats, oils and grease. Dosed at the right point, they establish themselves in the system, attack the scum layer and stop fat from building up again. Because they work on the triglycerides and also help consume the LCFAs that follow, they deal with the inhibition problem at both ends.

Results depend on choosing cultures that tolerate the real conditions of your plant: fluctuating pH, variable temperature and traces of cleaning chemicals. A culture that performs well in a lab can struggle in a working dairy ETP. That is why site-specific selection matters, and why dosing should be steady rather than occasional. Many plants see visible improvement in scum and odor within a few weeks of consistent dosing, though this varies.

This is the heart of bioremediation for ETP: use living microbes to do what chemicals only partly achieve, without adding to your sludge.

Enzymatic pre-treatment to open up fats before they reach the aeration tank

Enzymes are the fast starters. Lipase-based formulations dosed in the grease trap, collection sump or equalization tank begin splitting fats before they ever reach the aeration basin. Fats that are already opened up are easier for bacteria to take in and less likely to form floating mats.

Think of it this way. Enzymes cut the big pieces, and biocultures eat the smaller ones. Together they shorten the path from stubborn fat to digestible material. Contact time matters, so dose where there is enough retention for the enzymes to act and where temperature and pH are reasonably favourable.

Enzymatic pre-treatment also helps keep sewer lines, pumps and screens cleaner. That means fewer blockages and less foul odor around the collection area.

Biological equalization to buffer load and pH

An equalization tank is where you flatten the peaks. In many plants it is treated as a simple holding tank, but it can do far more. When it is mixed, gently aerated and seeded with the right cultures, it becomes a first biological stage that starts consuming easily degradable load and buffers the pH before the stream reaches the main reactor.

The benefits add up:

  • Flow and load reach the aeration basin at a steadier rate, so the biomass is never surprised.
  • Caustic and acid streams from CIP partly neutralise each other, narrowing pH swings.
  • Fats are partially degraded, which reduces scum at the next stage.

Keep the tank mixed enough to avoid settling and septic conditions, but not so hard that you create foam. A pH range of roughly 6.5 to 8.5 at the equalization outlet is a practical target.

Note: These are general values. Actual figures vary from one ETP to another depending on product mix, plant design, cleaning practices and operating conditions.

Biocultures do the long-term work, enzymes give a head start, and equalization protects both from the worst of your load swings.

Operational Best Practices Your Team Can Start This Week

Operational Best Practices Your Team Can Start This Week

None of these need a capital project. Your team can begin today.

  • Grease trap upkeep: Inspect and clean traps on a fixed schedule rather than after they overflow. Remove fat solids by hand and never wash them down the drain.
  • Flow equalization: Spread discharges across the day where possible. Use the equalization tank as a true buffer and avoid bypassing it during cleaning or spills.
  • CIP scheduling coordination: Sit down with production and sanitation teams. Stagger CIP cycles so caustic, acid and rinse streams do not hit the ETP together, and collect first rinses for separate handling.
  • DO and MLSS monitoring: Check dissolved oxygen at several points in the basin, not just one. Track MLSS and settling behaviour so you spot drift before it becomes a failure.
  • Regular microscopic checks: A simple microscope shows filaments, protozoa and floc structure long before lab results do. Make it a routine, not an emergency tool.
  • Dosing discipline: Biocultures and enzymes work through consistency. Dose at the same points and times, and keep a log. Skipping doses in busy weeks is a common reason for relapse.

Also keep whey, buttermilk and rejected product out of the drain wherever possible. These are worth more as by-products or feed than as effluent, and they are among the biggest single causes of sudden BOD spikes.

A calm ETP is built on small, boring habits done every day.

Compliance Benefits: Staying Ahead of CPCB and SPCB Norms

CPCB and SPCB discharge norms for BOD, COD, oil and grease and TSS leave little room for erratic performance. A plant that meets limits on a good day and misses them on a bad one is still exposed to notices, penalties and, in serious cases, closure directions. Regulators care about consistency, and consistency is where biology does well.

Chemical-heavy approaches can bring quick clarity, but they carry costs. Coagulants and flocculants create chemical sludge that must be handled, stored and disposed of, and that disposal is itself a liability. Chemical use also rises with every spike. In a biological system, much of the organic load is converted into biomass and gas rather than concentrated into chemical sludge.

A biological approach is designed to help support compliance in several ways:

  • It can make BOD and COD reduction steadier by keeping the biomass active and healthy.
  • It helps with oil and grease removal by degrading fats directly instead of just skimming them.
  • It supports better settling, which helps TSS control.
  • It can reduce chemical sludge and the disposal burden attached to it.
  • It helps protect municipal sewers and surface receiving bodies from fat-laden, oxygen-hungry discharge.

Better odor control also protects you from neighbour complaints, which are often what trigger an inspection in the first place. No product can guarantee compliance, and operation, monitoring and housekeeping still matter. But a stable biological system gives you something chemical dosing rarely does: a margin of safety.

Quick Takeaway: Regulators reward steady performance. Biology helps you deliver it without piling up chemical sludge.

Want to know where your plant stands? Request a free consultation to review your current ETP performance against CPCB and SPCB norms.

Frequently Asked Questions

How do you control FOG in dairy wastewater biologically?

Start with good grease trap practice, then add lipolytic biocultures and lipase enzymes at the trap, sump or equalization tank. The enzymes open up the fat and the cultures consume what is left. Steady dosing and good mixing are what make it work.

Why does my dairy ETP smell worse after cleaning cycles?

CIP discharges bring a surge of organic load, fats and sudden pH change. Oxygen demand spikes, anaerobic pockets form, and volatile acids and sulfur compounds are released. Staggering cleaning and buffering in equalization usually reduces this.

How can a dairy ETP handle sudden shock loads?

Buffer first, then biology. A well-mixed equalization tank, coordinated CIP schedules and a robust, regularly dosed culture help the system absorb surges. Watching dissolved oxygen closely also gives you time to react.

Can bioremediation reduce chemical sludge in milk processing wastewater?

Yes, it can. When biology handles more of the organic and fat load, the need for coagulants and flocculants often drops, and so does the sludge they generate. The extent depends on your plant design and current practice.

How long before I see results?

Many plants notice changes in scum and odor within a few weeks of consistent dosing, followed by steadier BOD, COD and oil and grease trends. Timelines depend on loading, temperature and how well the basics are managed.

Bringing Your Dairy ETP Back Under Control

Dairy effluent treatment will never be effortless. Milk processing wastewater is rich, variable and loaded with fats, and your cleaning routines will always create peaks. But a Monday morning with scum, smell and a phone call is not inevitable. When you control FOG at its source, buffer shocks through biological equalization and keep a healthy, well-fed culture working in the aeration basin, your dairy ETP becomes calmer, cheaper to run and far easier to defend in front of a regulator.

Team One Biotech works with milk, cheese, butter and ice cream plants to build site-specific biological programs around lipolytic biocultures and enzymatic solutions. You do not have to guess your way through it..

Your aeration tank can recover. Team One Biotech will help you get there, one stable day at a time.

Disclaimer: The information in this article is for general guidance only. Wastewater characteristics, treatment performance and dosing requirements differ in every ETP. A site-specific assessment is recommended before any process change.

Looking to improve your ETP/STP efficiency with the right bioculture?
Talk to our experts at Team One Biotech for customised microbial solutions.

Contact: +91 8855050575

Email:  sales@teamonebiotech.com

Visit: www.teamonebiotech.com

Discover More on YouTube – Watch our latest insights & innovations!-

Connect with Us on LinkedIn – Stay updated with expert content & trends!
Bioculture Manufacturer vs Trader: How to Tell Who Actually Makes Your Bioculture

You order a bioculture for your ETP, dose it as instructed, and see COD and BOD come down as expected. Three months later you place a repeat order with the same vendor, under the same product name, at the same dosing rate. This time the aeration tank is sluggish, the sludge looks different, and your effluent numbers drift toward the limit.

You call the vendor. The answer is vague. Someone mentions “batch variation,” someone else suggests you increase the dose, and nobody can tell you what changed.

This is more common than most plants admit, and the cause is often not your process. It is your source. A large share of the companies selling bioculture products in India are traders or repackagers, not manufacturers, even when their brochures, websites, and sales pitches suggest otherwise.

The stakes are real. The wrong source can mean inconsistent COD and BOD reduction, unplanned downtime, higher consumption of product to compensate for weak performance, and compliance exposure under CPCB and SPCB norms. The difference between a bioculture for wastewater treatment manufacturer vs supplier is rarely visible on a label.

This guide gives you a practical framework to find out who actually makes your ETP bioculture source, and what to ask before you sign the next purchase order.

Why the Manufacturer vs Trader Distinction Matters More Than You Think

Why the Manufacturer vs Trader Distinction Matters More Than You Think

Procurement teams often treat bioculture as a commodity: same category, same specification sheet, so compare on price and move on. That logic works for chemicals with a fixed composition. It fails for a living product, where the strain, the fermentation conditions, and the handling history decide whether the culture works at all.

The Supply Chain Reality of Bioculture Products in India

Most bioculture products reaching Indian ETPs pass through at least one intermediary. A trader buys microbial consortia in bulk from a domestic or overseas producer, packs or relabels the material under a proprietary brand, and resells it. In many cases, nothing about the product is modified.

That arrangement is not illegal, and some traders are honest about it. The problem is what the buyer loses. A trader has no control over strain consistency, fermentation batch quality, or the storage conditions the product experienced before it reached the warehouse. When the culture underperforms, the trader cannot tell you why, because the trader never made it.

Disclaimer: The supply chain structure described here reflects general industry patterns and may vary significantly depending on product category, geography, and vendor. Buyers are advised to conduct independent verification for each procurement.

What Happens When Your Bioculture Is Repackaged, Not Manufactured

What Happens When Your Bioculture Is Repackaged, Not Manufactured

Four problems show up repeatedly when plants buy repackaged cultures.

Viability erodes before dosing. Microbial cultures are sensitive to temperature, moisture, and time. Every additional handoff, warehouse, and transport leg adds risk that viable cells are lost before the product reaches your dosing point.

The paperwork describes someone else’s batch. The Certificate of Analysis (COA) a repackager supplies usually reflects the original producer’s batch, not necessarily the material in your drums. Lot numbers, testing dates, and even the testing laboratory may not match what you received.

You cannot customise. If your wastewater has high TDS, high salinity, elevated phenols, or heavy surfactant load, you need a consortium built or adjusted for that matrix. A trader sells what is in stock. There is no one to ask for a different microbial ratio.

You have no escalation path. When your ETP results deviate, you need a microbiologist who can look at your influent data and your dosing log. A trader passes your question up the chain to its own supplier, and that adds days to a problem that costs you every hour it continues.

If you have ever received a bioculture that performed inconsistently without explanation, it is worth tracing where it was actually produced. Our technical team can walk you through a vendor audit checklist. Contact our technical team to start.

The 6-Point Verification Framework: Real Manufacturer vs Trader

The 6-Point Verification Framework: Real Manufacturer vs Trader

The framework below is built for plant managers and environmental engineers. Use it as a set of questions to put to any vendor before a purchase order is signed. A genuine manufacturer will answer all six without hesitation. A trader will struggle with most of them.

1. In-House Fermentation Infrastructure

A real bioculture manufacturer operates fermentation vessels, bioreactors, and controlled incubation environments on its own premises. Production is something they do, not something they outsource.

Ask directly: can we visit the production unit? Is the facility registered and open to inspection?

A trader has a warehouse, not a production floor. Evasive answers about the facility location, or a sudden shift to “our partner facility,” tell you what you need to know.

How to verify: Request a facility walk-through, or ask for a third-party facility audit report. Genuine manufacturers treat this as routine, because buyers who ask are the buyers they want to keep.

2. Batch-Level Traceability and COA Authenticity

Every batch from a genuine manufacturing run should carry a unique batch ID that traces to a specific production event. A proper COA lists strain identity, viable count at production, production date, expiry date, and the testing methodology used.

Repackagers typically pass on COAs from the original producer. The tell is in the details: lot numbers that differ from the label on your drum, testing laboratories unrelated to the vendor, and dates that do not line up with your delivery.

How to verify: Ask the supplier to map the batch number on your COA to their own internal production records. A manufacturer can do this in minutes, because it made the batch. A repackager cannot, because the records belong to someone else. This single check addresses batch traceability for bioculture better than any brochure claim.

3. In-House R&D and Microbiology Capability

Real manufacturers employ microbiologists, maintain a culture library, and carry out strain development or enrichment internally. This is what makes technical conversations useful. When you describe your effluent, someone on the other end understands the metabolic pathways involved and can propose a response.

A trader has no in-house R&D function. Their technical knowledge is whatever the original producer’s datasheet says.

How to verify: Ask for a list of in-house scientific personnel and their qualifications. Ask whether the company holds any published or proprietary research on its microbial consortia. You are not looking for a long list of papers, only evidence that the science is done in-house.

4. Custom Strain Formulation for Specific Wastewater Profiles

No two ETPs are identical. COD loads, pH ranges, temperature profiles, and effluent composition differ between a textile unit, a pharmaceutical plant, a food processor, and a municipal STP. Even within one site, influent changes with production schedules and seasons.

A manufacturer can develop or adapt a consortium for your wastewater matrix. A trader offers catalogue products with fixed formulations and has no ability to change them.

Disclaimer: Customisation timelines and technical feasibility vary depending on wastewater complexity and the manufacturer’s existing strain library. Buyers should request a site-specific technical assessment before procurement.

How to verify: Ask what the vendor would change in the formulation for your specific effluent, and why. A manufacturer answers with specifics. A trader answers with a product name.

5. Direct Technical Support and Post-Sale Accountability

When your ETP underperforms, you need a microbiologist, not a salesperson. Real manufacturers provide direct technical support: dosing protocol design, troubleshooting under varied influent conditions, and periodic performance reviews.

Traders escalate to their own supplier, which delays the response and dilutes accountability. When something goes wrong, you have no one to hold responsible, because the trader did not make the product and the producer has no contract with you.

How to verify: Ask who your technical point of contact will be after the sale, and check their credentials. If the answer is the same person who quoted the price, you have your answer.

6. Regulatory Compliance Documentation and Statutory Alignment

Bioculture products used in industrial and municipal ETPs must align with applicable CPCB and SPCB guidelines for biological additives. A genuine manufacturer maintains current statutory documentation, safety data sheets, and the relevant clearances for its own facility and products.

Repackagers often inherit documentation from the original producer, and that documentation may not reflect the product on the label. For a plant that answers to a pollution control board, this gap is a liability. Compliance for a CPCB compliant bioculture depends on the documentation chain being intact from production to your gate.

How to verify: Request all compliance documents and cross-reference the label details against the COA and the statutory filings. Product names, strain descriptions, and manufacturer names should match across every document. Where they do not, ask why before you buy.

Red Flags That Signal You Are Dealing With a Trader, Not a Manufacturer

Red Flags That Signal You Are Dealing With a Trader, Not a Manufacturer

Some warning signs show up before you ever request an audit. If several of these apply to your current vendor, a closer look is overdue.

  • They cannot provide a facility address, or they resist a site visit request.
  • Their COA batch numbers do not align with their own dispatch records.
  • They offer every product category with no specialisation in microbiology.
  • Pricing fluctuates significantly between orders without a clear explanation.
  • Their technical team amounts to the sales team.
  • Product labels describe microbial content in vague terms, with no strain identification.
  • They cannot explain why their product suits your specific effluent type.
  • Lead times change unexpectedly, which often signals dependence on a third-party producer.

A bioculture repackager rarely shows all of these at once. One or two is enough to justify a deeper review.

Do not wait for a compliance failure to trigger a vendor review. Download our Bioculture Vendor Verification Checklist, or speak directly with our technical team to audit your current supply source before your next procurement cycle.

Manufacturer vs Trader at a Glance

CriteriaReal ManufacturerTrader / Repackager
Production facilityIn-house fermentation and incubation, open to inspectionWarehouse or storage only
Batch traceabilityBatch ID maps to own production recordsCOA reflects original producer’s batch
R&D capabilityDedicated microbiologists and culture libraryNone; sells available stock
CustomisationFormulation adapted to your effluentFixed catalogue products
Technical supportDirect access to microbiology teamEscalates to upstream supplier
Compliance documentationOwns the full documentation chainInherits documents that may not match the label
Consistency across ordersControlled by one production processVaries with sourcing from different producers

Why Procurement Heads and Plant Managers Are Shifting to Direct Manufacturer Relationships

More buying teams now go straight to the source, and the reasons are practical.

Cost over a procurement cycle. Direct sourcing removes the trader’s margin. Over a full cycle, that can reduce your per-unit cost, though the extent depends on product category, volume, and geography.

Batch consistency. With no intermediate handling, repackaging, or storage gap, the product that leaves the fermenter is the product that reaches your dosing tank. That makes performance easier to predict and easier to diagnose when it slips.

Technical alignment. Procurement teams working directly with a manufacturer can co-develop specifications tied to seasonal shifts or load variations in influent quality. That is not possible when the specification belongs to someone two steps removed.

Compliance confidence. A manufacturer owns its documentation from production through dispatch. As regulatory scrutiny on biological additives in effluent treatment increases, documentation integrity has moved from best practice to procurement requirement.

Disclaimer: Cost savings and performance outcomes described here are indicative and based on general industry observations. Actual results depend on plant configuration, influent characteristics, dosing protocols, and operational parameters specific to each ETP or STP.

Frequently Asked Questions

How do I verify that a bioculture supplier is a genuine manufacturer and not a trader?

Ask for three things: a facility visit, batch-traceable COA documentation tied to the supplier’s own production records, and a named technical contact with microbiology credentials. A repackager will be unable to provide all three.

Can a trader provide bioculture products that are compliant with CPCB and SPCB standards?

A trader may carry products that originated from a compliant manufacturer. However, documentation integrity, strain viability, and accountability in case of non-compliance all weaken when an intermediary is involved. Buying from a direct manufacturer removes that layer of risk.

Is customised bioculture formulation available from manufacturers for specific industrial effluents?

Yes. Manufacturers with in-house R&D can design microbial consortia for specific wastewater matrices, including textile effluent, pharmaceutical waste, food processing streams, and high-TDS industrial discharge. Traders cannot offer this service.

What documents should I request before finalising a bioculture procurement decision?

At minimum, request a batch-traceable COA, statutory compliance documentation under applicable CPCB and SPCB guidelines, a Safety Data Sheet, and documentation of the manufacturing facility’s registration or accreditation.

Why do bioculture products from traders sometimes show inconsistent performance across batches?

Traders source from multiple producers depending on availability, pricing, and stock. Each producer may use different strains, fermentation parameters, and quality thresholds. The buyer receives a different product under the same label with each order.

Know Who Is Behind Your Bioculture Before Your ETP Depends on It

The difference between a manufacturer and a trader is not cosmetic. It determines product integrity, the quality of technical support you receive, and how defensible your records are when a regulator asks questions.

You carry real accountability for ETP performance and compliance. The vendor behind your bioculture should carry the same level of accountability, and the six checks in this guide are how you find out whether they do.

Team One Biotech is a manufacturer with in-house fermentation, dedicated microbiology R&D, batch-traceable documentation, and direct technical support. We are not a catalogue company.

At Team One Biotech, we manufacture. We do not resell. Every product we deliver carries full batch traceability, direct technical accountability, and formulations built around real effluent challenges. Contact our technical team today to verify your current bioculture source or to discuss your plant’s specific requirements.

Values are indicative and vary depending on plant configuration, influent characteristics, and operational parameters.

Looking to improve your ETP/STP efficiency with the right bioculture?
Talk to our experts at Team One Biotech for customised microbial solutions.

Contact: +91 8855050575

Email:  sales@teamonebiotech.com

Visit: www.teamonebiotech.com

Discover More on YouTube – Watch our latest insights & innovations!-

Connect with Us on LinkedIn – Stay updated with expert content & trends!
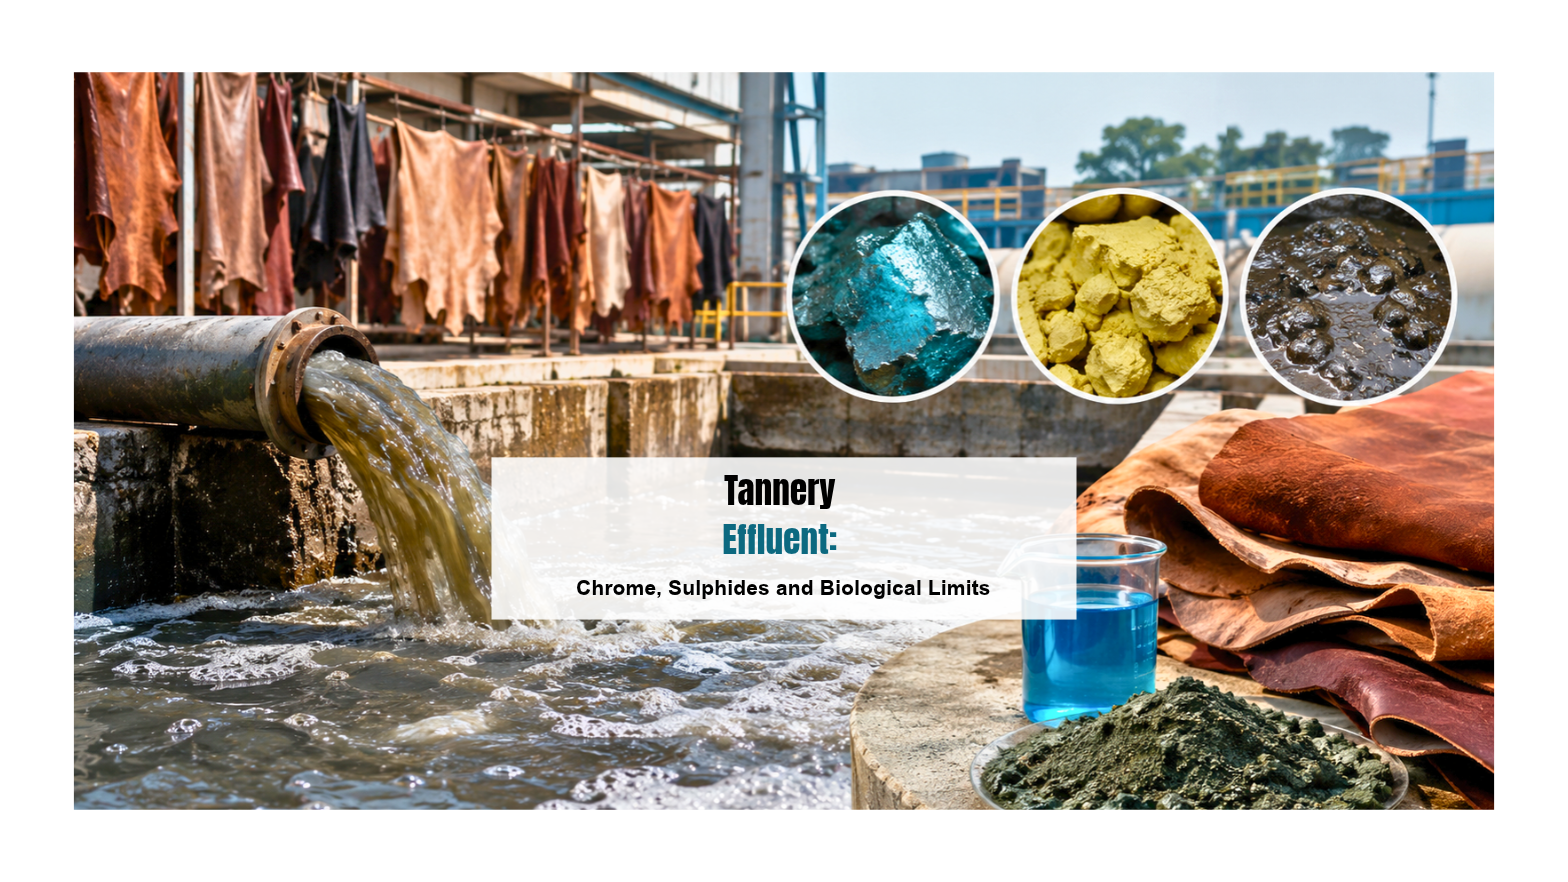
Aerobic vs Anaerobic Wastewater Treatment: Choosing the Right Method

There’s a particular kind of stress that comes with running an effluent treatment plant. It’s not the loud, obvious kind, it’s the quiet dread that builds in the days before a CPCB or SPCB inspection, when you’re not entirely sure your numbers will hold up. It’s the sinking feeling when influent load spikes unexpectedly and you watch your treatment system struggle to keep pace. It’s the budget meeting where someone asks why energy costs keep climbing, and you don’t have a satisfying answer.

If you’re a plant manager, utility head, or process engineer, you already know that the treatment method you choose isn’t just a technical decision, it’s a risk management decision. Pick the wrong system for your load profile, and you’re staring down non-compliance flags, penalty notices, or worse, closure directives. Pick a system that’s technically sound but poorly matched to your space and manpower constraints, and you’re fighting an uphill battle every single day just to keep things running.

This is where the aerobic versus anaerobic wastewater treatment question becomes so important, and so often misunderstood. Both are proven, widely used approaches. Both can deliver compliant discharge quality. But they behave very differently under real-world industrial conditions, and the “right” choice depends heavily on your specific effluent characteristics, available infrastructure, and operational bandwidth.

In this article, we’ll walk through how aerobic sewage treatment and anaerobic wastewater treatment actually work, where each one shines, how they stack up against each other operationally, where an anoxic tank fits into the picture, and how to think through the decision in a way that protects your compliance standing rather than gambling with it. We’ll also touch on the microbiology driving these processes, because understanding what’s actually happening inside your tanks makes troubleshooting, and future-proofing, a lot easier.

Understanding Aerobic Sewage Treatment

Understanding Aerobic Sewage Treatment

Aerobic sewage treatment relies on oxygen-dependent microorganisms to break down organic pollutants in wastewater. Air or pure oxygen is introduced into the treatment tank, through diffusers, surface aerators, or mechanical agitation, creating an environment where aerobic microbes can thrive and metabolize organic matter efficiently. The by-products of this reaction are primarily carbon dioxide, water, and biomass, which is why aerobic systems are generally associated with lower odor generation compared to their anaerobic counterparts.

This method tends to be best suited for effluents with a low-to-moderate organic load, think domestic sewage, or industrial wastewater from sectors like food and beverage, textiles, or light manufacturing, where the organic strength isn’t extreme but consistency and speed of treatment matter.

Energy and aeration considerations:

  • Aerobic systems generally require a continuous or near-continuous supply of oxygen, which translates to a meaningful and ongoing energy demand, a real concern given how energy tariffs have been trending upward across most industrial zones.
  • Aeration equipment (blowers, diffusers, surface aerators) needs regular maintenance, and any inefficiency here directly inflates operating costs.
  • Retention times in aerobic systems tend to fall on the shorter end relative to anaerobic processes, meaning you can often achieve target reductions in a comparatively smaller treatment footprint, a genuine advantage for retrofitted or space-constrained plants.
  • Sludge generation in aerobic systems tends to be higher than in anaerobic systems, which brings its own downstream cost in the form of sludge handling and disposal.

For plants where energy cost isn’t the primary constraint but space and speed of treatment are, aerobic sewage treatment is often the more practical starting point.

Understanding Anaerobic Wastewater Treatment

Understanding Anaerobic Wastewater Treatment

Anaerobic wastewater treatment works in the complete absence of oxygen. Instead of oxygen-breathing microbes, this process relies on anaerobic microbes that break down organic matter through a multi-stage biological pathway, hydrolysis, acidogenesis, acetogenesis, and finally methanogenesis, ultimately producing biogas (a mixture largely composed of methane and carbon dioxide) as a valuable by-product.

This is precisely why anaerobic treatment is often the preferred route for high-strength, high-organic-load effluent, the kind you’d typically see from distilleries, dairies, sugar mills, pulp and paper units, or other sectors where influent BOD and COD levels can vary from moderately high to significantly elevated depending on the process generating the wastewater.

Energy recovery potential vs slower process dynamics:

  • One of the standout advantages of anaerobic treatment is energy recovery. The biogas generated can, in many setups, be captured and used as a fuel source, partially offsetting the plant’s overall energy burden, which is a meaningful counterbalance to rising utility costs.
  • However, anaerobic systems generally operate on longer retention times compared to aerobic systems, since the microbial breakdown pathway is more complex and the organisms involved tend to be slower-growing.
  • Anaerobic microbes are also more sensitive to fluctuations in temperature, pH, and toxic shock loads. A sudden change in influent characteristics can disrupt the microbial balance and take considerably longer to recover from compared to an aerobic system.
  • Odor management is a more prominent consideration here, since by-products like hydrogen sulfide can be generated, meaning that anaerobic systems typically require more robust gas handling and odor control infrastructure.

For plants dealing with consistently high organic loads and looking for a way to offset energy costs through biogas recovery, anaerobic wastewater treatment often makes strong operational and financial sense, provided the system is designed to handle load variability without tipping into instability.

Thinking through whether your influent profile is better suited to aerobic or anaerobic treatment isn’t something you need to work out alone, a plant-specific assessment from Team One Biotech’s bioremediation team can help clarify which direction actually fits your load and infrastructure.

Aerobic and Anaerobic Treatment of Wastewater, Key Operational Differences

Aerobic and Anaerobic Treatment of Wastewater, Key Operational Differences

When you line them up side by side, the aerobic and anaerobic treatment of wastewater differ across nearly every operational dimension that matters to a plant manager under compliance pressure:

  • Organic load handling capacity: Aerobic systems perform well with low-to-moderate organic loads; anaerobic systems are generally better equipped to handle high-strength, high-organic-load effluent.
  • Energy requirement: Aerobic treatment tends to demand higher ongoing energy input for aeration; anaerobic treatment tends to require less external energy and can offset a portion of demand through biogas recovery.
  • Sludge generation: Aerobic processes generally produce a higher volume of sludge requiring disposal; anaerobic processes tend to generate comparatively lower sludge volumes.
  • Space and infrastructure needs: Aerobic systems often need less land area for a given treatment capacity; anaerobic systems, particularly those using lagoons or larger digesters, can require a larger footprint, though compact anaerobic reactor designs have narrowed this gap considerably.
  • Retention time: Aerobic systems typically operate on shorter retention times; anaerobic systems generally require a longer retention period to achieve comparable reductions.
  • Odor and by-product management: Aerobic systems tend to generate lower odor levels; anaerobic systems require more deliberate gas capture and odor mitigation measures, though this is offset by the value of biogas recovery.

None of this is abstract for a compliance-focused plant manager. Your ability to consistently hit target reductions in BOD, COD, and suspended solids, the numbers CPCB and SPCB inspectors care about, depends directly on matching your treatment method to your actual load profile. A plant running an aerobic system against a load it wasn’t designed for will chronically underperform, and repeated underperformance is exactly what triggers regulatory scrutiny and penalty exposure.

Where the Anoxic Tank Fits In

This is where a lot of confusion creeps in, so let’s clear it up directly: an anoxic tank is not the same as an anaerobic tank, even though the terms sound similar and are frequently mixed up in casual conversation.

An anoxic tank in a sewage treatment plant operates in a low-oxygen environment, not entirely oxygen-free like an anaerobic system, but with dissolved oxygen levels low enough that specific microbial processes, particularly denitrification, can occur. In an anoxic tank, facultative bacteria use the oxygen bound in nitrate molecules (rather than free dissolved oxygen) to break down organic matter, converting nitrates into nitrogen gas that’s released to the atmosphere.

The distinction matters because:

  • Anaerobic conditions involve a complete absence of oxygen (and nitrates), typically used for organic load reduction and biogas generation.
  • Anoxic conditions involve a controlled, low-oxygen environment specifically used for nitrogen removal.

This is why many modern ETPs are moving toward a hybrid approach, combining anaerobic, anoxic, and aerobic stages in sequence to tackle organic load reduction, nitrogen removal, and final polishing all within one integrated system. For plants facing stricter nutrient discharge norms alongside conventional BOD/COD requirements, incorporating an anoxic stage is often what closes the compliance gap that a purely aerobic or purely anaerobic system can’t address on its own.

The Microbiology Behind It, Anaerobic Microbes vs Heterotrophic Microbes

The Microbiology Behind It, Anaerobic Microbes vs Heterotrophic Microbes

You don’t need a microbiology degree to run a compliant plant, but understanding the basic players involved makes a real difference when something goes wrong and you’re trying to figure out why.

Anaerobic microbes are organisms that survive and function without oxygen. They work in coordinated stages, some breaking down complex organic molecules into simpler compounds, others converting those compounds into acids, and finally, methanogenic organisms converting those acids into methane-rich biogas. These microbes tend to be slower-growing and more sensitive to environmental swings, which is why anaerobic systems can take noticeably longer to recover from a shock load or process upset.

Heterotrophic microbes, on the other hand, are organisms, typically found in aerobic and anoxic systems, that derive their energy from consuming organic carbon compounds, using oxygen (or in the anoxic case, nitrate-bound oxygen) as part of their metabolic process. They tend to be faster-growing and generally more resilient to moderate fluctuations in load, which contributes to the comparatively quicker recovery times seen in aerobic systems.

Why does this matter for compliance outcomes? Because microbial balance is essentially the engine driving your treatment performance. If your system’s dominant microbial population isn’t well-matched to your actual influent characteristics, too much organic shock for a slow-recovering anaerobic culture, or insufficient oxygen supply for a heterotrophic-dominant aerobic system, you’ll see it directly in your effluent quality reports, and eventually in your inspection outcomes.

Anoxic vs Anaerobic vs Aerobic Treatment, Which One Do You Actually Need?

This is the question that actually matters at the end of the day. Here’s a practical way to think through it:

Choose aerobic sewage treatment if:

  • Your influent organic load is low to moderate and relatively consistent
  • You have significant space constraints and need a smaller treatment footprint
  • You need faster treatment cycles and quicker recovery from minor load variations
  • Energy cost is a manageable line item relative to your overall operating budget

Choose anaerobic wastewater treatment if:

  • Your influent is high-strength or high-organic-load in nature
  • You want to offset energy costs through biogas recovery
  • You have adequate space and can accommodate longer retention times
  • Your influent characteristics are relatively stable, minimizing the risk of shock-load disruption

Consider a hybrid or anoxic-inclusive approach if:

  • You’re facing both organic load and nitrogen removal requirements
  • Your existing system is aerobic-only or anaerobic-only but isn’t consistently hitting compliance targets
  • You’re retrofitting an older plant and need a more flexible, multi-stage design that can absorb fluctuating loads without triggering non-compliance flags
  • You want a more dependable buffer against the kind of variability that industrial effluent often brings

When it comes to reliability under fluctuating load conditions, which is the reality for most industrial plants, a well-designed hybrid system generally offers the most dependable path to consistent compliance, since it isn’t relying on a single microbial process to absorb every kind of variability your influent throws at it.

A Note on the Numbers

Throughout this article, we’ve deliberately avoided citing exact figures for BOD, COD, retention times, or efficiency percentages, and there’s a good reason for that: every ETP is different. The values and ranges referenced here are general industry indicators only. Actual performance figures for your plant will depend on your specific influent characteristics, system design, hydraulic and organic loading rates, temperature conditions, and day-to-day operating practices.

Treating any generic number as a benchmark for your own plant can be misleading, and in a compliance context, misleading assumptions are exactly what create risk. If you want to understand where your plant genuinely stands relative to CPCB and SPCB norms, the most reliable path is a plant-specific assessment, not a generic industry figure.

This is exactly the kind of clarity Team One Biotech’s bioremediation experts can provide, a detailed look at your actual influent profile, existing infrastructure, and compliance gaps, so your treatment decisions are based on your plant’s reality rather than general assumptions.

FAQs

Is aerobic or anaerobic treatment better for compliance with CPCB norms?

Neither is universally “better”, it depends on your influent load and design. Aerobic sewage treatment often performs more predictably for low-to-moderate organic loads, while anaerobic wastewater treatment is generally more effective for high-strength effluent. Many plants achieve the most dependable CPCB and SPCB compliance through a hybrid system that combines both approaches.

Can a plant use both aerobic and anaerobic treatment together?

Yes, and many modern ETPs do exactly this. A common configuration uses anaerobic treatment as a first stage to handle high organic loads and generate biogas, followed by aerobic (and often anoxic) stages for further polishing and nitrogen removal before final discharge.

What is the role of an anoxic tank in a sewage treatment plant?

An anoxic tank operates in a low-oxygen environment specifically to support denitrification, the conversion of nitrates into nitrogen gas, which helps plants meet nutrient-related discharge norms alongside conventional BOD and COD reduction targets.

How do heterotrophic microbes differ from anaerobic microbes in treatment performance?

Heterotrophic microbes generally operate in aerobic and anoxic environments, tend to be faster-growing, and recover more quickly from load fluctuations. Anaerobic microbes operate without any oxygen, work through a multi-stage biological pathway, and tend to be slower-growing and more sensitive to shock loads, though they offer the added benefit of biogas generation.

Making the Right Call for Your Plant

Choosing between aerobic sewage treatment, anaerobic wastewater treatment, or a hybrid anoxic-inclusive design ultimately comes down to a handful of decision factors:

  • Your load profile, how strong and how variable is your influent, realistically?
  • Your space availability, are you working within a fixed retrofitted footprint, or do you have room to expand?
  • Your energy budget, can you absorb the ongoing demand of an aerobic system, or would biogas recovery meaningfully help your bottom line?
  • Your compliance risk tolerance, how much buffer do you need against shock loads and inspection uncertainty?
  • Your manpower and O&M capacity, do you have the skilled staff to manage a more complex multi-stage system, or do you need something more straightforward to operate day to day?

There’s no universally “correct” answer here, only the answer that’s correct for your specific plant. And getting that answer right the first time is far less costly, in every sense, than retrofitting a poorly matched system after a compliance failure.

If you’re weighing this decision right now, whether you’re designing a new ETP from scratch, troubleshooting an underperforming system, or trying to figure out why your current setup isn’t holding up under inspection, Team One Biotech’s bioremediation experts are ready to help. From plant-specific assessments to customized bioaugmentation and treatment optimization solutions, we work directly with plant managers and engineers to build treatment systems that hold up under real operating pressure, not just on paper. Reach out to explore what a properly matched aerobic, anaerobic, or hybrid treatment solution could do for your compliance standing and your operating costs.

Looking to improve your ETP/STP efficiency with the right bioculture?
Talk to our experts at Team One Biotech for customised microbial solutions.

Contact: +91 8855050575

Email:  sales@teamonebiotech.com

Visit: www.teamonebiotech.com

Discover More on YouTube – Watch our latest insights & innovations!-

Connect with Us on LinkedIn – Stay updated with expert content & trends!
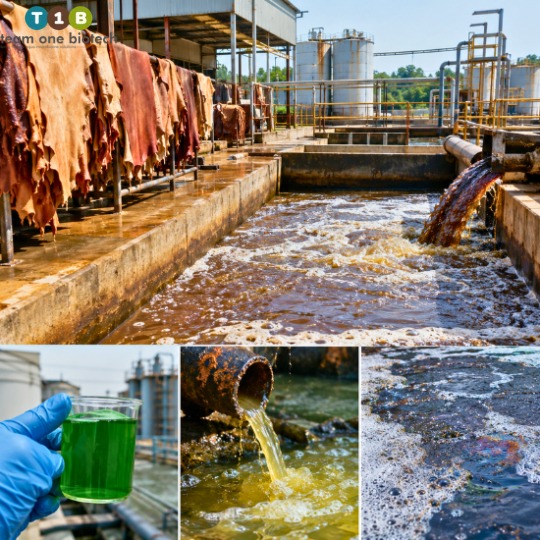
DEWATS Systems: When Decentralized Wastewater Treatment Is The Right Choice

You’ve got a residential project half-built, occupancy certificates are pending, and the municipal sewage line your project was supposed to connect to is still years away from actually reaching your site. Or maybe you’re running a hospital campus and you’ve just received a compliance notice because your existing treatment setup can’t keep pace with the load. Or you’re a facility manager fielding complaints from residents about tanker trucks rumbling through the gate every other day, kicking up dust and leaving behind that unmistakable smell.

These aren’t rare scenarios. They’re the everyday reality for a lot of developers, campus managers, and municipal planners across India who assumed centralized sewage infrastructure would simply be there when they needed it, and then discovered it wasn’t, or wouldn’t be for a long while.

This is where DEWATS systems enter the conversation. DEWATS stands for Decentralized Wastewater Treatment System, and at its core, it’s a philosophy as much as a technology: treat wastewater close to where it’s generated, using biological and gravity-driven processes instead of leaning on heavy machinery, constant electricity, or a sprawling network of pipes connecting back to a central plant.

In this article, we’ll walk through how DEWATS systems actually work, when they make more sense than a centralized treatment plant, how they help you stay compliant with CPCB and SPCB norms, and what to look for when picking a provider. If you’re weighing your options for a new project, a campus expansion, or a township that’s outgrown its current setup, this should give you a clear, practical starting point.

What Is a DEWATS System, and How Does It Actually Work

What Is a DEWATS System, and How Does It Actually Work

The DEWATS full form, Decentralized Wastewater Treatment System, tells you most of what you need to know upfront. It’s decentralized, meaning treatment happens on-site or close to the source rather than being piped miles away to a centralized municipal plant. And it’s designed around a simple idea: let natural biological processes, combined with smart engineering, do the heavy lifting instead of pumps, blowers, and constant power draw.

A typical DEWATS setup moves wastewater through a series of stages, each one doing a specific job:

  • Settling and primary treatment (often an anaerobic baffled reactor): Wastewater first passes through chambers where solids settle out and anaerobic bacteria begin breaking down organic matter, all without any mechanical agitation.
  • Anaerobic filtration: The partially treated water then moves through filter media, where bacteria attached to the filter surface continue digesting remaining organic pollutants.
  • Root zone treatment, also called constructed wetland treatment: Water is directed through a planted gravel bed, where plant roots and the surrounding microbial ecosystem absorb and break down nutrients and remaining contaminants.
  • Polishing pond or final treatment stage: A final holding stage allows further natural purification before the water is discharged or reused, often for irrigation or landscaping.

What makes this approach genuinely appealing to developers and facility managers is what’s absent from the process. There’s no dependency on continuous electricity, no complex array of moving mechanical parts that need constant servicing, and no requirement for specialized operators running the plant around the clock. That translates into a system that’s far less likely to break down, far cheaper to keep running, and far more forgiving if your site experiences power cuts, which, let’s be honest, is not exactly a rare occurrence in a lot of semi-urban and rural parts of the country.

Root Zone Treatment and Constructed Wetlands Explained

Root Zone Treatment and Constructed Wetlands Explained

Root zone treatment deserves its own spotlight because it’s genuinely one of the more elegant pieces of this whole system, and it’s also the part that tends to win over clients who care about sustainability.

Here’s the basic concept: wastewater flows horizontally or vertically through a bed of gravel planted with specific wetland species, think reeds, canna, or similar hardy plants. The plant roots create a dense underground network that hosts a thriving community of microorganisms. Those microorganisms do the actual pollutant breakdown, while the plants themselves absorb nutrients and help maintain the right conditions for the biological process to keep working efficiently.

From the outside, a constructed wetland doesn’t look like a treatment plant at all, it looks like a landscaped garden bed. That’s a real selling point for real estate developers who don’t want an eyesore near their clubhouse or entrance, and for campus managers who’d rather have a green space than a mechanical structure humming away in the background.

There’s also a quieter appeal here for the more eco-conscious client. Root zone treatment leans almost entirely on natural processes, produces minimal sludge compared to conventional mechanical systems, and generally requires far less day-to-day intervention. For a project head managing a rural township or a campus with a small maintenance team, that lower-maintenance profile can be the deciding factor over a system that demands specialized technicians and constant monitoring of mechanical components.

DEWATS vs Centralized Treatment: When Decentralized Wins

DEWATS vs Centralized Treatment: When Decentralized Wins

This is usually the question that actually brings people to an article like this one: should we go decentralized, or should we wait for or invest in a centralized system? The honest answer is that it depends on your specific project, but there are some decision factors that consistently tip the scale one way or the other.

Site location and distance from municipal sewer lines. If your project sits well outside the existing municipal sewage network, which is common for townships on the outskirts of growing cities, or for campuses in semi-urban areas, running a connecting pipeline can involve a long wait and a significant capital outlay. A DEWATS system sidesteps that dependency entirely.

Land availability and layout flexibility. Centralized plants typically need a sizeable, dedicated plot, often at a specific point in the drainage layout. DEWATS systems, by contrast, can often be designed to fit into irregular or constrained plots, and in the case of root zone treatment, can even double as usable green space.

Budget and phased development. Many real estate projects are built and occupied in phases. A decentralized system can often be scaled or expanded in step with construction phases, whereas a centralized plant usually requires the full design capacity to be committed to upfront.

Community size and scalability needs. For scattered residential clusters, smaller townships, or campuses with a defined and fairly stable population, a decentralized approach avoids the inefficiency of over-building a large centralized plant for a population that doesn’t need that scale.

Energy and grid reliability concerns. In areas where power supply is inconsistent, a system that doesn’t lean heavily on electricity for its core treatment stages is a genuinely practical advantage, not just a sustainability talking point.

To be clear, centralized systems absolutely have their place. For large, dense urban developments with strong grid reliability and an existing municipal network close at hand, a well-designed centralized plant can offer economies of scale that a decentralized approach won’t match. The point isn’t that one approach is universally superior, it’s that the right choice depends on where your project sits, how it’s phased, and what your site conditions actually look like. A credible design partner should be willing to have that honest conversation with you rather than pushing one solution regardless of fit.

Compliance Angle: Staying on the Right Side of CPCB/SPCB Norms

Compliance Angle: Staying on the Right Side of CPCB/SPCB Norms

Here’s the part that often gets underestimated until it becomes a crisis: compliance with CPCB and SPCB discharge and reuse standards isn’t a paperwork formality. It’s a real operational and legal risk. Developers have seen occupancy certificates delayed over treatment plant compliance issues. Facility managers have had to explain to leadership why a routine inspection turned into a legal notice. Municipal planners have watched community trust erode after a poorly maintained system led to visible or reported violations.

A well-designed DEWATS system is built with these standards in mind from the outset, aiming to consistently deliver treated water quality that falls within the ranges expected for discharge or reuse under applicable municipal and pollution control board guidelines. But, and this is important, the design alone doesn’t guarantee ongoing compliance. Consistency comes from proper commissioning, periodic monitoring, and a maintenance routine that doesn’t get neglected once the initial excitement of the project fades.

This is also where choosing a credible manufacturer or design partner really matters. A system built by a team with a genuine track record in compliance-focused design, and one that offers structured monitoring support after installation, meaningfully reduces the risk of the kind of surprises that lead to legal liability or reputational damage down the line.

A quick but important note: any performance figures, treatment efficiency ranges, or capacity numbers referenced in discussions around DEWATS or centralized systems are general and indicative only. Actual outcomes vary considerably from one installation to another, depending on factors like influent load, site conditions, climate, and how consistently the system is maintained. Anyone evaluating a system for a specific project should treat broad ranges as a starting point for conversation, not a guarantee, and should work with their design partner to understand what’s realistic for their particular site.

Who Should Consider DEWATS

DEWATS systems tend to make the most sense for a fairly specific set of readers, and if you fall into one of these categories, it’s worth a closer look:

  • Real estate developers working on projects located away from established municipal sewage infrastructure, or building in phases where a scalable, on-site solution avoids upfront over-investment.
  • Campus and facility managers, schools, hospitals, corporate parks, who need a low-maintenance system that won’t demand a large dedicated technical team and can operate reliably even through power interruptions.
  • Municipal planners assessing options for townships or peri-urban developments where extending centralized sewage lines isn’t currently practical or cost-effective.
  • Rural and semi-urban project heads who need a treatment solution that’s rugged, low-tech in the right ways, and doesn’t fall apart the moment the local grid goes down.

If your project fits any of these profiles, a decentralized approach is worth serious evaluation rather than being treated as a fallback option only used when a centralized connection isn’t available.

What to Evaluate Before Choosing a DEWATS Provider

Not all DEWATS providers are equal, and the difference between a system that runs smoothly for years and one that becomes a recurring headache often comes down to who designed and built it. Before committing to a provider, it’s worth working through a short checklist:

  • Design experience across varied site conditions. Ask whether the provider has handled projects with similar land constraints, population sizes, and soil or terrain conditions to yours.
  • Compliance track record. Look for a provider who can speak knowledgeably and specifically about CPCB and SPCB requirements relevant to your region, not just generic assurances.
  • After-installation support. A system is only as reliable as the maintenance and monitoring behind it. Ask what ongoing support looks like, inspections, troubleshooting, and responsiveness when something needs attention.
  • Material and construction quality. Reactor chambers, filter media, and wetland bed construction all need to be built to last; ask about the materials and construction standards being used.
  • Site assessment approach. A provider who takes the time to properly assess your soil, water table, expected load, and layout before proposing a design is signaling that they’re not just selling a one-size-fits-all package.

This is an area where Team One Biotech has spent considerable time refining its approach, not because every project looks the same, but because every project doesn’t, and a design that ignores that tends to underperform.

Bringing It Together: Peace of Mind, Not Just a Treatment Plant

Going back to where we started, the stalled project, the compliance notice, the tanker trucks nobody wants rolling through the gate, the underlying thread across all of these situations is the same. A wastewater treatment decision isn’t just an engineering choice; it’s a decision about risk, reliability, and how much of your attention you want this system to demand over the years ahead.

A thoughtfully designed DEWATS system offers a path to sidestep a lot of that friction: no dependency on an uncertain municipal connection, a lower ongoing maintenance burden, and a design built with compliance in mind rather than as an afterthought. That doesn’t mean it’s the right fit for every project, but for scattered developments, campuses, townships, and rural or semi-urban sites, it’s very often the more practical answer.

If you’re currently weighing your options, whether you’re planning a new project, dealing with a compliance concern, or simply trying to figure out whether decentralized treatment makes sense for your site, schedule a site assessment with Team One Biotech. Our team can walk through your specific land, load, and compliance requirements and help you figure out what actually fits, rather than pushing a generic solution.

And if you’re not ready for a full consultation just yet, feel free to reach out for more detail on how our DEWATS systems are designed, or get in touch through our contact page to have an informal conversation about your project.

Frequently Asked Questions

What is the full form of DEWATS?

DEWATS stands for Decentralized Wastewater Treatment System, an approach to treating sewage on-site or close to its source, using low-energy, largely biological treatment stages instead of a centralized municipal plant.

Is DEWATS suitable for large housing societies, or only small sites?

DEWATS systems are flexible in scale. While they’re a natural fit for smaller or scattered developments, they can also be designed for larger housing societies and townships, particularly when a project is built out in phases or sits far from municipal sewage infrastructure.

Does a DEWATS system require electricity to run?

One of the defining features of DEWATS is that the core treatment stages, settling, anaerobic filtration, and root zone treatment, operate without a continuous electricity supply, relying instead on gravity flow and biological processes. Some ancillary components may use minimal power, but the system isn’t dependent on constant electricity to function.

How is compliance with CPCB/SPCB norms ensured in a decentralized system?

Compliance comes from a combination of sound initial design, proper commissioning, and consistent ongoing monitoring and maintenance. A well-designed DEWATS system aims to keep treated water quality within applicable discharge or reuse standards, but this needs to be paired with regular checks rather than assumed to be automatic.

What is the difference between root zone treatment and conventional STPs?

Root zone treatment relies on planted gravel beds and natural microbial activity to break down pollutants, with minimal mechanical equipment involved. Conventional STPs typically use mechanical aeration, pumps, and other electrically driven processes to achieve treatment, which generally means higher energy use and a greater maintenance burden.

Note: All figures, ranges, and comparisons discussed in this article are general and indicative only. Actual performance, costs, and design parameters vary from one installation to another depending on site-specific factors, and should be assessed individually with a qualified design partner.

Looking to improve your ETP/STP efficiency with the right bioculture?
Talk to our experts at Team One Biotech for customised microbial solutions.

Contact: +91 8855050575

Email:  sales@teamonebiotech.com

Visit: www.teamonebiotech.com

Discover More on YouTube – Watch our latest insights & innovations!-

Connect with Us on LinkedIn – Stay updated with expert content & trends!
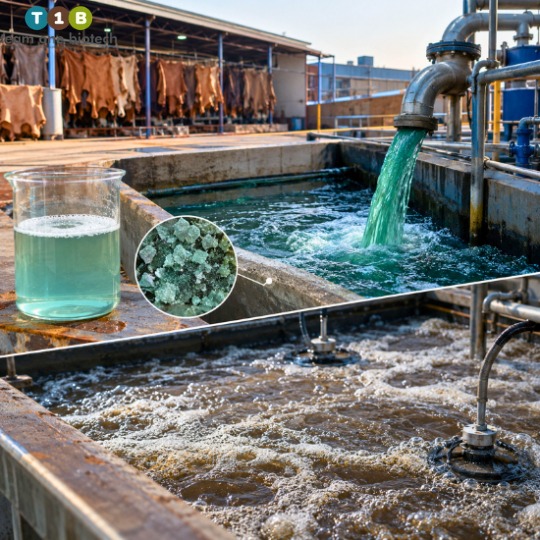
Scan the code