

The Real Cost of an ETP Shutdown: A Line-Item Breakdown
It’s a little after six in the morning when your phone lights up. The ETP operator says the outlet looks wrong. Foam is climbing over the aeration tank, the odour has reached the admin block, and last night’s COD results make no sense. By afternoon, production is being asked to cut load. A few days later, a notice from the pollution board lands on your desk.
Now you’re explaining it to the board and the CFO. The first question is always the same: what is this going to cost us?
Here’s the uncomfortable answer. The ETP shutdown cost that appears on a repair invoice is usually the smallest number in the room. The real damage sits around it, and most of it never gets added up in one place. This post does that.
Key Takeaways
- The repair bill is a small slice of total exposure. Lost production, compensation, utilities, recovery and customer fallout are usually larger.
- CPCB Environmental Compensation runs per day of violation, so every day of delay adds to the bill.
- Closure directions, bank guarantee forfeiture and CTO complications can hit working capital and dispatch schedules together.
- A biological crash takes weeks to stabilise, not days.
- A planned preventive programme is often a fraction of the cumulative exposure of a single serious failure.
Why the Repair Bill Is the Smallest Number in the Room
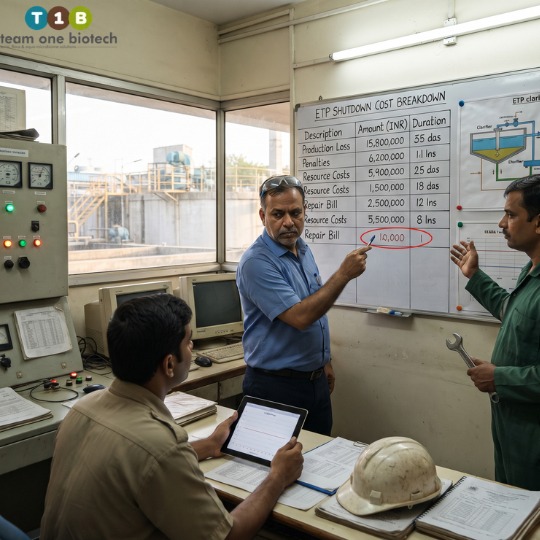
When an effluent treatment plant fails, people instinctively look at what it costs to fix: a blower, a diffuser, some replacement media, a few days of contractor time. That figure is easy to see, so it gets all the attention.
It’s also misleading. An ETP failure cost spreads across at least seven areas: production, regulatory, closure and finance, personal liability, utilities, biological recovery, and commercial reputation. Different departments pay for each, which is why nobody sees the full total.
Finance sees the compensation notice. Operations sees the idle lines. The EHS head sees the consent file. Sales sees the buyer’s audit email. Put side by side, they tell a very different story from the repair receipt.
Let’s go through them one line at a time.
Line Item 1: Direct Production Loss
This is usually the first hit and the fastest-moving one. If effluent can’t be treated to discharge norms, you either throttle production or stop it. Neither is cheap.
What to count:
- Output lost on halted or throttled lines, valued at contribution margin rather than cost
- Idle labour, including contract workers you still have to pay
- Fixed costs absorbed by each idle day (rent, depreciation, interest, salaried staff)
- Missed dispatch windows and the expediting costs of catching up
- Overtime once operations resume, as the plant tries to recover lost volume
For a mid-sized unit, a single idle day can run from a few lakh rupees to well into the tens of lakhs, depending on product value and fixed-cost base. A shutdown that stretches to several days or a few weeks can push this line alone into crores.
Wastewater-heavy sectors feel it sharply. In pharma, chemicals, dyes, textiles and distilleries, production volume and effluent volume are tightly linked. You can’t simply keep running and “sort the ETP later”.
Line Item 2: Environmental Compensation Under the CPCB Formula
This is where regulatory exposure becomes a number. The Central Pollution Control Board uses a formula-based approach to Environmental Compensation (EC), which is charged on the basis of the polluter-pays principle. Environmental Compensation CPCB assessments are now a routine part of how violations are quantified.
How the EC formula works
In plain form, it looks like this:
EC = PI x N x R x S x LF
Each term in one line:
- PI is the Pollution Index of your industry category. Industries are classified by their pollution potential, so a highly polluting category carries a higher index.
- N is the number of days of violation. It keeps counting for as long as the violation continues.
- R is a rupee-based factor set by the regulator. It converts the other terms into a monetary figure.
- S is the scale factor, reflecting the size of the unit.
- LF is the location factor, which accounts for the sensitivity or pollution load of the area where the unit operates.
Outcomes vary widely by industry category, scale and location. Depending on those inputs, a single assessment can range from a few lakh rupees to several crore rupees. The numbers also depend on how the regulator assesses the violation period, which is rarely something you get to negotiate on your own terms.
Why the daily clock makes small delays expensive
Look at N again. It doesn’t stop because you’ve identified the problem, ordered a part or scheduled a meeting. It keeps running every day the violation continues.
That changes how you should think about response time. Three extra days spent debating a vendor, waiting for a purchase approval or hoping the biology will “settle on its own” aren’t free. They’re multiplied across every other term in the formula.
A plant that restores compliance quickly and documents it well stands in a very different position from one that lets the violation run for weeks. The EC formula rewards speed, whether or not anyone designed it that way.
Indicative only: EC outcomes are general ranges and depend on the regulator’s own assessment. Confirm the current methodology with the relevant authority.
Not sure where your plant stands? Ask Team One Biotech for a quick ETP health check, and find out how exposed your biological system really is before a notice does it for you.
Line Item 3: Closure Notices, CTO Renewal Risk, and Bank Guarantee Forfeiture
Compensation is a financial penalty. Closure is an operational one, and it can be far more disruptive.
Section 33A directions
Under Section 33A of the Water (Prevention and Control of Pollution) Act, 1974, the board can issue directions, including closure, prohibition or regulation of an industrial process. A Section 33A Water Act closure notice can also include directions to disconnect electricity and water supply. In practice, an SPCB closure direction can mean that your plant simply can’t run, regardless of what your order book looks like.
The plant closure pollution board cost isn’t limited to the days you’re shut. It includes the time to respond, the cost of submitting a compliance plan, the inspections that follow, and the restart process after any revocation.
CTO renewal complications
Your Consent to Operate is the document that lets the plant function legally. A recorded violation tends to complicate CTO renewal for ETP units. Expect more questions, more inspections, additional documentation and, in some cases, delays. A delayed renewal can create its own operating uncertainty, even when no closure order is active.
Bank guarantee forfeiture
Many boards ask for a bank guarantee as a security against non-compliance. If violations continue or compensation isn’t paid, that guarantee can be invoked. Bank guarantee forfeiture by the pollution board does two things at once: it removes a sum from your balance sheet, and it ties up credit limits you may have wanted for working capital. The amount at stake can range from several lakh rupees to a few crore rupees, depending on unit size and category. Re-furnishing a fresh guarantee takes both money and time.
Put together, closure risk, CTO friction and guarantee forfeiture hit cash flow from three directions at once.
Line Item 4: Personal and Criminal Liability for Plant Leadership
This is the line item that changes the tone in a boardroom.
Environmental statutes generally define responsibility not just for the company but for the people who run it. Under the Water Act, officers in charge of the conduct of the business, including directors, occupiers and senior plant executives, can face scrutiny when violations occur. Proceedings can include prosecution, and they can be time-consuming, stressful and reputationally difficult, regardless of the final outcome.
It’s worth being measured here. Penalty provisions under these laws have been amended in recent years, and the balance between imprisonment-based and monetary penalties has shifted in some cases. Readers should confirm the current legal position, and how it applies to their role, with their own legal counsel.
What matters for the business case is this. Once leadership understands that the exposure may be personal, the conversation moves. An ETP stops being a utility that EHS manages and becomes a risk item that the CFO, the board and the audit committee want to see covered. That shift alone often unlocks preventive budgets that were stuck for years.
This section is informational and is not legal advice.
Line Item 5: Secondary Utility Wastes and Hidden Operating Costs
Even before regulators act, a failing ETP quietly burns money. These costs rarely get tagged to the incident because they’re spread across several cost centres.
What to count:
- Power: aerators and blowers running at full tilt with poor oxygen transfer, because the biology isn’t consuming load efficiently
- Water: extra dilution, flushing or fresh-water use in an attempt to bring parameters down
- Chemicals: emergency coagulants, pH correction, antifoam and oxidants added in larger quantities than normal
- Tanker-based disposal: shifting untreated or partly treated effluent to authorised facilities, often at a premium
- Emergency manpower: extra shifts, contractor crews, consultants and weekend call-outs
- Third-party lab testing: repeated sampling to track recovery and to document compliance for the board
Individually, these are small. Combined over a recovery period, they can add from a few lakh rupees to tens of lakhs, and more for larger units or longer failures. Tanker disposal in particular can climb quickly when volumes are high.
The worst part is that much of this spending is reactive and unproductive. It treats symptoms, not causes, and it often continues for days after the headline problem appears “fixed”.
Line Item 6: Biological Re-Seeding and Recovery Costs
If your ETP relies on a biological stage, and most do, then a crash isn’t a mechanical fault you can repair on Tuesday. It’s a living system that has died or been badly damaged. Rebuilding it takes time.
Why recovery takes weeks
Microbial populations grow at their own pace. After a toxic shock, a pH swing, a sudden organic overload or a prolonged power failure, the community of microorganisms doing the work can collapse. Even if the cause is removed quickly, rebuilding a healthy, balanced culture often takes anywhere from a couple of weeks to several weeks, depending on the system and the severity.
The usual recovery work includes:
- Re-seeding with fresh culture or sludge from a stable source
- Careful nutrient dosing (nitrogen and phosphorus balance) to support regrowth
- Rebuilding MLSS to a workable operating range
- Controlled loading, because pushing full flow too early can trigger a second crash
- Daily monitoring of DO, pH, SV30, MLSS and outlet parameters
During this period, your treatment capacity is reduced, sometimes sharply. That means the plant may need to run at partial load for much longer than the original failure, extending the production loss in Line Item 1 and the daily clock in Line Item 2. This is why an ETP biological crash is more expensive than it first appears.
Where bioaugmentation fits
Bioaugmentation for ETP is the controlled addition of selected microbial cultures to strengthen or restore the biological stage. The idea is simple. A well-chosen consortium adds resilience when the existing biomass is stressed. Used preventively, it can help a plant absorb shocks that would otherwise tip it into a crash. Used during recovery, it can help shorten the time needed to rebuild treatment capacity.
It isn’t a magic fix. Results depend on effluent characteristics, process design, operating discipline and the quality of the culture. No responsible supplier can guarantee an outcome. But as a planned safety buffer, it’s one of the more practical tools available to an EHS or plant head.
Line Item 7: Inventory Spoilage, Supply Chain Penalties, and Brand Equity
This is the slowest-burning line item, and for many companies the most expensive in the long run.
Spoilage and time-sensitive inventory
In food and beverage, pharma intermediates and some chemical processes, a halted line can leave work-in-progress or finished goods with a limited shelf life. Spoilage and write-offs can run from a few lakh rupees to several crore rupees, depending on product and volume.
Contract penalties
Missed delivery windows trigger liquidated damages, penalty clauses or loss of preferred-supplier status. Procurement teams in your customer’s organisation notice this, and they remember.
Buyer audits and scorecards
Large buyers, especially global ones, increasingly assess suppliers on environmental performance. A regulatory notice can show up in an ESG questionnaire or a customer compliance scorecard. Export customers may request corrective action reports, schedule extra audits or pause orders until they’re satisfied.
Long-term reputational drag
This one is hard to price, but it’s real. A reputation for environmental non-compliance can affect tender eligibility, financing terms, insurance conversations and hiring. Recovery can take months to years, long after the ETP itself is stable.
Indicative only: these ranges are general and vary by customer mix, contract terms and product category.
A Quick Cost Summary Table
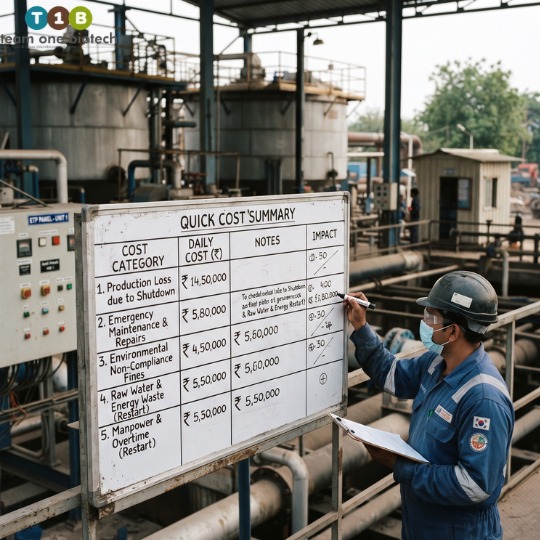
| Cost Category | What It Covers | Indicative Range | Who Feels It |
| Direct production loss | Idle lines, labour, missed dispatches, fixed-cost absorption | Several lakhs to crores | Operations, Finance |
| Environmental Compensation | CPCB EC formula, daily violation clock | A few lakhs to several crores | Finance, EHS |
| Closure, CTO, bank guarantee | Section 33A directions, renewal delays, guarantee forfeiture | Several lakhs to a few crores | CFO, Plant Head, Legal |
| Personal and legal exposure | Proceedings, legal fees, management time | Low lakhs to higher, case dependent | Directors, Occupiers, Executives |
| Secondary utilities | Power, water, chemicals, tankers, manpower, lab tests | A few lakhs to tens of lakhs | Operations, EHS |
| Biological recovery | Re-seeding, nutrients, MLSS rebuild, reduced capacity | Low lakhs to tens of lakhs, plus extended downtime | EHS, Operations |
| Inventory, supply chain, brand | Spoilage, penalties, audits, reputation | Several lakhs to crores | Sales, Procurement, Board |
Note: all values are general indicative ranges. They will differ for every ETP depending on capacity, industry category, location, discharge norms, and the regulator’s assessment.
Prevention vs. Shutdown: The Math CFOs Should Actually Run
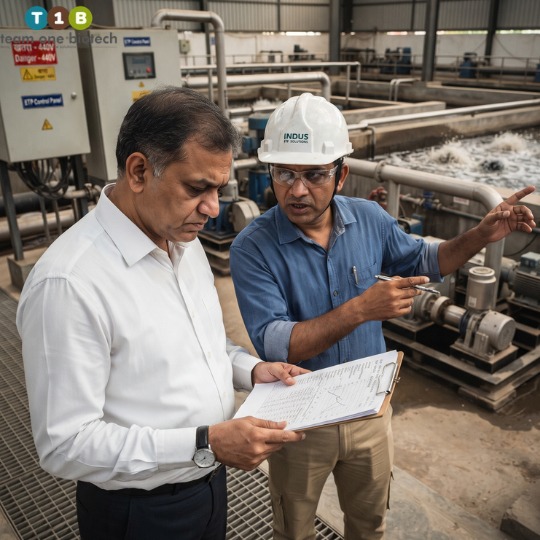
Most preventive spending gets compared with last year’s maintenance budget. That’s the wrong comparison. The right one is against the cumulative exposure above.
A planned programme usually combines a few elements: routine bioaugmentation, nutrient and load monitoring, a small safety buffer of stored culture, and operator training. Annual costs for such a programme typically sit in the range of a few lakh rupees to a few tens of lakh rupees, depending on ETP capacity and effluent complexity. Compare that with a serious failure, where combined exposure can run from tens of lakhs to many crores.
You don’t need to prove a failure will happen. You only need to show that the downside is large enough, and the premium small enough, that the trade makes sense. Here’s a simple four-step framework to build that case internally:
- Estimate daily exposure. Add idle-day fixed costs, lost contribution margin and utility waste for one stopped day. Use a low and a high figure.
- Estimate duration. Take a realistic recovery window, from a short disruption to a multi-week biological rebuild, and multiply it through.
- Add the one-time hits. Include EC, bank guarantee, legal and audit costs, and any inventory or contract penalties.
- Compare with prevention. Set the total against the annual cost of a preventive programme, then work out how many avoided incidents it takes to pay for itself.
Often, avoiding a single moderate event across several years is enough to justify the programme. For plants with a history of upsets, the case is stronger still.
Frequently Asked Questions
How much does an ETP shutdown typically cost an industrial plant?
There’s no single figure. Total ETP shutdown cost combines lost production, compensation, utilities, recovery and commercial fallout. For a mid-sized plant, a serious event can range from tens of lakh rupees to several crore rupees. Capacity, industry category and duration drive the spread.
How is Environmental Compensation calculated by CPCB?
CPCB uses a formula: EC = PI x N x R x S x LF. These stand for Pollution Index, days of violation, a rupee-based factor, scale and location. Because the number of days keeps running while the violation continues, delays increase the final amount. Actual assessments depend on the regulator.
Can a pollution board order plant closure for ETP failure?
Yes, in appropriate cases. Under Section 33A of the Water Act, boards can issue directions, including closure and disconnection of power and water. Whether that happens depends on the severity, history and response of the unit. Consult legal counsel for your specific situation.
How long does it take to recover after an ETP biological crash?
Recovery typically takes from a couple of weeks to several weeks, depending on the cause, the system design and how quickly culture and nutrients are restored. Loading has to be increased gradually. Rushing to full flow can trigger a second crash and extend the downtime.
Does preventive bioaugmentation really reduce the risk of ETP failure?
It can strengthen the biological stage and improve its ability to absorb shocks, which may lower the likelihood and duration of a crash. It isn’t a guarantee. Results depend on effluent, design and operating discipline, so plants should treat it as one part of a broader compliance plan.
Conclusion
Nobody budgets for the 6 a.m. phone call. But the plants that handle it best are usually the ones that did the arithmetic beforehand and kept a safety buffer ready.
The numbers in this article are ranges, not predictions. Your own ETP, your own category and your own location will shape the real exposure. What doesn’t change is the pattern: the repair bill is small, and everything around it is large. A sound ETP shutdown cost model, and honest effluent treatment plant compliance planning, can change how that call plays out.
If you’re weighing a preventive programme, start with facts about your own plant.
Book a free consultation or request a customised bioaugmentation plan from Team One Biotech. Our team will review your biological system, flag where you’re most exposed, and help you build the business case before the next failure puts a date on it. Don’t wait for a notice to set the timeline.
Disclaimer:- This article is for general information only. All monetary values, percentages and durations are indicative ranges and will differ for every ETP depending on capacity, industry category, location, discharge norms, and the regulator’s assessment. Nothing here is legal, financial or regulatory advice. Penalty provisions and enforcement approaches have been amended in recent years, so please confirm the current legal position with your own legal counsel and the relevant pollution control board.
Looking to improve your ETP/STP efficiency with the right bioculture?
Talk to our experts at Team One Biotech for customised microbial solutions.
Contact: +91 8855050575
Email: sales@teamonebiotech.com
Visit: www.teamonebiotech.com
Discover More on YouTube – Watch our latest insights & innovations!-
Connect with Us on LinkedIn – Stay updated with expert content & trends!