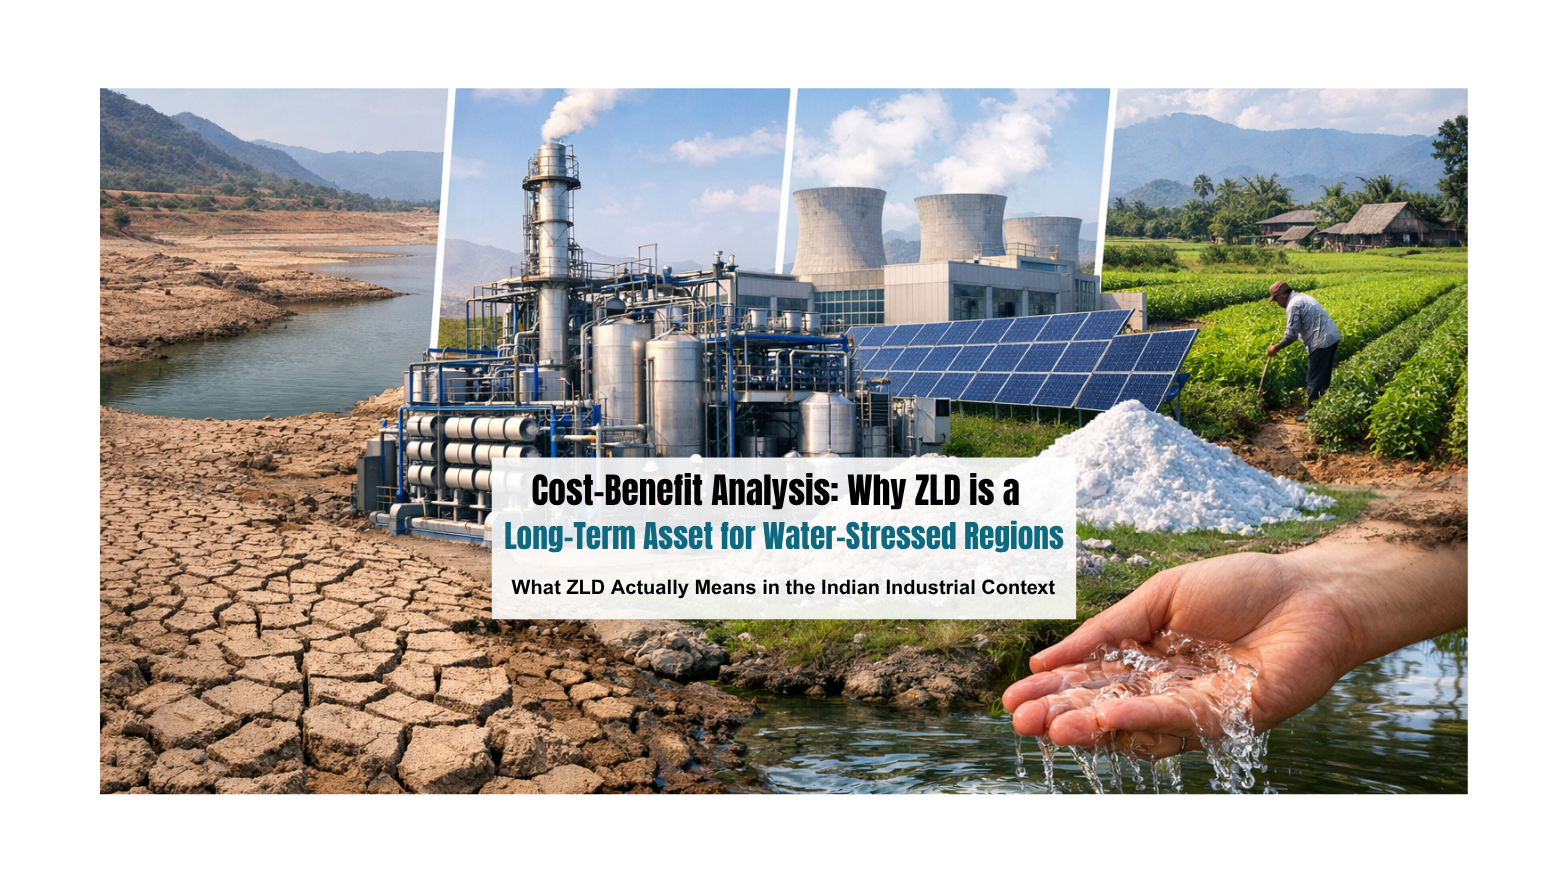
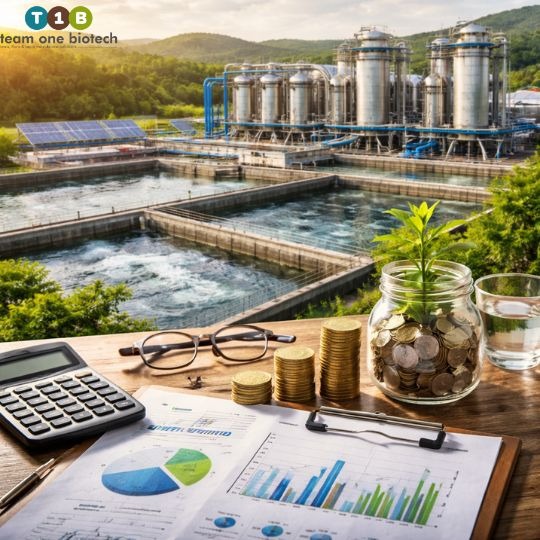
Cost-Benefit Analysis: Why ZLD is a Long-Term Asset for Water-Stressed Regions
Walk into any plant manager’s office in Tiruppur right now and you will likely find two things on the desk: a production schedule and a borewell depth report. Ten years ago, only one of those documents mattered for daily operations. Today, both carry equal weight.
That shift, quiet, gradual, and now impossible to ignore, is reshaping how India’s industrial leadership thinks about water. Not as a utility that flows from a tap and exits through a drain, but as a finite resource that entire communities, ecosystems, and production lines are competing for simultaneously.
In Tamil Nadu, Gujarat, and Maharashtra, the pressure is no longer theoretical. Groundwater levels in key industrial corridors have been declining for years. The National Green Tribunal has shut down hundreds of units for non-compliance. CPCB and SPCB enforcement is no longer occasional, it is systematic. And the question facing every C-suite executive, plant manager, and sustainability officer who depends on water-intensive processes is no longer “should we invest in better water management?” It is “how much longer can we afford not to?”
Zero Liquid Discharge is the answer that keeps coming up. Not because it is fashionable, and not simply because regulators are pushing for it, but because implementing Zero Liquid Discharge (ZLD) Systems ensures that the economics, when looked at honestly and in full, are becoming increasingly difficult to argue against.
This article is that honest look.
What ZLD Actually Means in the Indian Industrial Context
From Treatment to Recovery: A Fundamental Shift in Thinking
For decades, effluent treatment was designed around one core assumption: the water leaves. You treat it to an acceptable standard, you discharge it into a drain or waterbody, and your obligation ends at the boundary wall. The entire infrastructure of conventional ETPs, equalization tanks, aeration basins, secondary clarifiers, was built to service that assumption.
Zero Liquid Discharge tears that assumption up entirely.
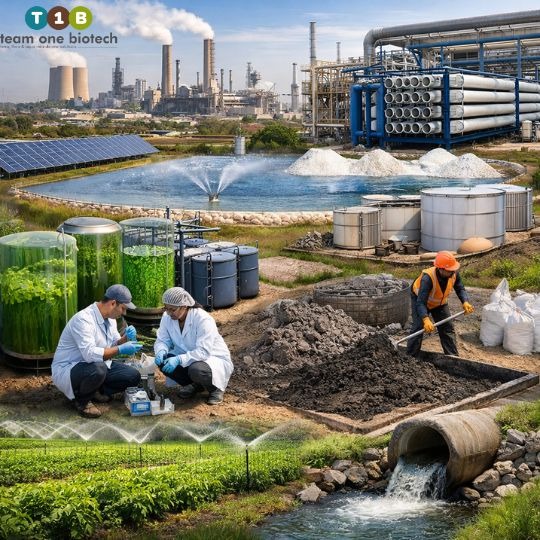
In a zero liquid discharge plant, the target is exactly what the name suggests. No liquid waste leaves the facility. Every litre of wastewater that enters the treatment system either comes out the other end as clean, reusable process water, or it gets concentrated down to a solid or semi-solid waste that can be managed, and in some cases, monetized. The drain is no longer the destination. Recovery is.
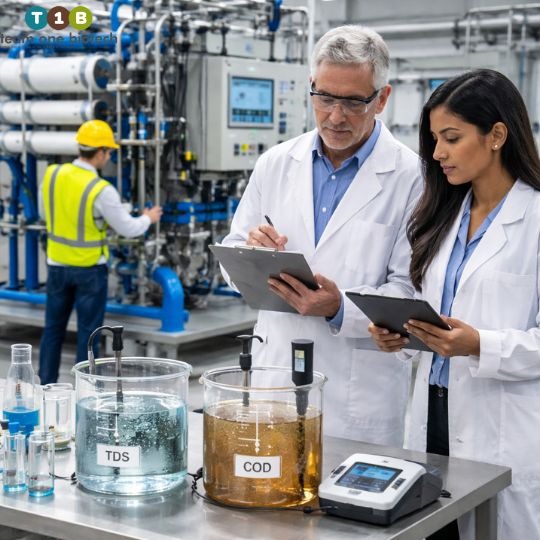
Making that shift work demands a much more granular understanding of water quality parameters than a conventional ETP ever required. You are no longer just treating to a discharge standard, you are managing a recovery system. And that system is sensitive to everything in the water.
The parameters that ZLD operations must track and control include:
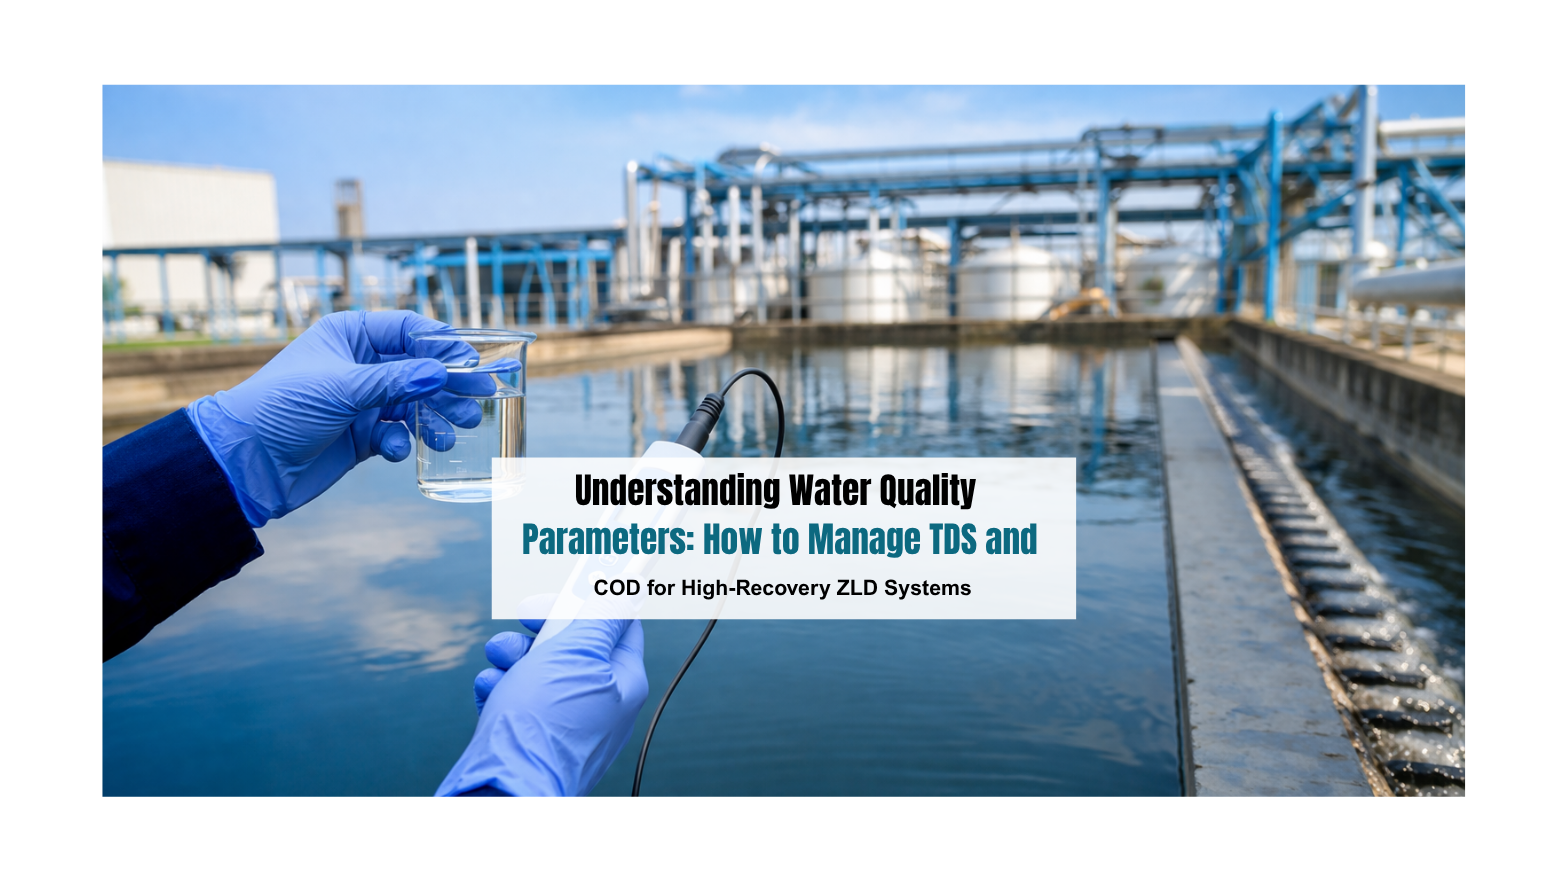
- Total dissolved solids (TDS) in water, the single most operationally critical parameter in most ZLD systems, because TDS concentration governs how hard your membranes have to work and how much energy your evaporators consume
- COD and BOD, organic load that must be substantially reduced before water reaches membrane or thermal concentration stages
- Suspended solids, fine particulates that foul membrane surfaces and reduce system life if not adequately managed upstream
- pH, conductivity, and specific ionic concentrations, sulfates, chlorides, calcium, heavy metals, all of which influence scaling behavior in evaporation systems
- Temperature, relevant for both biological activity in pre-treatment and thermal efficiency in concentration stages
Of all these, high TDS in water is what stops most Indian industrial effluent treatment systems in their tracks. Whether you are running a textile dyeing unit in Surat, a pharmaceutical API plant in Hyderabad, a distillery in Uttar Pradesh, or a chemical processing facility in Ankleshwar, managing TDS economically, without sacrificing water recovery, is the central engineering and financial challenge of ZLD implementation.
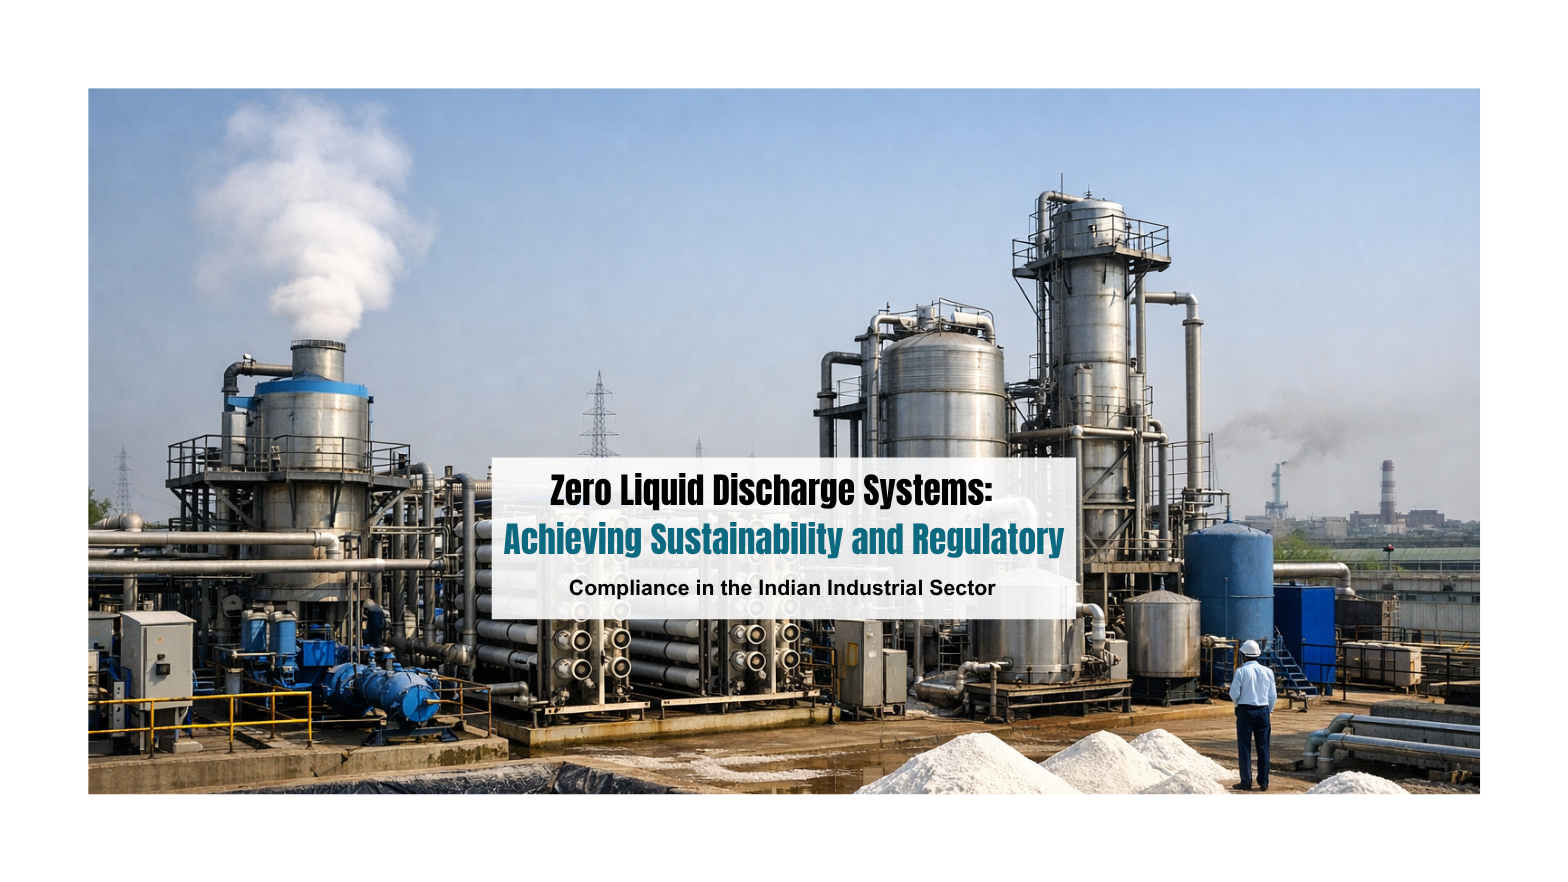
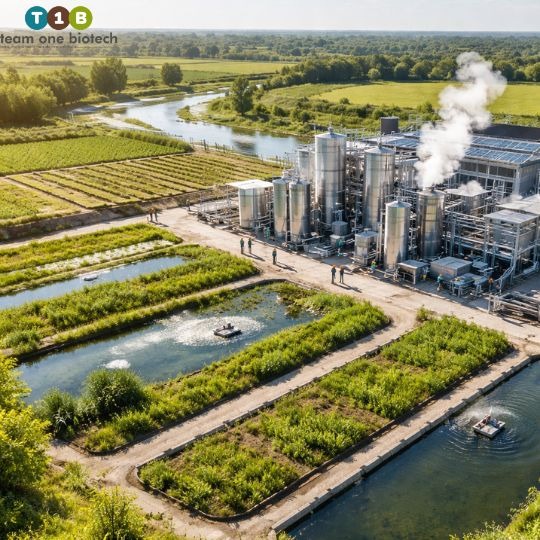
The Technology Stack Behind a Zero Liquid Discharge Plant
A full-scale ZLD system is not a single piece of equipment. It is a treatment train, a carefully sequenced set of processes, each dependent on the one before it performing to specification:
- Primary Treatment: Screening, equalization, neutralization, and primary settling to remove gross solids and stabilize the flow
- Biological Treatment: Aerobic and/or anaerobic systems to reduce organic load before the water reaches membranes
- Tertiary Polishing: Ultrafiltration or multimedia filtration to remove residual suspended solids and protect downstream membrane systems
- Reverse Osmosis: Membrane-based concentration to separate clean permeate water from a high-TDS reject stream
- Evaporation: Multi-effect evaporators (MEE) or mechanical vapor recompression (MVR) systems to concentrate the RO reject further
- Crystallization or Drying: Final stage to convert concentrated brine into a dry, manageable solid
Each of these stages must be designed for the specific effluent it will handle. A textile mill running reactive dye effluent has a completely different ZLD design requirement than a pharma plant managing solvent-laden process wastewater. That specificity is not a complication, it is a quality marker. Any ZLD proposal that does not begin with detailed effluent characterization is not a proposal worth accepting.
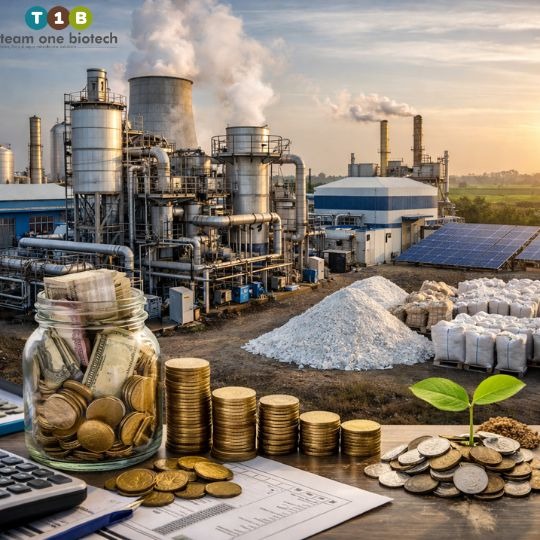
The Cost-Benefit Deep Dive
CAPEX: Understanding What You Are Actually Paying For
Let us be direct about something that often gets smoothed over in vendor conversations: ZLD systems cost more to build than conventional ETPs. Depending on the industry, effluent volume, and TDS levels involved, the capital expenditure for a zero liquid discharge plant can run 2x to 4x higher than a comparable conventional treatment system. That is a real number, and pretending otherwise does not serve anyone well.
These are general values and estimates; actual performance and costs vary based on the specific ETP/STP configuration and influent characteristics.
Where does that CAPEX go?
- Membrane systems, UF and RO arrays are precision equipment with significant procurement costs, and they need to be sized generously to handle peak loads without sacrificing recovery
- Evaporation systems, the MEE or MVR unit is typically the most expensive line item in the entire ZLD capital budget, driven by the materials, engineering complexity, and energy infrastructure required
- Pre-treatment upgrades, in most Indian facilities, the existing ETP was not built to feed a ZLD system, and bringing it up to standard requires meaningful investment
- Automation and instrumentation, ZLD systems cannot be run on manual checks and periodic grab samples; they require real-time monitoring, automated dosing controls, and SCADA integration to operate reliably
That CAPEX number is often where the internal conversation stalls. A finance committee sees the figure, compares it to the cost of continuing with existing treatment, and questions whether the investment is justified. That question is valid, but it is only answerable if the comparison includes the full financial picture, not just the build cost.
OPEX: Where the Long-Term Argument Lives
ZLD systems do carry higher operating costs than conventional ETPs. The energy consumption of evaporation systems is the primary driver of this, and it is a legitimate operational cost that any honest analysis must account for.
But here is what that same honest analysis must also account for:
Water recovery in a well-designed ZLD system can reach 80% to 95% of the total inlet volume. That recovered water goes back into the production process as clean, reusable supply. In a district where groundwater extraction is restricted, borewell levels are declining, or industrial water tariffs are rising, which describes a growing number of industrial zones across India, that recovery is not a convenience. It is a direct replacement for freshwater that would otherwise need to be purchased, transported, or extracted. The procurement savings compound over time.
Newer MVR-based evaporation technology is also shifting the energy equation. MVR systems recover and reuse the thermal energy from the evaporation process itself, substantially reducing the power consumption that made older MEE-based ZLD systems expensive to run. For facilities investing in ZLD today, the long-term OPEX profile looks meaningfully better than it did five years ago.
Some industries also recover tangible value from the solid or concentrated byproducts of ZLD processing. Distilleries can recover potassium-rich condensate from evaporation stages. Certain chemical processes generate concentrated salt streams that can be refined and resold. These recoveries are industry-specific and should not be assumed without technical analysis, but where they exist, they directly improve the ZLD business case.
These are general values and estimates; actual performance and costs vary based on the specific ETP/STP configuration and influent characteristics.
The Hidden Costs of Non-Compliance: The Number Nobody Puts in the Spreadsheet
Here is the calculation that most facilities skip, because it involves acknowledging a scenario nobody wants to plan for:
What does it actually cost when things go wrong?
Regulatory fines are the visible tip. The deeper damage runs much further:
- A single SPCB closure notice, even a temporary production suspension pending compliance verification, can cost more in lost output, missed shipments, and broken contracts than an entire year of ZLD OPEX. Fixed costs do not pause while the legal process runs its course.
- Legal battles to reverse environmental enforcement orders are slow, expensive, and rarely clean. They consume management bandwidth, legal budgets, and board attention for months, sometimes years.
- Water procurement costs in genuinely water-stressed districts are already escalating and will continue to do so. Facilities running on tanker water or unreliable borewells are not operating on a stable cost base, they are absorbing an inflation risk that gets worse every dry season.
- Global buyers in apparel, pharmaceuticals, agrochemicals, and food processing are conducting supplier environmental audits with increasing seriousness. A facility with a non-compliance record risks losing export contracts, failing ESG due diligence reviews, and becoming ineligible for the institutional supply chains that offer the best margins.
- Operating license renewals in several Indian states are now directly tied to environmental compliance history. A poor track record introduces structural uncertainty into long-term capital planning that no amount of operational efficiency can fully offset.
None of these costs appear in the CAPEX-versus-OPEX comparison that gets presented to the finance committee. They should.
The Hidden Gains: What ZLD Gives You That Nobody Markets Loudly Enough
Beyond avoiding the downside, ZLD adoption creates real, measurable value that pre-implementation analysis consistently undercounts:
- Water independence is perhaps the most strategically significant. A facility that recycles 80% to 95% of its process water is not merely compliant, it has fundamentally de-risked its operations against water scarcity. That resilience has a value that grows every year as regional water stress intensifies.
- Reduced freshwater draw lowers exposure to tariff increases and regulatory restrictions on industrial groundwater extraction, both of which are accelerating across multiple states.
- ESG and sustainability reporting value is real and growing. Companies reporting under BRSR, GRI, or preparing for international ESG disclosures benefit from documented water recovery metrics. For businesses seeking institutional investment or public market access, this is increasingly material.
- The narrative shift from “compliance obligation” to “resource stewardship” matters in ways that are difficult to put on a spreadsheet but very easy to see in stakeholder conversations, investor presentations, and community relations.
Bioremediation and ZLD: The Upstream Partnership That Changes the Economics
Why the Quality of Pre-Treatment Determines the Fate of Your ZLD Investment
This is the part of the ZLD conversation that does not get enough attention, and it is directly relevant to why so many Indian facilities see worse-than-expected performance from ZLD systems they have invested heavily in.
Membrane systems and evaporators are the most capital-intensive components of any zero liquid discharge plant. They are also the most sensitive. Feed them effluent that is too high in COD, too loaded with biological material, or carrying specific contaminants that drive scaling and fouling, and they will underperform, require more frequent cleaning, consume more chemicals, and degrade faster than the design life you were promised.
The performance of your ZLD system is, in very large part, a downstream consequence of the quality of your upstream biological treatment.
This is where advanced bioremediation changes the economics of ZLD at a system level, not just a pre-treatment level.
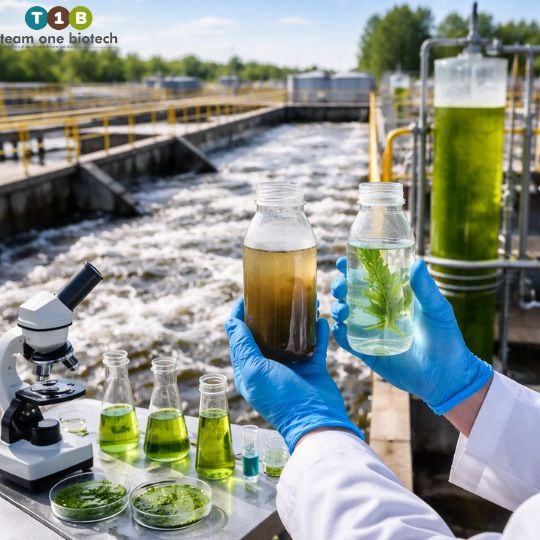
Team One Biotech’s bioaugmentation formulations introduce highly specialized microbial consortia into industrial effluent streams, targeting the organic compounds, specific contaminants, and biological load that standard biological treatment either handles poorly or cannot manage at all. In practice, this translates to:
- COD reductions of 60% to 85% upstream of membrane systems, directly reducing fouling frequency, extending membrane replacement intervals, and lowering cleaning chemical costs
- Improved management of TDS load by degrading certain organic dissolved solids before they reach the concentration stages, reducing the thermal energy burden on evaporators
- Sludge volume reduction through more efficient biological activity, lowering the handling and disposal costs that are an often-underestimated component of ZLD OPEX
- Targeted degradation of complex, recalcitrant molecules, pharmaceutical compounds, reactive dye intermediates, pesticide residues, that physical-chemical treatment alone cannot efficiently address
These are general values and estimates; actual performance and costs vary based on the specific ETP/STP configuration and influent characteristics.
The integration of bioremediation upstream of ZLD infrastructure is not a supplementary add-on for facilities that want to go the extra mile. It is an economic optimization that improves the cost-per-litre-recovered across the full operational life of the plant. The membrane lasts longer. The evaporator runs cleaner. The overall system performs closer to its designed recovery targets.
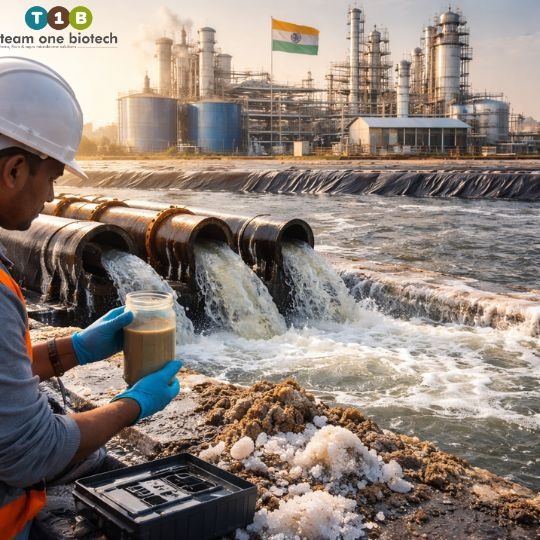
Meeting CPCB and SPCB Standards Through Biological Intelligence
There is another dimension to bioremediation in the ZLD context that matters specifically for Indian regulatory compliance. Facilities operating in red-category industry classifications, textiles, pharmaceuticals, chemicals, distilleries, tanneries, are expected to demonstrate water quality parameter management that goes well beyond volume control. CPCB and SPCB compliance inspections look at the full profile of what is in the water, not just how much of it there is.
Biological treatment offers something that chemical dosing cannot: adaptive capacity. Microbial systems respond to changes in influent load and composition in ways that chemical systems cannot, without the proportional increase in reagent cost and secondary waste generation. For Indian industrial facilities dealing with seasonal production variation, changing raw material inputs, and the inherent variability of complex effluent streams, that adaptability is not a minor technical advantage. It is operational resilience built into the treatment process itself.
Is ZLD the Right Decision for Your Facility Right Now?
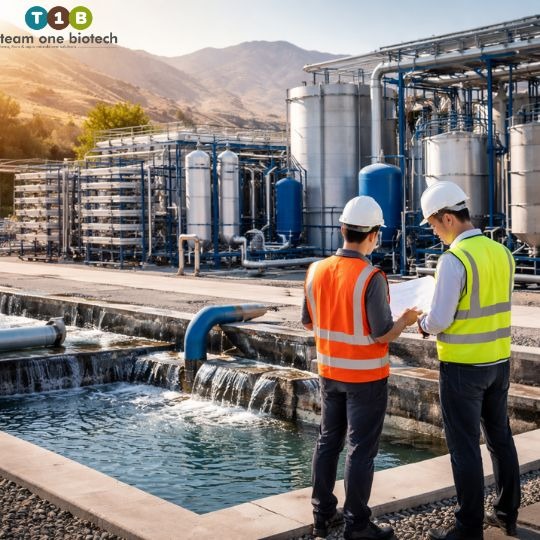
Asking the Right Questions Before You Ask About the Price
ZLD adoption is not one-size-fits-all, and the right answer depends on your specific situation, not on a general industry position. Before any serious investment conversation begins, a facility needs clear answers to:
- What does your current effluent look like, volume, COD, TDS, specific contaminants, and seasonal variability?
- What is the condition and capacity of your existing ETP or STP infrastructure?
- Are you operating under an active CPCB or SPCB compliance notice, or planning proactively?
- How water-stressed is your specific location, what do borewell trends, district water availability data, and local regulatory signals tell you about your five-year supply risk?
- What is your production growth plan, and what does that mean for your water demand trajectory?
The worst implementation of ZLD is a rushed one, driven by a regulatory deadline, executed without adequate site characterization, and optimized for speed rather than performance. Those systems underdeliver on recovery, overspend on OPEX, and create the impression that ZLD is more expensive than it needs to be. Proactive planning changes that outcome fundamentally.
The Facilities That Will Thrive Are Not the Ones That Spent the Least on Compliance
There is a version of this decision where a facility waits. It manages the existing ETP, addresses enforcement notices reactively, and defers the ZLD conversation until the regulatory or operational pressure becomes unavoidable. That is a coherent short-term position.
It is also, in the vast majority of water-stressed industrial contexts across India, a strategically costly one.
The facilities that will operate with confidence through the next decade of industrial growth are the ones that made the decision early enough to do it right. They designed their zero liquid discharge plant with adequate pre-treatment. They integrated bioremediation upstream to protect their membranes and optimize their recovery rates. They used the transition to reduce their freshwater dependence, improve their compliance standing, and build the kind of water resilience that turns a potential shutdown risk into a genuine competitive advantage.
Water stewardship, at this scale and in this moment in Indian industrial history, is not just good environmental practice. It is good business.
Talk to Team One Biotech Before the Next Dry Season Forces the Conversation
If your facility is in a water-stressed district, running under compliance scrutiny, or expanding operations in a zone where groundwater availability is declining, the right time for a ZLD feasibility analysis is now, not after the next enforcement notice arrives.
Team One Biotech works with industrial clients across India to design and optimize integrated wastewater treatment systems that combine advanced bioremediation with ZLD-ready infrastructure. A site audit from our team means a detailed look at your actual effluent profile, a clear-eyed assessment of your treatment gaps, and a realistic investment framework, CAPEX, OPEX, and recovery projections, built around your specific industry, volume, and regulatory environment.
No generic proposals. No theoretical frameworks that do not account for what is actually in your water.
Contact Team One Biotech today to schedule your site-specific water and compliance audit. The cost of that conversation is zero. The cost of the alternative is something most facilities only calculate once, after it is already too late.
Looking to improve your ETP/STP efficiency with the right bioculture?
Talk to our experts at Team One Biotech for customised microbial solutions.
Contact: +91 8855050575
Email: sales@teamonebiotech.com
Visit: www.teamonebiotech.com
Discover More on YouTube – Watch our latest insights & innovations!-
Connect with Us on LinkedIn – Stay updated with expert content & trends!