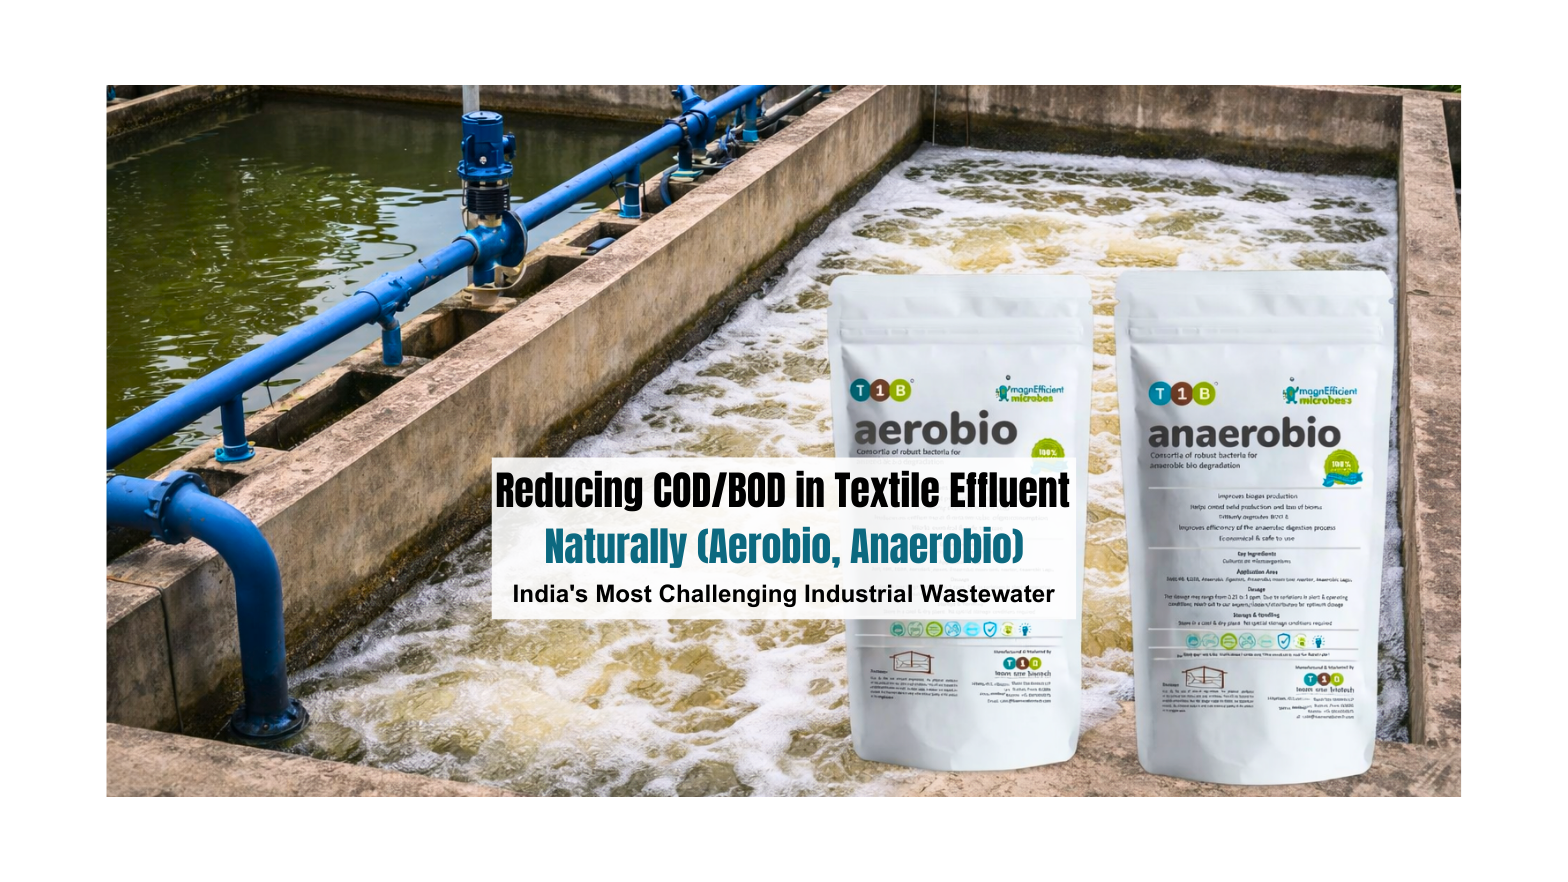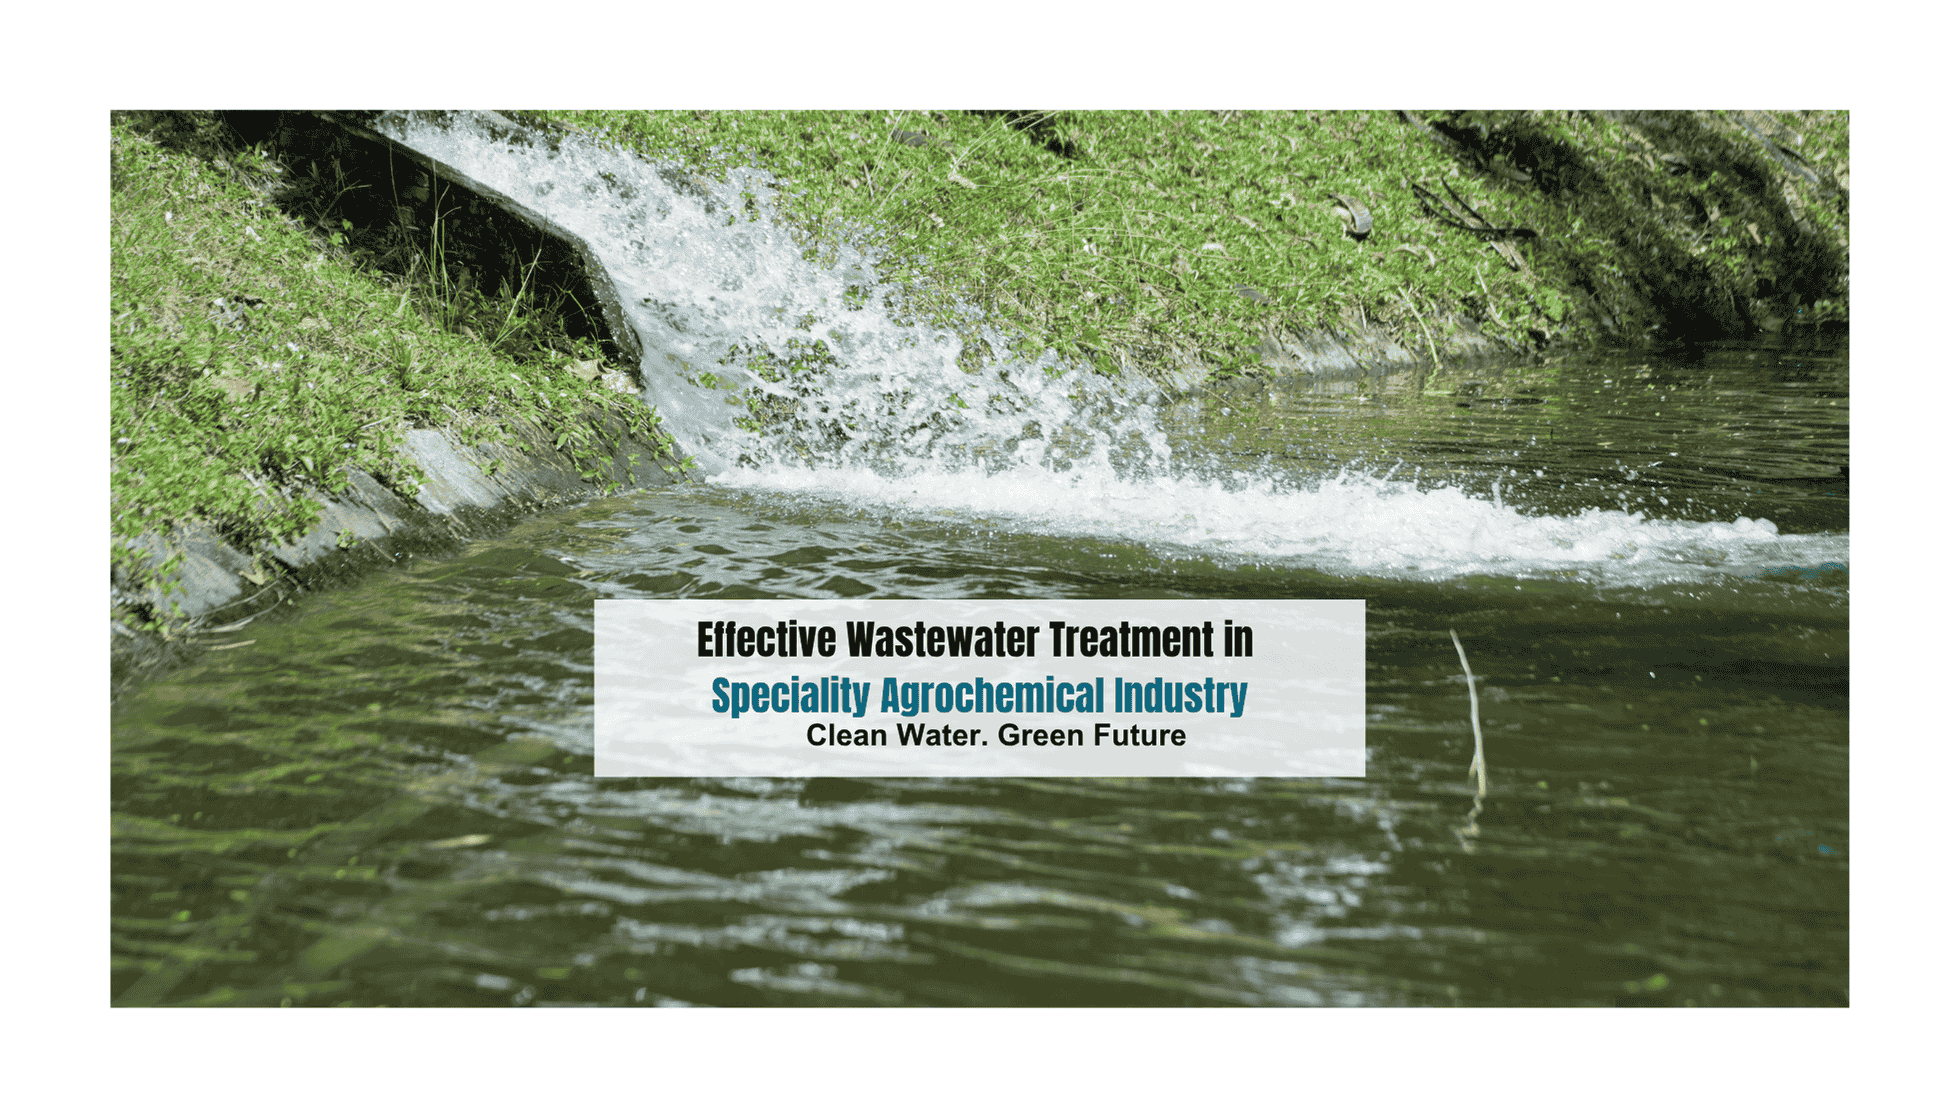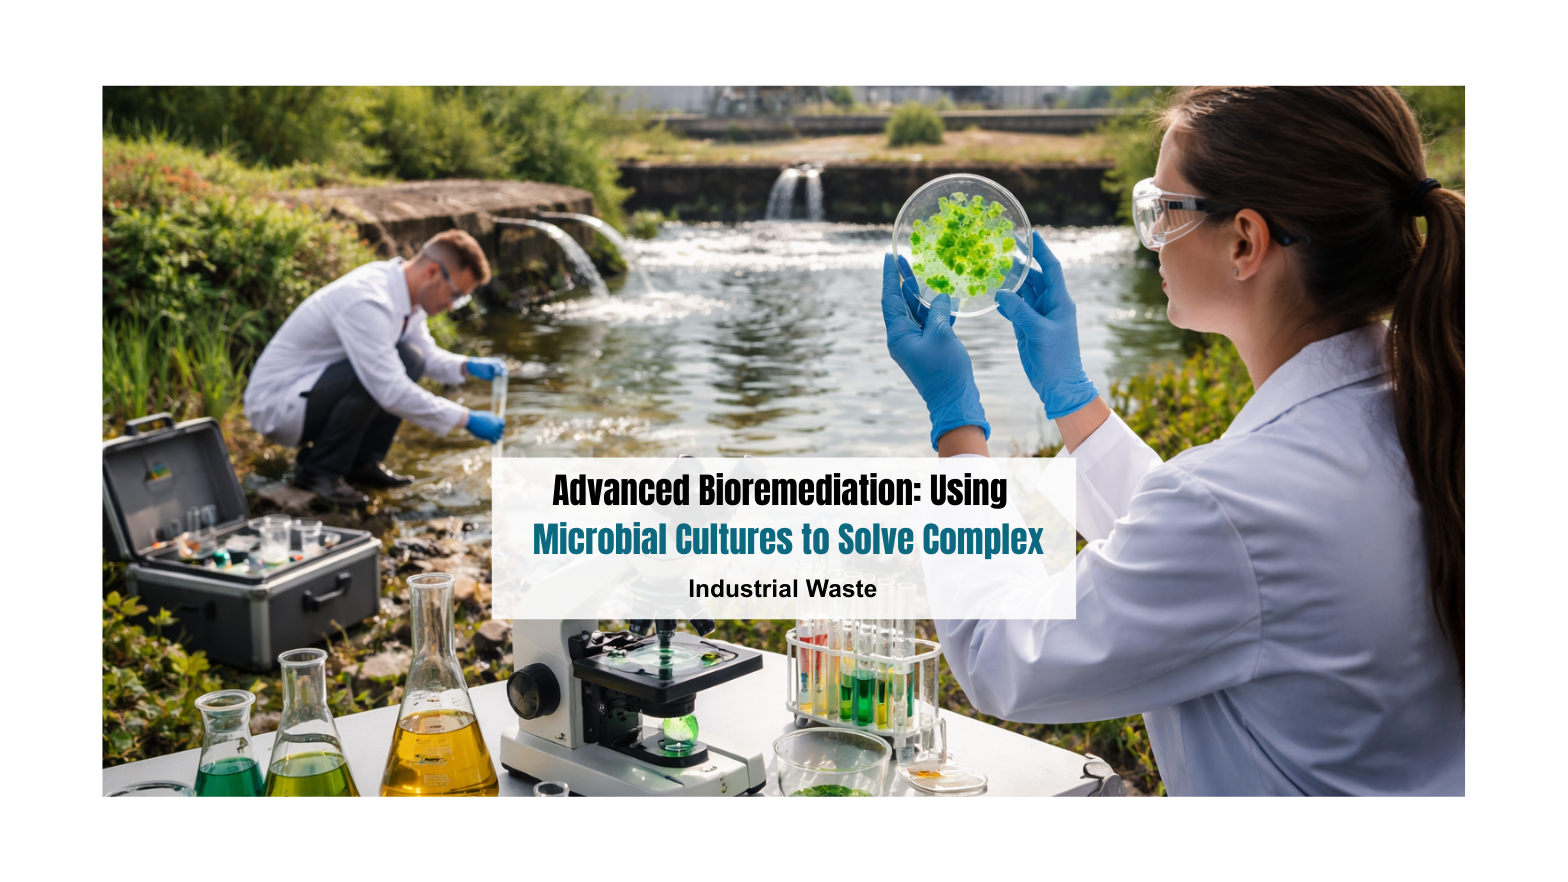
Advanced Bioremediation: Using Microbial Cultures to Solve Complex Industrial Waste
The Pressure Is Real, And It Is Getting Worse
It is 11 PM on a Tuesday, and the plant manager of a textile dyeing unit in Tirupur is staring at a compliance notice from the Tamil Nadu Pollution Control Board. The ETP is struggling. Sludge disposal costs have doubled in the past eighteen months. The tanker contractors are demanding more money. The landfill sites that used to accept industrial sludge without much paperwork are now suddenly asking for detailed hazardous waste manifests.
And somewhere in the back of his mind, he is wondering, is there a better way?
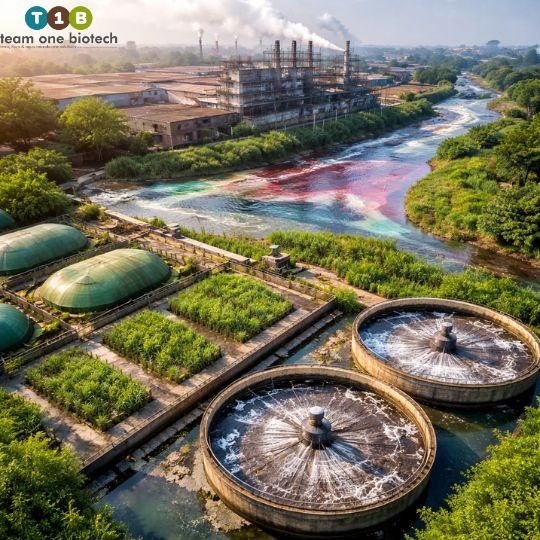
If you are reading this, you probably know that feeling. Whether you are running a pharma manufacturing plant in Hyderabad’s Genome Valley, managing a tannery operation in Kanpur’s Jajmau industrial belt, or overseeing a chemicals unit in Ankleshwar, the story is disturbingly familiar. Industrial effluent management in India is no longer a background operational task. It has become a front-line business risk.
The Central Pollution Control Board and State Pollution Control Boards across the country have significantly tightened discharge norms over the past several years. The zero liquid discharge mandate, the push for real-time online monitoring of ETPs, and the rising cost of sludge transportation and disposal have collectively made the old approach, pump it through a conventional ETP, pay someone to haul away the sludge, and hope for the best, both economically unsustainable and legally dangerous.
At Team One Biotech, we have been working directly inside these industrial environments for years. What we consistently observe is that most plants are treating their biological treatment systems as an afterthought, a box to tick, rather than as an engineered solution that can actively reduce costs, reduce risk, and transform waste into a manageable output. One such engineered approach involves using Microbial Cultures to Solve Complex Industrial Waste, which targets the root cause of treatment inefficiency. The problem is not just the effluent. It is the thinking around it.
This post is our attempt to change that thinking.
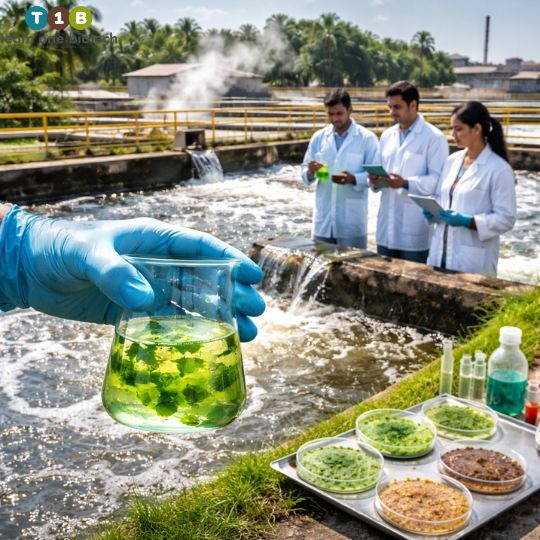
The Science of Microbial Bioremediation: What Is Actually Happening in Your ETP
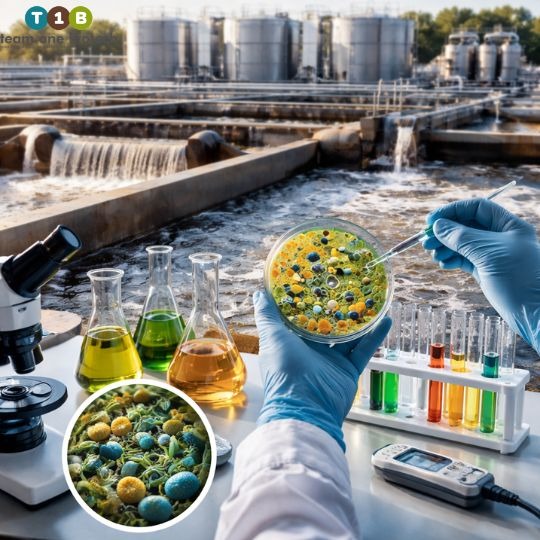
Most plant managers and even many ETP operators think of their biological treatment stage in simple terms: bacteria eat the waste, the BOD drops, the water looks cleaner. That is not wrong, exactly, but it misses the extraordinary complexity, and the extraordinary opportunity, that exists within a properly engineered microbial system.
How Microorganisms in Bioremediation Break Down Complex Compounds
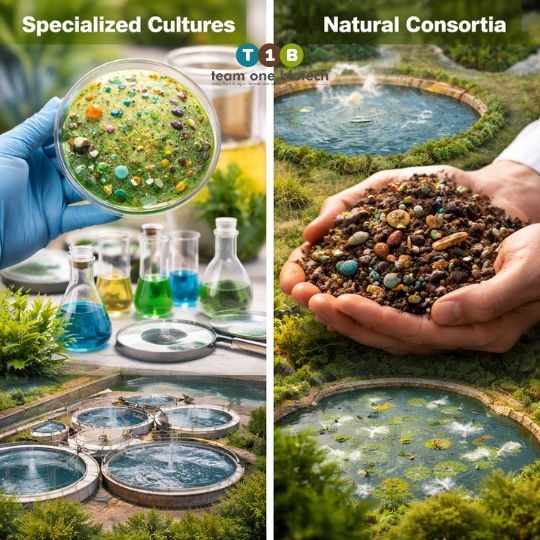
Microorganisms in bioremediation are not a homogenous group. They are a carefully assembled consortium of bacterial species, fungi, and in some advanced applications, archaea, each performing a specific biochemical function in a metabolic relay race.
Consider what happens when a textile effluent from a reactive dyeing process enters a biological treatment stage. The effluent contains not just colour, it contains long-chain azo compounds, surfactants, sizing agents, and residual fixatives. These are complex organic polymers, and no single microbial species can break all of them down.
Here is how a well-engineered consortium handles it:
- Hydrolytic bacteria attack the large polymer chains first, producing smaller, soluble organic molecules through enzymatic hydrolysis. Think of them as the initial demolition crew.
- Acidogenic bacteria then convert those smaller molecules into volatile fatty acids, alcohols, and gases. The effluent’s chemistry is shifting at this stage.
- Acetogenic bacteria further convert these intermediates into acetic acid, hydrogen, and carbon dioxide, the primary feedstocks for the final stage.
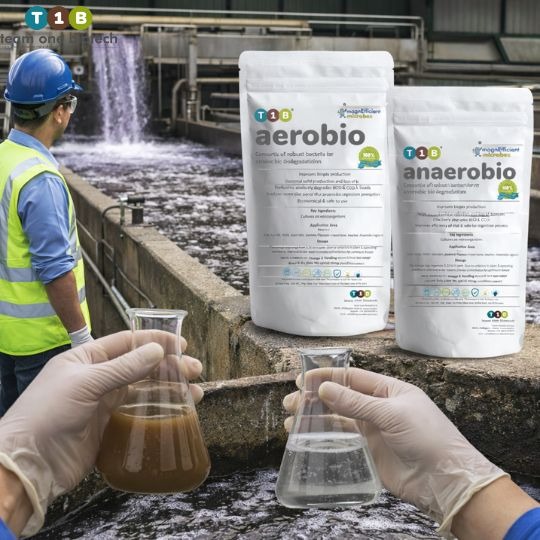
- Methanogenic archaea (in anaerobic systems) or aerobic heterotrophs (in aerobic systems) then complete the mineralisation, converting organic carbon into carbon dioxide, water, and, in anaerobic systems, biogas.
What makes this process remarkable is its adaptability. A properly cultured and acclimated microbial consortium can be trained, over time, to handle the specific chemical fingerprint of your effluent. This is not a generic commodity product, it is a living, adaptive system.
The Role of Enzymatic Activity in Complex Polymer Breakdown
One of the most underappreciated aspects of microbial bioremediation is the enzymatic component. Microorganisms secrete extracellular enzymes, laccases, peroxidases, azoreductases, that can degrade specific molecular structures before the organisms even ingest them. In textile effluents, laccase-producing organisms have been shown to achieve colour degradation that no chemical coagulant can match, and at a fraction of the cost.
In pharmaceutical effluents, particularly the antibiotic and API manufacturing clusters around Hyderabad, enzymatic breakdown is critical because many active pharmaceutical ingredients are specifically designed to resist biological degradation. Specialised microbial cultures with enhanced hydrolase and oxygenase activity are required, and standard wastewater treatment bacteria simply do not have these enzymatic pathways.
This is the difference between deploying a generic biological treatment product and deploying a targeted microbial solution engineered for your specific effluent matrix.
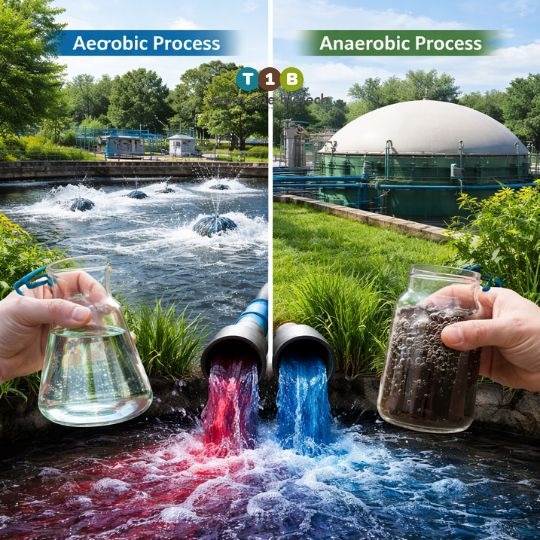
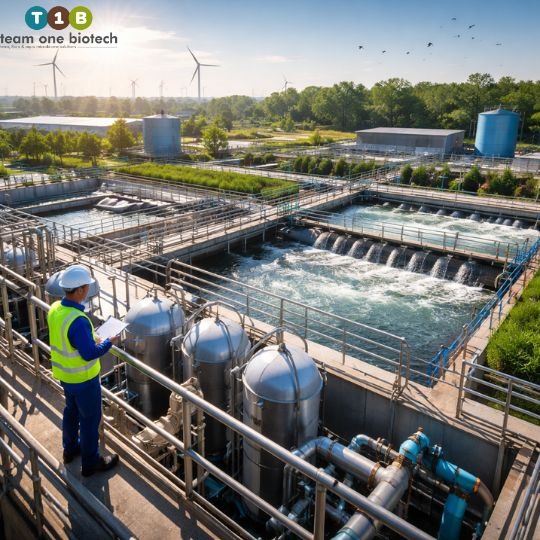
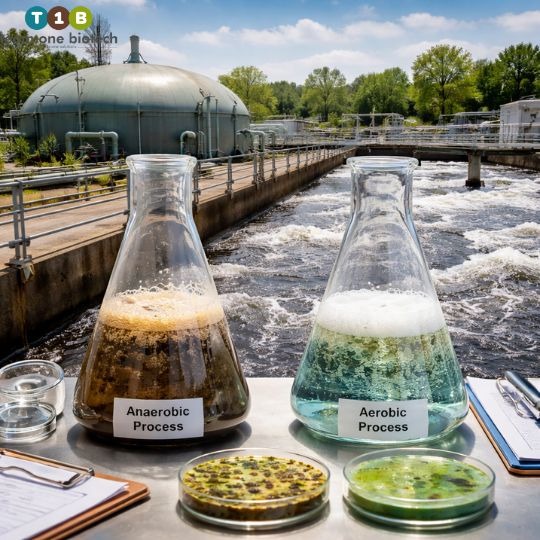
Anaerobic Process vs. Aerobic Process: Choosing the Right Biological Treatment
This is perhaps the most consequential technical decision in industrial ETP design, and it is one that is frequently made incorrectly, either at the design stage or in the ongoing operation of an existing plant.
The short answer: for high-strength industrial effluents, a staged combination of anaerobic followed by aerobic treatment is almost always the most effective and cost-efficient approach. But the details matter enormously.
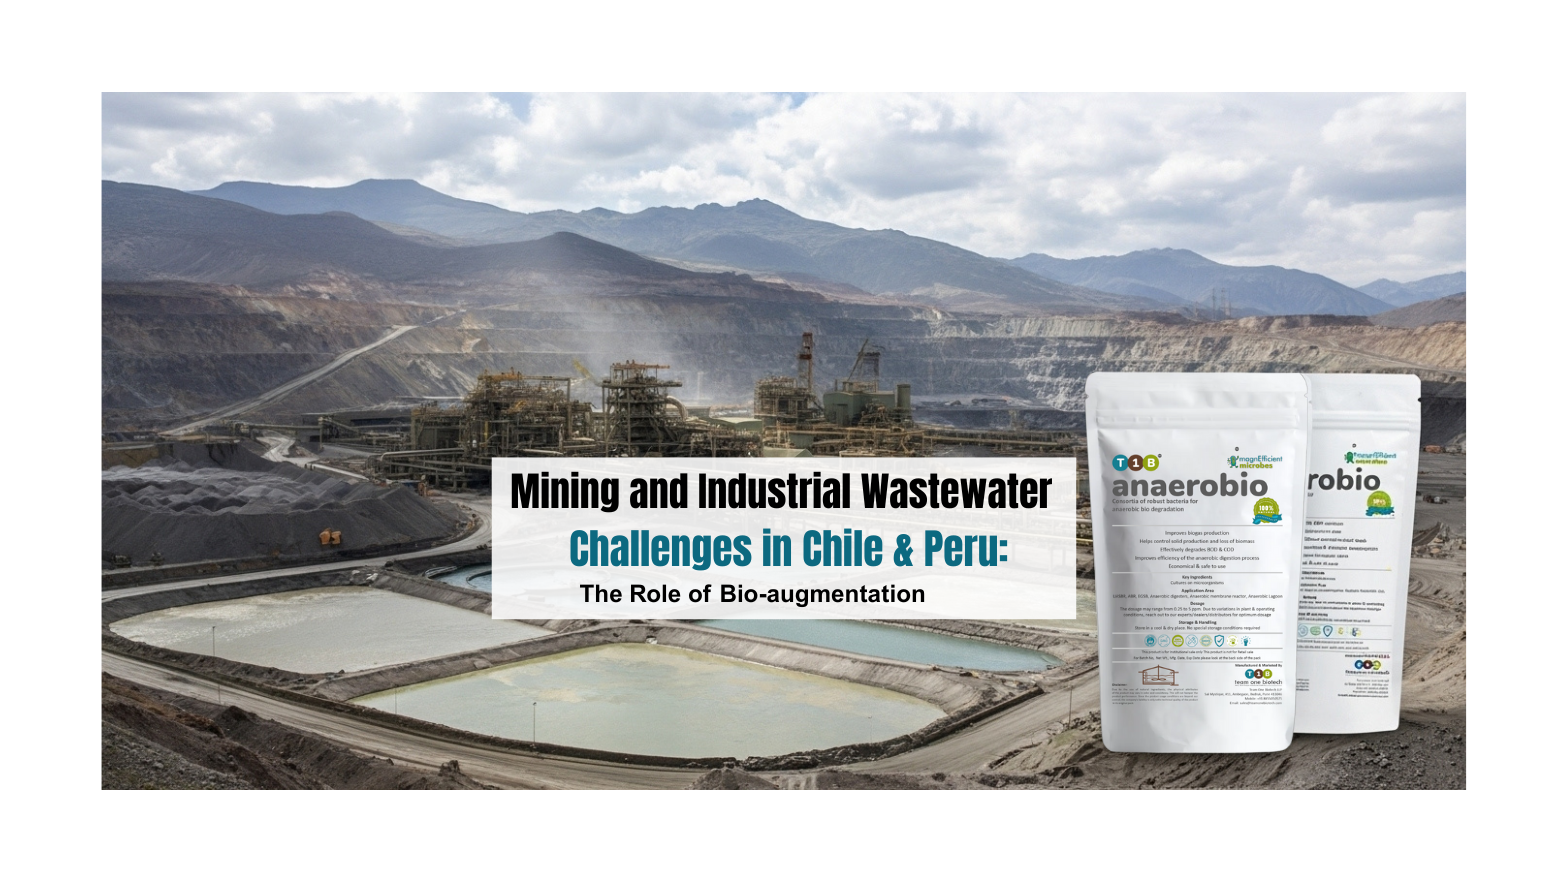
Understanding the Anaerobic Process for High-Load Industrial Effluents
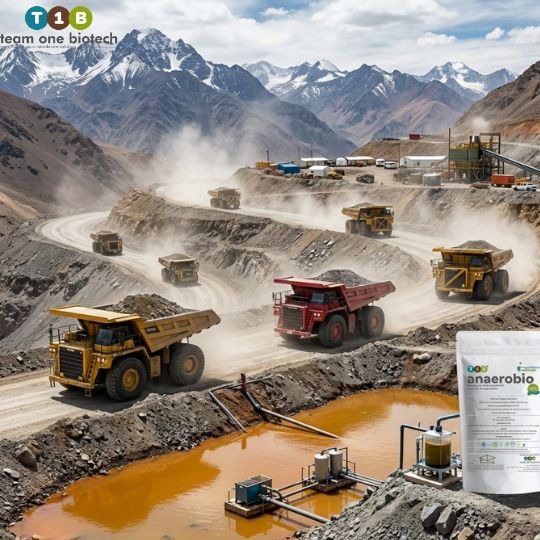
The anaerobic process excels when the incoming effluent has a very high organic load, typically expressed as Chemical Oxygen Demand (COD). For industries like distilleries (where spent wash COD can be extraordinarily high), paper and pulp mills, food processing units, and certain pharmaceutical effluents, a standalone aerobic system would require enormous aeration energy to handle the load. This is both technically inefficient and operationally expensive.
An anaerobic reactor, whether an Upflow Anaerobic Sludge Blanket (UASB) reactor, an anaerobic baffled reactor, or a covered anaerobic lagoon, works in the absence of oxygen. The microbial consortium in these systems, dominated by methanogens and other strict anaerobes, can achieve COD reductions in the range of 60% to 85% on high-strength effluents before the stream even reaches the aerobic stage. (Note: These are general performance ranges; actual values vary based on specific ETP configurations and effluent characteristics.)
The strategic advantage of the anaerobic process goes beyond COD reduction:
- Energy recovery: Biogas produced during anaerobic digestion, primarily methane, can be captured and used for thermal energy generation within the plant. For a mid-sized distillery or food processing unit, this can meaningfully offset fuel costs.
- Lower sludge yield: Anaerobic systems generate significantly less biological sludge per unit of COD removed compared to aerobic systems. For a plant struggling with ETP sludge volumes, this is a major operational relief.
- Lower energy input: No aeration is required, making the operating cost per kg of COD removed considerably lower than aerobic alternatives.
The challenge with anaerobic systems, particularly in the Indian context, is stability. Methanogenic organisms are sensitive to temperature fluctuations, pH swings, and shock loads from process upsets. During the winter months in North India, in industrial belts like Ludhiana, Panipat, or Kanpur, falling ambient temperatures can significantly suppress methanogenic activity, leading to incomplete treatment and effluent quality failures.
This is where microbial augmentation becomes critical. By regularly dosing with cold-adapted, pre-acclimatised anaerobic consortia, plant operators can maintain treatment efficiency even during seasonal temperature drops without costly reactor heating investments.
The Aerobic Stage: Polishing, Nitrification, and Final BOD Removal
The aerobic biological treatment stage that follows anaerobic pre-treatment is responsible for polishing the effluent to discharge standards. Here, aerobic heterotrophs consume the residual dissolved organics, while nitrifying bacteria convert ammonia nitrogen, a critical parameter for many pharma and fertilizer industry effluents, into nitrate.
Aerobic systems, particularly Activated Sludge Process (ASP) and Sequential Batch Reactors (SBR), are well established in Indian industrial ETPs. The challenge is that they are frequently under-performing not because of design flaws but because of microbial ecosystem collapse, caused by toxic shock loads, antibiotic carry-through in pharmaceutical effluents, excessive chemical dosing upstream, or simply ageing sludge that has lost microbial diversity.
A bioaugmentation approach, introducing targeted aerobic consortia with specific metabolic capabilities, can restore a struggling aerobic stage within days rather than weeks. We have worked with plants in Surat’s textile cluster where aerobic SBR systems had essentially stopped functioning after a production change introduced a new dye chemistry. Conventional approaches would have required weeks of re-seeding and gradual re-acclimation. Targeted microbial cultures, matched to the new dye matrix, restored performance in a fraction of that time.
ETP Sludge Management: The Transition from Disposal Mindset to Digestion Strategy
Let us talk about sludge, the topic that makes most plant managers quietly uncomfortable.
ETP sludge is the concentrated residue of everything your wastewater treatment system has removed from your effluent. In a conventional chemical-physical ETP, this sludge is chemical in nature: it contains metal hydroxides from coagulation, precipitated salts, and whatever organic matter was not biologically treated. This sludge is expensive to dewater, expensive to transport, and increasingly expensive to dispose of, since many traditional disposal routes are being restricted or eliminated by regulatory action.
Why Conventional Sludge Disposal Is Becoming Untenable
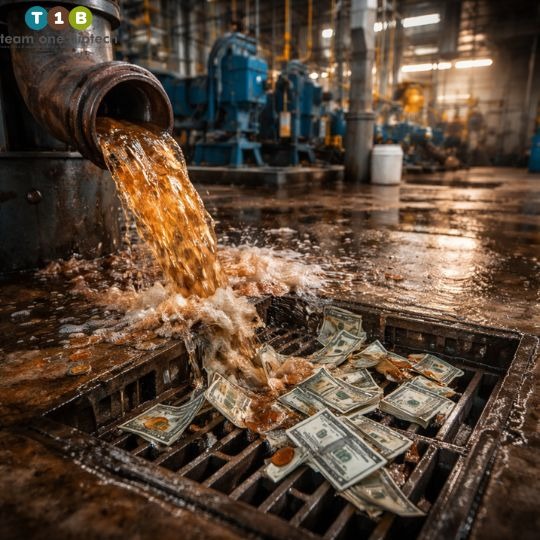
Consider the cost structure of sludge disposal for a mid-sized industrial plant in India today:
- Filter press or centrifuge operation (electricity, maintenance, consumables)
- Transportation to a Common Hazardous Waste Treatment, Storage, and Disposal Facility (TSDF)
- TSDF tipping fees, which have risen sharply
- Internal manpower for handling, documentation, and manifesting
- Compliance and record-keeping under the Hazardous and Other Wastes Rules
For plants generating several tonnes of wet sludge per day, these combined costs can represent a significant proportion of total wastewater treatment OPEX, often in the range of 30% to 50% of total ETP operating expenditure. (Note: These are general performance ranges; actual values vary based on specific ETP configurations and effluent characteristics.)
And here is the regulatory reality: the CPCB is actively tightening oversight of TSDF facilities, and the days of inexpensive, undocumented sludge disposal are definitively over. For industries that have been implicitly relying on low-cost sludge dump arrangements, the risk exposure is now substantial.
Microbial Digestion: A Fundamental Rethink of ETP Sludge
The biological alternative to mechanical-chemical sludge management is microbial digestion, the use of specialised sludge-digesting microbial consortia to actively break down and reduce sludge volume within the ETP itself.
Here is the mechanism: sludge, both primary and secondary (biological), is largely composed of organic matter, bacterial cell mass, adsorbed organics, and residual food substrates. Targeted sludge-digesting microorganisms, primarily hydrolytic and fermentative bacteria capable of consuming bacterial cell walls and complex organics, can be dosed directly into sludge holding tanks, sludge digesters, or even back into the aeration tank of an ASP to achieve what is called “sludge bulking reduction” or “in-situ sludge digestion.”
The results, when properly implemented:
- Wet sludge volume reduction in the range of 25% to 50%, reducing dewatering load and transportation frequency.
- Improved sludge settleability, which can directly improve the performance of secondary clarifiers and reduce the incidence of sludge bulking, a chronic problem in many Indian ASP-based ETPs.
- Reduction in the Sludge Volume Index (SVI), improving effluent quality from clarifiers.
- In systems with dedicated sludge digesters, potential for biogas capture and energy recovery.
(Note: These are general performance ranges; actual values vary based on specific ETP configurations and effluent characteristics.)
For a tannery in Kanpur’s Jajmau area, one of India’s most environmentally scrutinised industrial clusters, a significant reduction in sludge output is not just an OPEX issue. It is an existential compliance issue. The same applies to the pharmaceutical formulation and API clusters around Hyderabad, where effluent treatment performance is directly tied to export certifications and global regulatory audits.
Sludge Treatment ROI: The Business Case for Biological Intervention
Let us move from science to economics, because ultimately, every decision in an industrial plant comes back to the balance sheet.
Comparing OPEX: Biological Treatment vs. Chemical-Dominated Treatment
A conventional chemical treatment approach to industrial effluent, relying primarily on coagulants, flocculants, pH adjustment chemicals, and oxidising agents, works. It can produce compliant effluent. But it is expensive, it is chemical-input dependent, and it generates large volumes of chemical sludge that require disposal.
Biological treatment, particularly when it incorporates targeted microbial augmentation, fundamentally changes the cost structure:
Chemical inputs: Properly functioning biological treatment systems require less coagulant and flocculant, because a significant proportion of the dissolved organics have already been consumed by microorganisms rather than precipitated as chemical floc. Plants that have transitioned from chemical-dominant to biology-first treatment approaches have typically seen chemical input costs reduce in the range of 20% to 45% over a 12-month operating period. (Note: These are general performance ranges; actual values vary based on specific ETP configurations and effluent characteristics.)
Energy costs: This is nuanced. Aerobic biological treatment requires aeration energy. However, when paired with an upstream anaerobic process that reduces COD load before the aerobic stage, the net aeration energy required is substantially lower than an aerobic-only system treating the full load. Additionally, biogas recovery from anaerobic digesters can offset significant energy costs.
Sludge disposal costs: This is often where the most dramatic OPEX reduction occurs. A well-managed biological ETP, with active sludge digestion, can reduce sludge output volumes sufficiently to meaningfully reduce TSDF disposal trips, transportation costs, and tipping fees. When sludge disposal was costing a plant a significant monthly sum, even a 30% reduction in sludge volume translates directly to substantial savings.
Compliance risk costs: This is the cost that does not appear on most OPEX spreadsheets but is arguably the most significant. A non-compliant ETP means the risk of closure notices, production shutdowns, penalty orders, and reputational damage that affects customer and banking relationships. A reliable, biologically stable ETP reduces this risk substantially.
The Microbial Augmentation Investment: Putting It in Perspective
Plant managers sometimes hesitate at the cost of specialised microbial cultures. This is understandable, they are not a commodity like lime or polyelectrolyte, and their mode of action is less immediately visible.
Here is the framing we offer to every CXO we speak with: microbial augmentation is not a cost. It is an insurance premium with a positive return. When the alternative is a shutdown notice, an emergency chemical dosing spike, or a sludge disposal crisis, the cost of a monthly microbial culture programme is, in most cases, a fraction of the risk it is mitigating.
The Indian Climate Challenge: Managing Microbial Performance in Variable Conditions
This is a dimension of bioremediation that does not receive enough attention in standard technical literature, most of which is written in temperate climates.
India’s industrial geography spans dramatically different climatic conditions. A paper mill in Bhadrachalam operates in humid, tropical conditions. A textile unit in Ludhiana faces freezing winter temperatures. A chemicals plant in Rajasthan manages extreme dry heat. Each of these conditions affects microbial activity in different ways.
High temperatures (above 40 degrees Celsius, common in Indian summers) can actually accelerate biological treatment rates, but they can also push mesophilic organisms past their optimal range and cause oxygen depletion in aerobic tanks, particularly when dissolved oxygen control systems are inadequate.
Low temperatures (common in North Indian winters) suppress microbial enzyme activity, slow metabolic rates, and can cause an apparent “crash” in biological treatment performance, COD removal drops, sludge settleability worsens, and plant managers see deteriorating effluent quality that does not respond to the usual operational adjustments.
Monsoon season brings dilution effects, hydraulic surges that wash biomass out of reactors, and sudden changes in effluent composition as production patterns shift.
At Team One Biotech, we formulate and supply microbial cultures that are specifically adapted to Indian climatic conditions, including thermotolerant strains for high-temperature applications and cold-adapted consortia for winter resilience. This local adaptation is not a marketing claim. It is an engineering requirement.
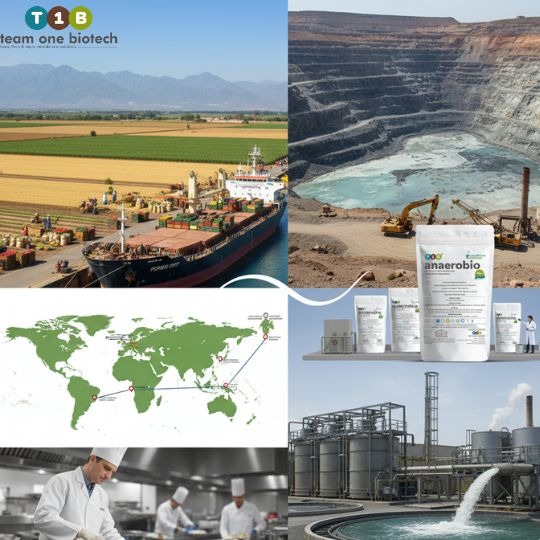
Sector-Specific Insights: What Works Where
Textile Industry (Tirupur, Surat, Panipat)
Textile effluents are among the most challenging for biological treatment, high colour, high TDS, variable COD, and frequently toxic dye intermediates. The key is a consortium approach: azoreductase-producing anaerobes for colour removal in the first stage, followed by aerobic polishing for residual COD and BOD.
Common industry pain point: Colour pass-through in the final effluent, even when COD is compliant. A targeted microbial approach specifically addresses the colour-bearing molecular fraction that conventional treatment misses.
Pharmaceutical Industry (Hyderabad, Baddi, Ahmednagar)
API and formulation effluents often contain trace antibiotics and active compounds that are acutely toxic to standard wastewater organisms. Bioaugmentation with resistant, specially adapted consortia that can tolerate and degrade these compounds is essential. Standard activated sludge systems in pharma ETPs are chronically underperforming because their microbial populations have been repeatedly stressed by toxic slug loads.
Tanneries (Kanpur, Vellore, Jalandhar)
High chromium, high sulphide, and high protein loads make tannery effluent one of the most complex treatment challenges in Indian industry. Sulphide-oxidising bacteria, chromium-tolerant heterotrophs, and collagen-degrading enzymes are all part of a tannery-specific biological treatment protocol. ETP sludge from tanneries also carries specific regulatory burdens, making sludge volume reduction particularly valuable.
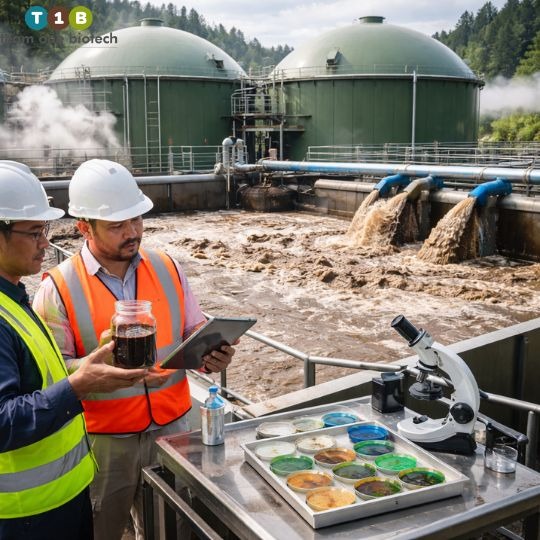
What a Transition to Advanced Bioremediation Looks Like in Practice
We want to be realistic about this. Transitioning from a chemical-heavy ETP operation to a biology-first approach does not happen overnight, and it requires genuine operational commitment. Here is a realistic outline of how we approach it with clients:
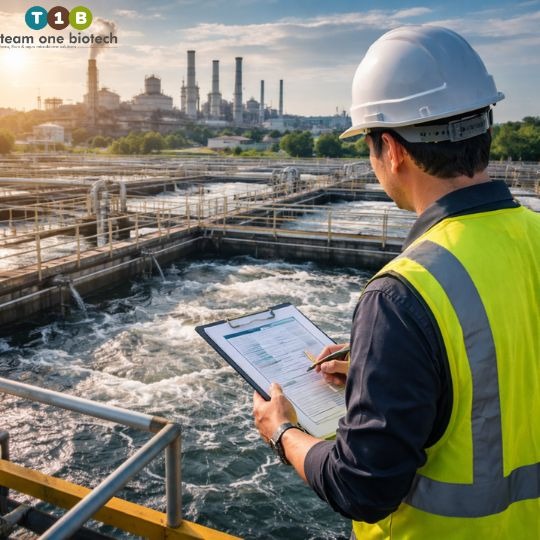
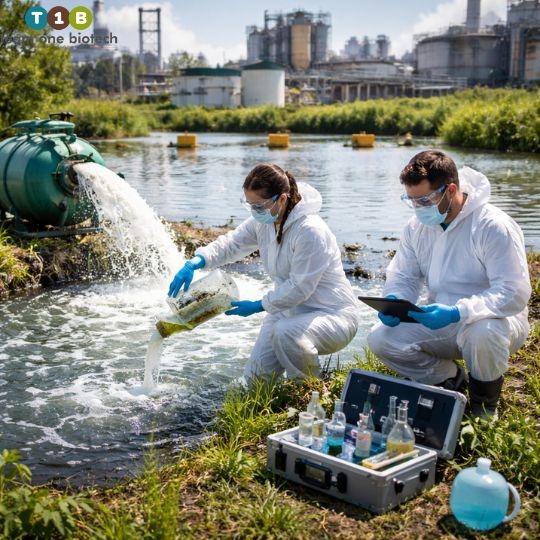
- Baseline ETP audit: Detailed characterisation of the existing system, reactor volumes, hydraulic retention times, existing microbial health (if any), effluent variability, and current OPEX breakdown.
- Effluent characterisation: Comprehensive lab analysis of the specific effluent matrix, not just standard parameters but molecular-level characterisation of the organic load.
- Culture selection and formulation: Based on the audit and effluent analysis, selection or custom formulation of the appropriate microbial consortium, anaerobic, aerobic, or combined, with specific strain selection for the industry type and climate zone.
- Staged implementation: Introduction of microbial cultures in a controlled, phased manner, with continuous monitoring of key performance indicators, COD, BOD, SVI, DO levels, and effluent quality.
- Performance optimisation: Ongoing monitoring, culture top-up, and protocol adjustment over a 90-day to 180-day optimisation period.
- Sustainable maintenance programme: A long-term culture maintenance and monitoring protocol that keeps the biological system in peak condition across seasonal changes and production variations.
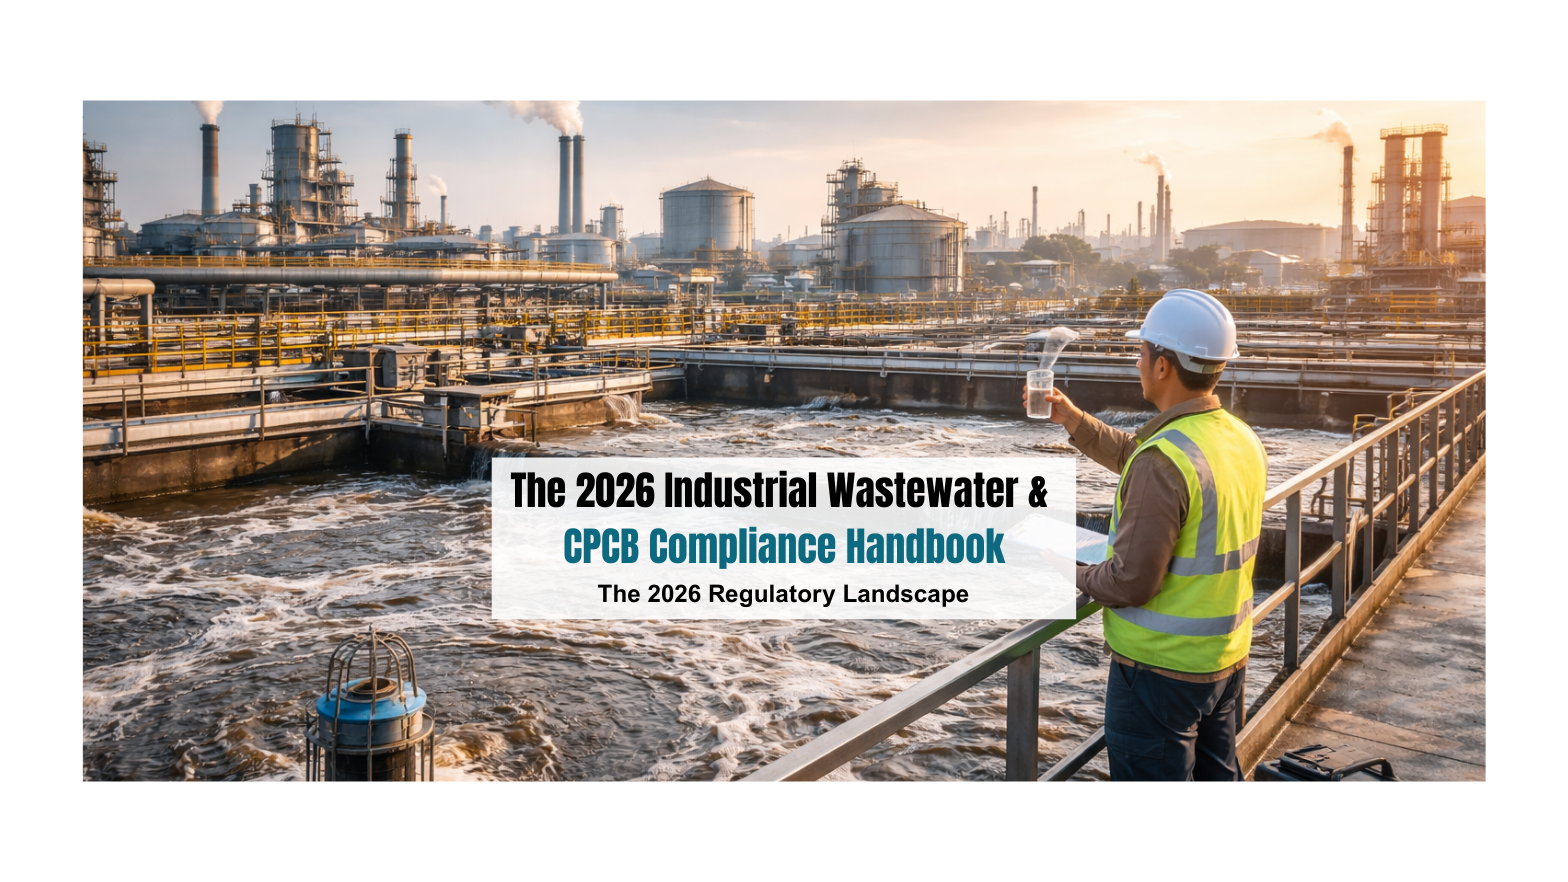
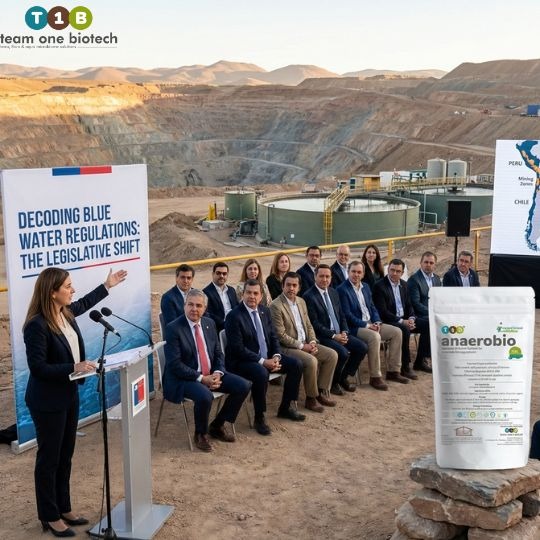
The Compliance Dimension: CPCB and SPCB in a Tightening Regulatory Environment
We would be doing a disservice to our readers if we did not address the regulatory context directly.
The CPCB’s recent emphasis on real-time ETP monitoring for large industries, combined with state-level enforcement actions that have resulted in plant closures in sectors from textiles to pharma, means that ETP performance is no longer just an operational metric. It is a boardroom issue.
The industries most exposed are those with large ETP footprints that have historically relied on dilution, chemical treatment shortcuts, or irregular monitoring rather than genuine treatment performance. As online monitoring becomes mandatory for more categories of industries, the margin for underperformance shrinks to zero.
A biologically stable, properly augmented ETP is inherently more resilient, it self-corrects to some degree, it does not have the batch-to-batch variability of chemical dosing, and it generates a continuous biological data record of treatment performance that can support compliance documentation.
Three Ways to Start Working With Team One Biotech
You have read this far, which tells us something: you are taking your ETP’s biological performance seriously. That is the right instinct. Here is how we can help you move from reading to action.
Our team of environmental engineers and microbiologists will visit your facility, assess your existing ETP configuration, review your current effluent data and compliance status, and provide a detailed assessment of where biological treatment optimisation can deliver the greatest operational and financial benefit. There is no obligation, and the insights alone are worth the conversation.
Contact Team One Biotech today to schedule your site audit. Mention this article and we will prioritise your slot.
We have compiled a detailed technical reference document covering microbial consortia selection, anaerobic and aerobic system design principles, ETP sludge reduction strategies, and sector-specific case study data from Indian industrial applications. It is the document we wish had existed when we started doing this work.
Request the whitepaper from our team at Team One Biotech, it is available to ETP operators and industrial decision-makers at no cost.
Book a Technical Consultation With Our Engineers
If you have a specific, urgent challenge, a struggling ETP, a compliance notice, a sludge disposal crisis, or a production change that has thrown your biological treatment system out of balance, book a direct consultation with one of our senior engineers. We will review your data, ask the right questions, and give you a frank assessment of what is happening and what can be done about it.
Reach out to Team One Biotech directly. Our engineers are on the ground across India and can engage with your team quickly.
The Organisms Are Already on Your Side
Here is something worth sitting with: the microbial world is not your adversary in waste management. Billions of years of evolution have produced organisms capable of breaking down nearly every organic compound that industrial processes generate. The question is not whether biology can handle your effluent. The question is whether you have the right organisms, in the right configuration, in the right conditions, doing the right work.
That is what advanced bioremediation is. It is not magic. It is not a shortcut. It is applied microbiology, rigorous, measurable, and when done right, transformative for both your operations and your environmental legacy.
We are ready to help you get there.
Looking to improve your ETP/STP efficiency with the right bioculture?
Talk to our experts at Team One Biotech for customised microbial solutions.
Contact: +91 8855050575
Email: sales@teamonebiotech.com
Visit: www.teamonebiotech.com
Discover More on YouTube – Watch our latest insights & innovations!-
Connect with Us on LinkedIn – Stay updated with expert content & trends!