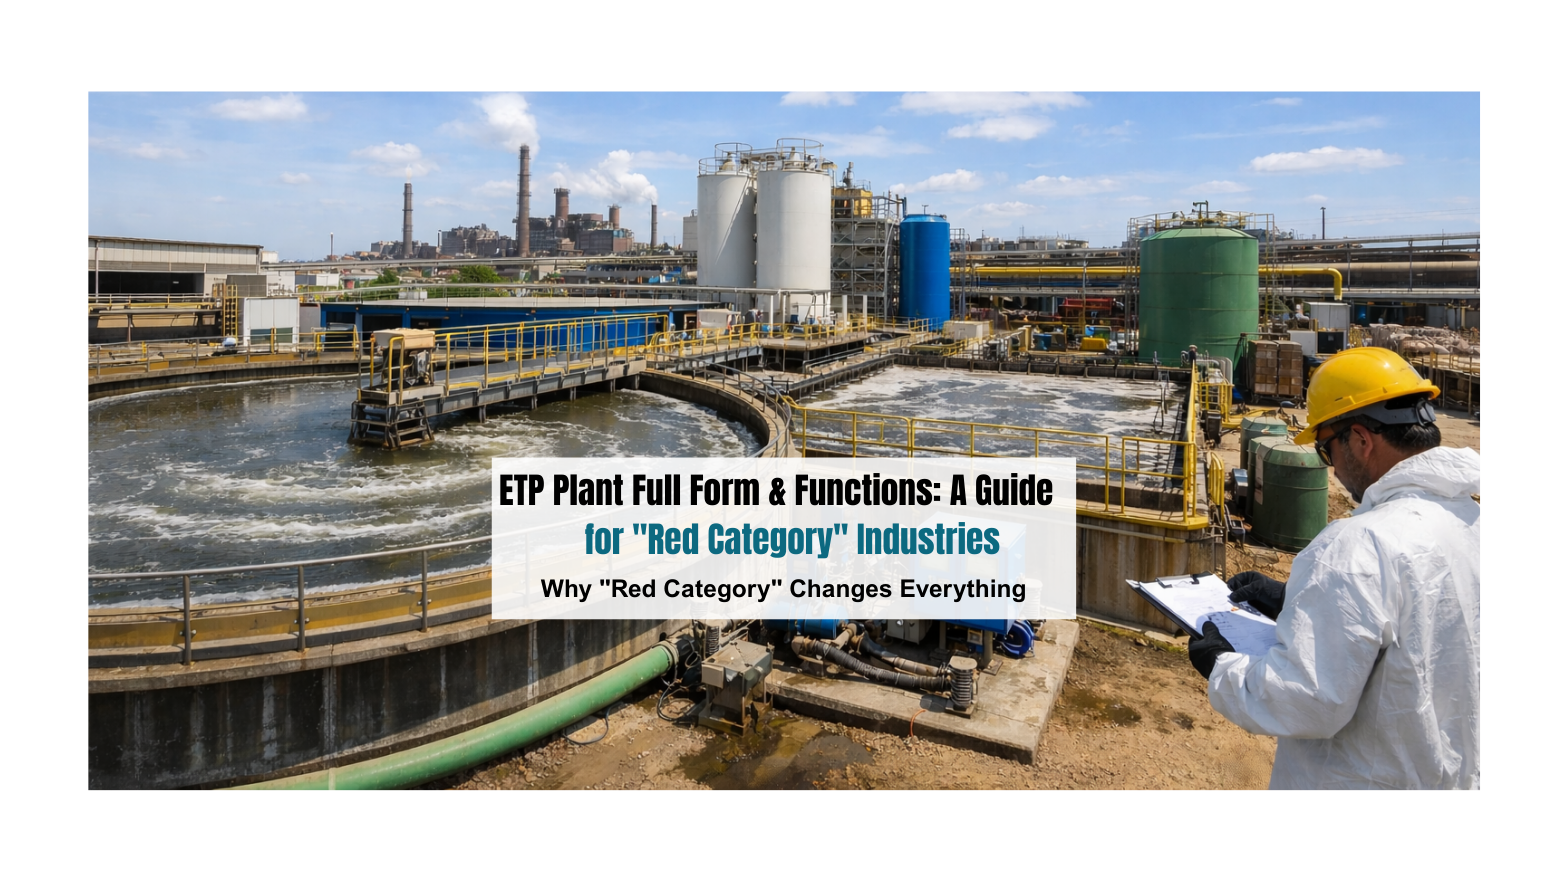
ETP Plant Full Form & Functions: A Guide for “Red Category” Industries
Let’s be direct about something most plant managers already know but rarely say out loud: running a Red Category industry in India right now feels like walking a tightrope over a compliance minefield. One failed effluent test. One surprise inspection from the State Pollution Control Board. One local news story about a nearby river turning colors, and suddenly you’re not just facing a fine. You’re facing a closure notice, a reputational crisis, and the kind of legal liability that follows a business for years.
This isn’t fearmongering. The Central Pollution Control Board (CPCB) has been systematically tightening discharge standards since 2016, and enforcement has become significantly more aggressive in states like Maharashtra, Gujarat, Tamil Nadu, and Uttar Pradesh. The industries feeling this pressure the hardest are exactly the ones doing the heaviest industrial lifting for India’s economy, textiles, dyes, pharmaceuticals, tanneries, paper mills, and chemical manufacturers.
Also Read: The Comprehensive Guide to ETP & STP Design, Process, and Efficiency in India
If you’re in this space, your Effluent Treatment Plant isn’t just infrastructure. It’s survival equipment.
What ETP Stands For, And Why the Full Form Doesn’t Tell the Whole Story
ETP stands for Effluent Treatment Plant. The name is simple enough. The reality it represents is anything but.
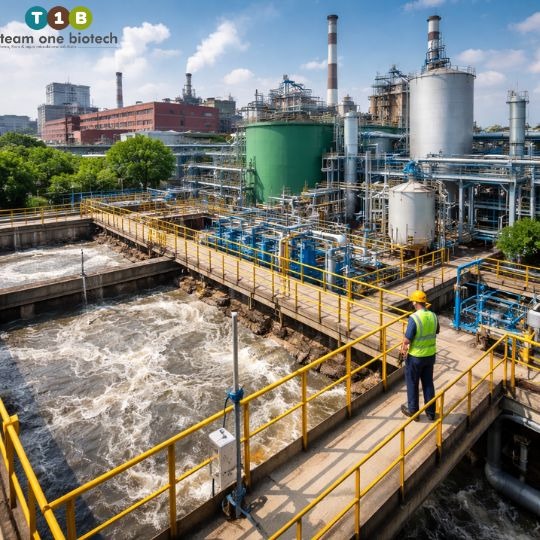
An effluent treatment plant is a system specifically engineered to treat industrial wastewater, the contaminated water produced during manufacturing processes, before it’s discharged into municipal drains, water bodies, or the ground. Unlike domestic sewage, industrial effluent carries a toxic cocktail of heavy metals, synthetic dyes, suspended solids, oils, acids, and biological oxygen demand (BOD) loads that can devastate aquatic ecosystems within hours of improper discharge.
Here’s what the full form doesn’t tell you: a well-designed ETP is the difference between a factory that runs for decades and one that gets served a closure notice in its tenth year. For Red Category industries, it’s also the single largest variable in your environmental compliance score.
Why “Red Category” Changes Everything
India’s industries are classified into four pollution potential categories by the CPCB, Red, Orange, Green, and White, based on a Pollution Index (PI) score derived from air, water, land, and hazardous waste parameters.
Red Category industries carry a Pollution Index of 60 or above. These include:
- Textile dyeing and bleaching units
- Pharmaceutical and bulk drug manufacturers
- Pesticide and agrochemical plants
- Tanneries and leather processing units
- Paper and pulp mills
- Chemical manufacturers and dye intermediates
What makes Red Category wastewater genuinely difficult to treat is its chemical complexity. You’re not dealing with one pollutant, you’re dealing with hundreds simultaneously. COD (Chemical Oxygen Demand) levels in textile effluent can exceed 3,000 mg/L. Pharmaceutical wastewater often carries recalcitrant organic compounds that resist conventional biological breakdown. Tannery effluent contains chromium concentrations that are acutely toxic to both microbial communities and human health.
Standard treatment approaches frequently fall short here. That’s the core problem Team One Biotech was built to solve.
The Core Functions of an Effluent Treatment Plant
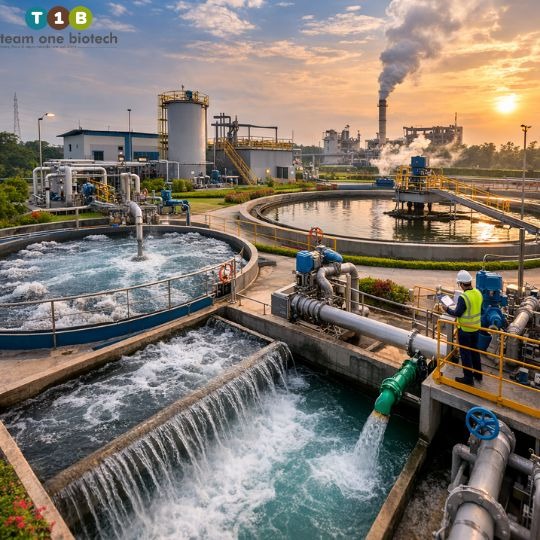
A properly functioning ETP works through a staged sequence of treatment processes. Each stage targets a different category of contaminants. Skipping or underperforming at any stage compromises the entire system.
Stage 1: Collection and Equalization
Effluent from different process lines rarely flows at uniform rates or concentrations. The equalization tank buffers this variability, holding incoming wastewater and homogenizing it before treatment begins. This step protects downstream processes from hydraulic shocks and concentration spikes that would otherwise destabilize biological treatment.
Stage 2: Screening and Primary Treatment
Bar screens remove coarse solids. Primary clarifiers allow suspended particles to settle under gravity. The sludge collected here is removed for further processing. This stage significantly reduces suspended solids load before biological treatment begins.
Stage 3: Neutralization
Industrial effluents are frequently highly acidic or alkaline, pH values outside the 6–9 range are common in chemical and pharmaceutical plants. Neutralization brings pH to a range where biological treatment can function effectively. Getting this wrong doesn’t just affect compliance, it kills the microbial communities your secondary treatment depends on.
Stage 4: Coagulation and Flocculation
Chemicals like alum, ferric chloride, or polyelectrolytes are dosed to destabilize colloidal particles and cause them to aggregate into larger flocs that can be physically removed. This step is critical for reducing color, turbidity, and residual suspended solids. However, heavy reliance on synthetic coagulants increases sludge generation and chemical costs, one of the key pain points that bioremediation-based approaches address.
Stage 5: Secondary (Biological) Treatment
This is where the real heavy lifting happens, and where the quality of your approach determines whether you genuinely treat your effluent or merely appear to.
The ETP-STP Plant Process: Where Bioremediation Redefines What’s Possible
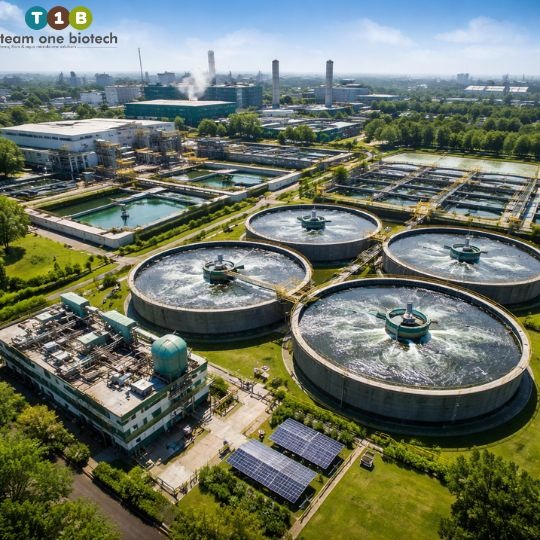
The biological treatment stage of the etp-stp plant process is built around one central mechanism: using microorganisms to break down dissolved organic matter. The most widely deployed method is the activated sludge process.
Understanding the Activated Sludge Process
In the activated sludge process, wastewater enters an aeration tank where it’s mixed with a recirculated mass of microorganisms, the “activated sludge.” Air or oxygen is continuously introduced to support aerobic microbial metabolism. The microorganisms consume dissolved organics (measured as BOD and COD), converting them into carbon dioxide, water, and new cell mass.
The treated water then flows to a secondary clarifier, where the microbial biomass settles out. A portion of this settled sludge is returned to the aeration tank to maintain the active microbial population (return activated sludge). The remainder is wasted (waste activated sludge) for further processing.
In theory, it’s elegant. In practice, for Red Category industries, it frequently underperforms, because generic microbial communities aren’t equipped to handle the specific, often toxic, organic load of pharmaceutical, textile, or chemical wastewater.
Where Traditional Chemical Treatment Falls Short
Many plants default to increasing chemical dosing when biological treatment underperforms. This approach has a ceiling. More coagulants mean more sludge. More sludge means higher disposal costs and stricter hazardous waste compliance requirements. The operational cost curve bends upward fast, and you still don’t consistently hit discharge standards.
How to Retrofit Existing ETPs to meet 2026 Discharge Standards
With the 2026 regulatory shift to Retrofit Existing ETPs, the Central Pollution Control Board (CPCB) and State Boards have moved from “periodic checks” to real-time, performance-based compliance. If your existing ETP was designed for 2016 norms, it likely lacks the precision required for today’s tighter BOD, COD, and nutrient limits.
Retrofitting doesn’t always mean a total teardown. Most Red Category plants can be brought up to 2026 standards through strategic engineering upgrades:
- Integrating Real-Time Monitoring: 2026 mandates require IoT-connected sensors (RS-485/Modbus) that transmit pH, TSS, and COD data directly to regulatory servers. Retrofitting your outlet with automated monitoring is now the first step in legal “survival.”
- Upgrading Aeration Efficiency: Many older plants suffer from “dead zones” in aeration tanks. Replacing aging surface aerators with fine-bubble diffused aeration systems can improve oxygen transfer efficiency by up to 30-40%, crucial for handling the higher organic loads seen in pharmaceutical and textile sectors.
- Adding Tertiary Polishing Units: To meet the new “Mandatory Treated Water Reuse” policies, adding a modular Membrane Bio-Reactor (MBR) or Ultrafiltration (UF) stage to your existing secondary clarifier output can turn discharge-grade water into process-grade water.
By focusing on process correction rather than just equipment replacement, industries can achieve 2026 compliance with minimal downtime and significantly lower capital expenditure.
How Team One Biotech’s Bioremediation Approach Changes the Equation
Team One Biotech’s bioremediation solutions are engineered around specific microbial consortia, selected and cultivated strains of bacteria, fungi, and enzyme-producing organisms that are matched to the actual contaminant profile of your effluent.
Rather than a generic activated sludge population struggling against recalcitrant dyes or pharmaceutical intermediates, you’re deploying organisms that have been specifically developed to metabolize those compounds. The results are measurable:
- Faster COD/BOD reduction rates compared to conventional activated sludge alone
- Significantly lower chemical consumption across coagulation and disinfection stages
- Reduced sludge generation, which directly reduces your hazardous waste disposal burden
- More stable biological performance during hydraulic and organic load fluctuations
- Longer intervals between system interventions
This isn’t an additive that temporarily masks compliance numbers. It’s a fundamental upgrade to the biological core of your treatment process.
Ready to see what a bioremediation-optimized ETP looks like for your specific industrial category? Contact Team One Biotech’s technical team for a process consultation, no generic proposals, no guesswork.
STP vs. ETP: Why Industrial Facilities Need to Think About Both
A sewage treatment plant (STP) is designed to treat domestic wastewater, the water generated from toilets, canteens, washrooms, and general facility use. An effluent treatment plant handles process wastewater from manufacturing operations. They treat fundamentally different waste streams, and mixing them without proper management creates compliance complications.
Here’s why this matters for large industrial facilities:
| Parameter | Sewage Treatment Plant (STP) | Effluent Treatment Plant (ETP) |
| Wastewater Source | Domestic/sanitary use | Industrial process water |
| Primary Contaminants | BOD, pathogens, nutrients | COD, heavy metals, dyes, chemicals |
| Regulatory Standard | IS:2490, domestic norms | CPCB category-specific norms |
| Treatment Core | Biological (ASP, MBR) | Multi-stage chemical + biological |
| Sludge Classification | General waste | Often hazardous waste |
Many large manufacturing campuses in India, particularly in pharmaceutical and textile clusters, now operate combined STP-ETP systems or segregated parallel systems. The etp-stp plant process integration requires careful hydraulic design to ensure that the toxicity of process effluent doesn’t overwhelm the biological system designed for domestic sewage.
Team One Biotech’s expertise spans both systems. Whether you’re managing a standalone ETP, a standalone STP, or a combined treatment facility, the bioremediation strategy must be designed around the actual influent chemistry, not generic assumptions.
The Indian Regulatory Reality You Can’t Ignore
The CPCB’s General Standards for Discharge of Environmental Pollutants (under the Environment Protection Act, 1986) set baseline discharge standards. But State Pollution Control Boards frequently impose standards that are stricter than CPCB minimums, and this varies significantly by state, industry cluster, and proximity to sensitive water bodies.
Industries in the Ganga basin face mandatory Zero Liquid Discharge (ZLD) compliance under the National Mission for Clean Ganga. Textile clusters in Surat, Ludhiana, and Tirupur operate under cluster-specific discharge protocols. Pharmaceutical units near ecologically sensitive zones are increasingly being asked to demonstrate advanced treatment capability beyond standard compliance testing.
This regulatory landscape is not getting simpler. Investment in genuinely effective treatment technology, not minimum-compliance infrastructure, is the only position that offers long-term operational certainty.
India’s water stress context adds an ethical dimension to this that goes beyond compliance. With 18% of the world’s population sharing 4% of its freshwater resources, every liter of adequately treated and recycled industrial water is a direct contribution to a problem that affects communities far beyond your fence line.
What an Underperforming ETP Actually Costs You
The compliance fine is the visible cost. The real cost structure looks like this:
- Repeated third-party effluent testing to chase passing results
- Increased chemical consumption without proportional treatment improvement
- Higher sludge disposal frequency and associated hazardous waste costs
- Downtime risk from regulatory notices requiring system upgrades
- Reputational exposure in ESG-sensitive supply chains
- Management bandwidth spent on regulatory responses instead of operations
A properly designed, bioremediation-enhanced ETP converts most of these costs into a single, predictable operational line. That’s the business case, separate from the environmental one.
Is your current ETP delivering consistent compliance, or are you managing the gap between test days and inspection days? Request a free process audit from Team One Biotech. We’ll map your current system against your discharge obligations and identify exactly where the gaps are.
Looking for specific bioremediation products formulated for your industry category? Explore Team One Biotech’s complete range of microbial consortia and enzyme solutions for textile, pharmaceutical, chemical, and tannery wastewater treatment.
Looking to improve your ETP/STP efficiency with the right bioculture?
Talk to our experts at Team One Biotech for customised microbial solutions.
Contact: +91 8855050575
Email: sales@teamonebiotech.com
Visit: www.teamonebiotech.com
Discover More on YouTube – Watch our latest insights & innovations!-
Connect with Us on LinkedIn – Stay updated with expert content & trends!
