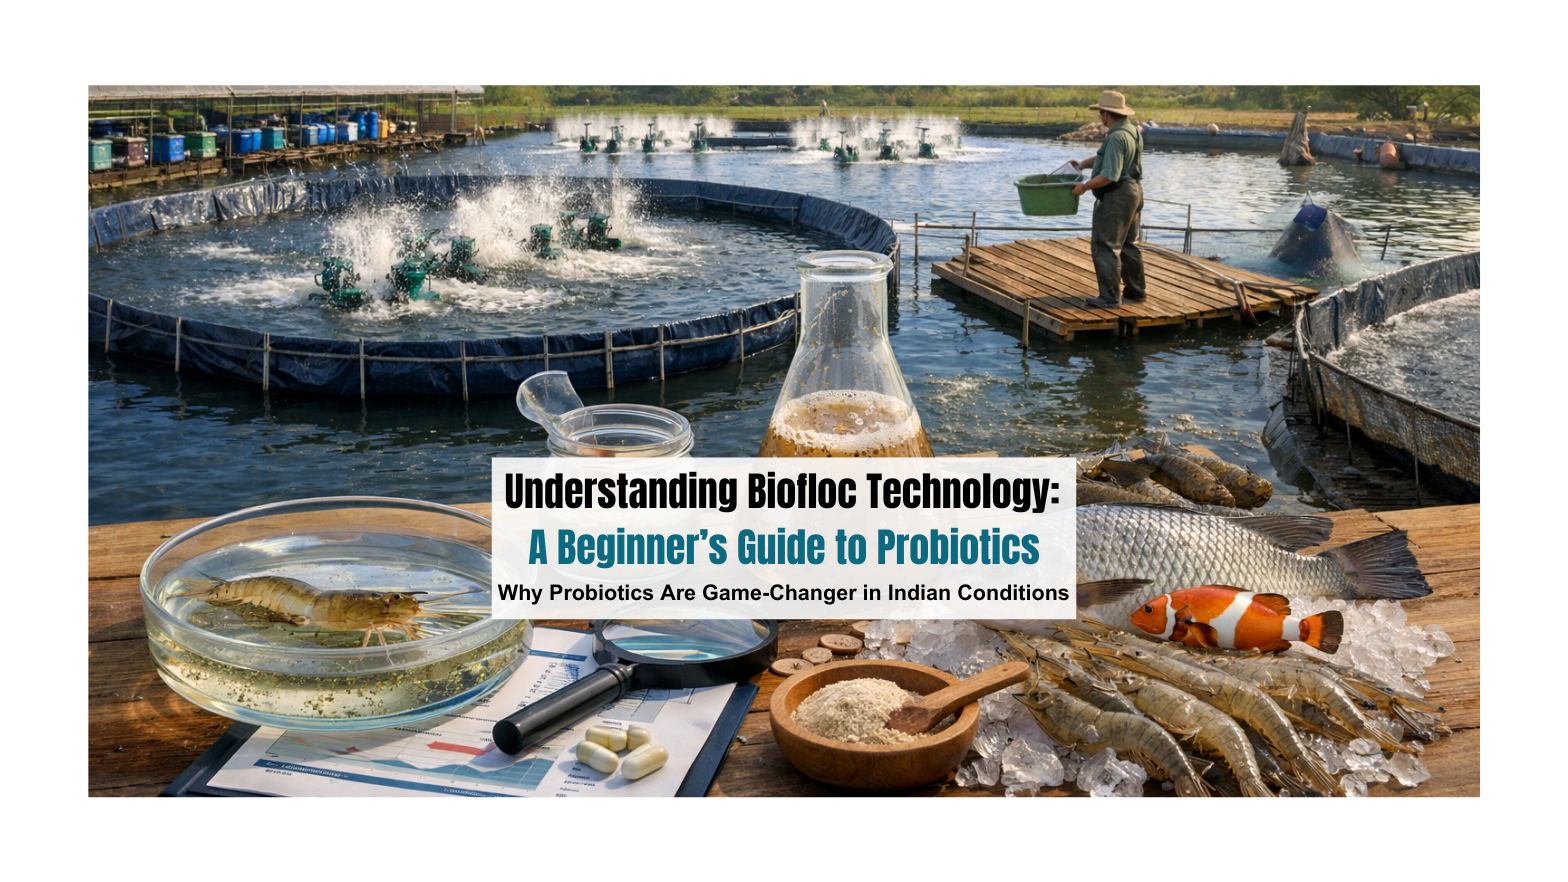
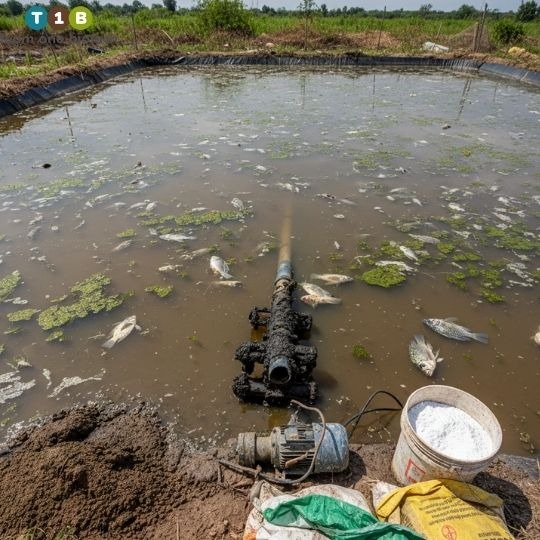
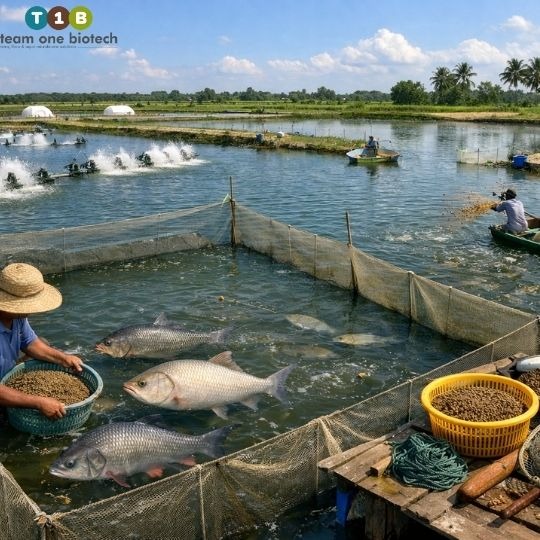
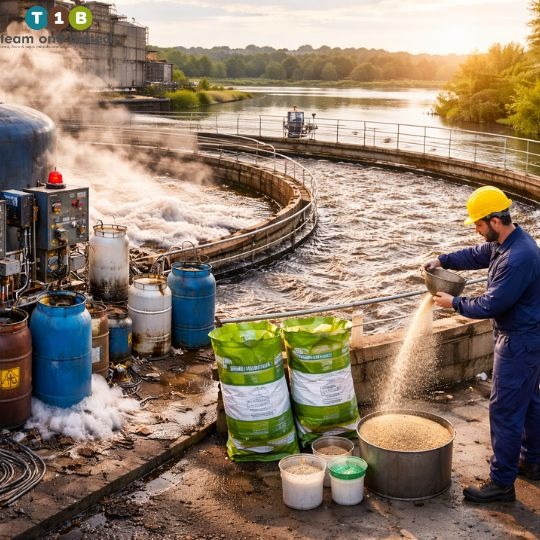
Arvind had been running his shrimp farm in coastal Andhra Pradesh for seven years. He knew every corner of his 2-acre operation, understood the feeding patterns of his Litopenaeus vannamei, and had weathered several challenging seasons. But nothing prepared him for what happened on that humid July morning.
When he arrived at the farm at 5:30 AM for routine checks, something felt wrong. The water looked cloudy, different from the usual greenish tinge. By 8 AM, his shrimp were gasping at the surface. By noon, he had lost nearly 40% of his stock. The culprit? An ammonia spike that went from barely detectable to lethal in less than 48 hours. That single event cost him ₹18 lakhs.
This nightmare scenario plays out across Indian aquaculture farms more often than most would admit. Traditional pond systems operate on a razor’s edge, one bacterial imbalance, one sudden temperature shift, one overfeeding mistake can cascade into catastrophic losses. But there’s a biological shield that’s transforming how forward-thinking farmers protect their investment: Biofloc Technology powered by strategic probiotic management.
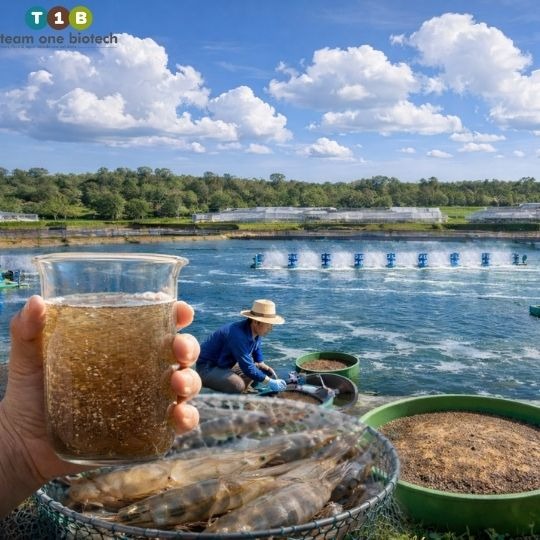
Biofloc Technology (BFT) represents a paradigm shift from traditional aquaculture systems. Instead of constantly flushing out waste products through water exchange, BFT harnesses the power of beneficial microbial communities to convert toxic metabolites into protein-rich microbial biomass, right inside your pond.
Think of it as creating a living, breathing biological factory within your water column. This factory operates 24/7, constantly purifying water while simultaneously producing supplemental nutrition for your fish or shrimp. The result? Higher stocking densities, reduced feed costs, minimal water exchange, and most importantly, a stable, disease-resistant environment that doesn’t collapse when minor variables shift.
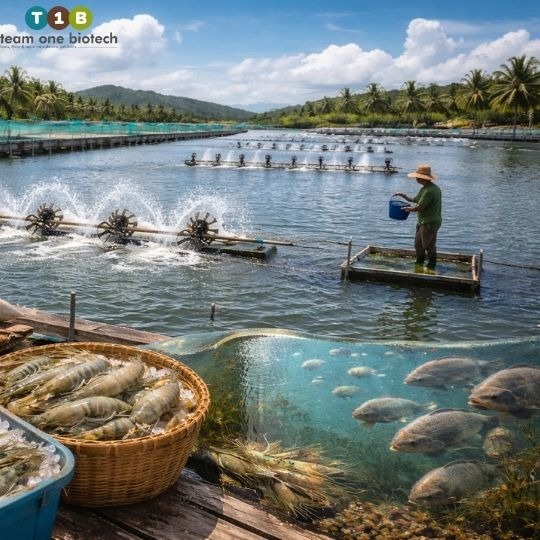
The technology isn’t just theoretical. Farmers across Tamil Nadu, Gujarat, and West Bengal are already achieving stocking densities of 150-250 shrimp per square meter in biofloc systems, compared to the 30-60 range typical in conventional ponds, while maintaining better survival rates.
The Science Behind the Shield: Understanding C/N Ratio Management
At the heart of biofloc technology lies a deceptively simple principle: the Carbon to Nitrogen ratio. But mastering this ratio is what separates struggling farmers from those consistently achieving yields above 8 tonnes per hectare per crop.
Here’s what happens in your pond every single day. Your shrimp or fish consume protein-rich feed. As they metabolize this protein, they excrete nitrogen, primarily as ammonia (NH₃). In traditional systems, this ammonia accumulates unless you perform massive water exchanges or rely on slow-acting nitrifying bacteria to convert it through the nitrogen cycle.
Biofloc takes a completely different approach. By maintaining an optimal C/N ratio of approximately 10:1 to 15:1, you create conditions that favor heterotrophic bacteria, microorganisms that reproduce 10 times faster than nitrifying bacteria and consume ammonia as a nitrogen source for their growth.
The mechanism works like this:
You add a carbon source (molasses, wheat flour, rice bran, or jaggery, all readily available in Indian agricultural markets)
Heterotrophic bacteria use this carbon along with the ammonia in your water to build their cellular biomass
These bacteria clump together with other microorganisms, forming visible “flocs” in the water column
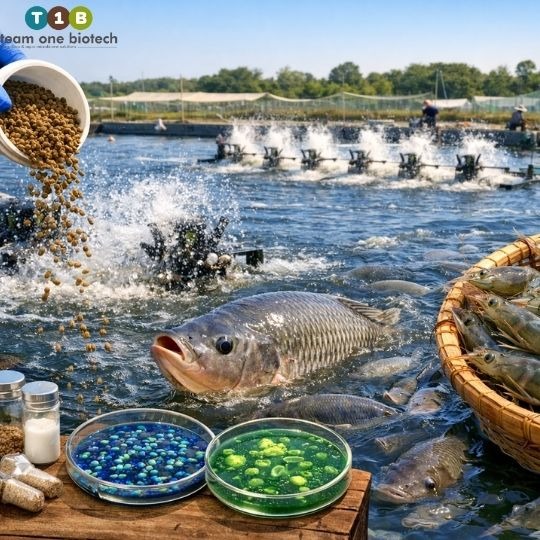
Your shrimp or fish consume these flocs as a protein-rich supplementary feed
Ammonia levels remain consistently low without water exchange
The beauty of this system is its speed. Where nitrification might take 30-40 days to establish in a new pond, a properly managed biofloc system can achieve stable ammonia control within 7-10 days.
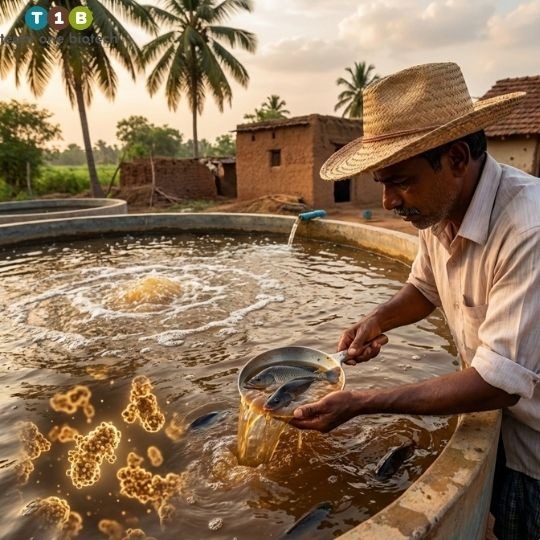
Why Probiotics Are the Game-Changer in Indian Conditions
Indian aquaculture operates under uniquely challenging conditions. Water temperatures in Punjab’s fish farms can swing from 12°C in winter to 38°C in summer. Coastal Gujarat deals with fluctuating salinity from monsoon freshwater influx. Tamil Nadu farmers contend with alkaline groundwater with pH levels often exceeding 8.5.
This is where strategic probiotic supplementation becomes essential, not optional.
Team One Biotech’s probiotic formulations are specifically engineered to address the bottlenecks Indian farmers face. These aren’t generic bacterial consortiums, they’re strain-specific solutions that accelerate floc formation, outcompete pathogenic bacteria, and remain viable across the temperature and salinity ranges typical of Indian farming conditions.
The specific benefits include:
Faster System Maturation: Proprietary Bacillus strains jumpstart heterotrophic bacterial populations, reducing the typical 15-20 day pond preparation period to just 7-10 days. For farmers operating on tight seasonal windows, this time savings translates directly to additional crop cycles per year.
Temperature Resilience: Unlike naturally occurring bacterial populations that crash when temperatures dip below 25°C or spike above 34°C, specially selected thermotolerant strains maintain activity across 18-38°C ranges, critical for farmers in North Indian regions with extreme seasonal variations.
Pathogen Suppression: Competitive exclusion is real. When beneficial bacteria dominate your pond ecosystem, harmful vibrios, aeromonas, and other pathogens simply can’t establish the population densities needed to cause disease. Field trials across Andhra Pradesh shrimp farms show 70-80% reduction in Vibrio counts within 15 days of implementing targeted probiotic protocols.
Enhanced Nutrient Cycling: Beyond ammonia control, advanced probiotic strains produce extracellular enzymes that break down organic matter, preventing sludge accumulation and maintaining optimal dissolved oxygen levels even at high stocking densities.
The Economics That Actually Make Sense for Indian Farmers
Let’s talk money, because technology only matters if it improves your bottom line.
Feed represents 55-65% of operational costs in Indian aquaculture. In a traditional vannamei shrimp farm, you might achieve a Feed Conversion Ratio (FCR) of 1.6-1.8, meaning you need 1.6-1.8 kg of feed to produce 1 kg of shrimp. With commercial feed prices ranging from ₹80-120 per kg depending on your region and protein content, this adds up fast.
Biofloc systems consistently demonstrate FCR improvements of 15-25%. The microbial protein consumed by your stock, which your shrimp graze on continuously, reduces dependence on formulated feed. Farmers implementing proper biofloc protocols with quality probiotics routinely achieve FCRs of 1.2-1.4.
On a 1-acre intensive shrimp operation targeting 10 tonnes production:
Traditional system: 16,000 kg feed × ₹100 = ₹16,00,000
Biofloc system: 12,000 kg feed × ₹100 = ₹12,00,000
Direct feed savings: ₹4,00,000 per crop
Factor in reduced water pumping costs (80-90% less water exchange), lower chemical treatment expenses (fewer disease outbreaks), and higher survival rates, and the economic case becomes compelling. The initial investment in aeration, carbon sources, and quality probiotics typically pays for itself within the first two crop cycles.
Implementing Biofloc: The Practical Roadmap
Theory means nothing without execution. Here’s what successful implementation actually looks like on the ground.
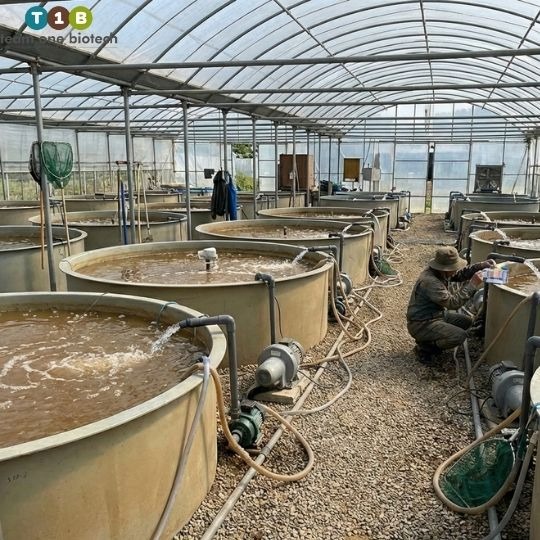
Pond Preparation Phase: Your pond needs adequate aeration, minimum 8-10 HP per acre for intensive biofloc systems. This is non-negotiable. Heterotrophic bacteria and your growing stock both consume oxygen, so dissolved oxygen levels must be maintained above 5 mg/L at all times. Many Indian farmers make the mistake of under-aerating, leading to system crashes despite perfect C/N ratios.
Biofloc Development: Ten days before stocking, fill your pond and begin carbon addition while introducing Team One Biotech’s biofloc-specific probiotic consortium. Target C/N ratio of 12:1 initially. Daily monitoring of ammonia, nitrite, and floc volume (measured using an Imhoff cone) tells you exactly when your system is mature and ready for stocking.
Stocking and Grow-Out: Post-larvae or fingerlings can be introduced when floc volume reaches 15-25 ml/L and ammonia remains below 0.5 mg/L for three consecutive days. Throughout grow-out, maintain C/N ratio through calculated carbon additions based on your feeding rate. A simple formula: for every kg of feed containing 35% protein, add approximately 0.5-0.6 kg of molasses or equivalent carbon source.
Ongoing Probiotic Supplementation: This is where many farmers falter. They establish biofloc initially but fail to maintain microbial diversity through the crop cycle. Weekly probiotic dosing at 1-2 ppm keeps beneficial bacterial populations dominant, preventing opportunistic pathogens from gaining foothold during stressful periods (full moon, weather changes, high feeding rates).
Regional Adaptations for Indian Climates
What works in Nellore won’t necessarily work in Ludhiana. Successful biofloc implementation requires regional customization.
Coastal Regions (Andhra Pradesh, Odisha, Tamil Nadu): Focus on salinity management during monsoon months. Prepare low-salinity probiotic batches for rapid response when freshwater influx occurs. Increase aeration during humid periods when oxygen solubility decreases.
Punjab and Haryana: Temperature is your primary challenge. Consider greenhouse coverings for winter crop cycles. Use cold-tolerant probiotic strains. Reduce feeding rates and carbon addition proportionally when temperatures drop below 22°C.
Gujarat and Maharashtra: Alkaline water requires pH management. Biofloc naturally buffers pH, but extreme cases may need periodic organic acid addition (commercially available products or fermented carbon sources). Salinity fluctuations in tidal areas demand flexible probiotic strategies similar to coastal Andhra.
West Bengal and Assam: Monsoon flooding risks require elevated pond construction. Heavy rainfall dilutes biofloc, have concentrated probiotic and carbon solutions ready to restore system quickly after rain events.
Common Mistakes That Destroy Biofloc Systems
Understanding failures prevents repeating them. These are the mistakes that cost Indian farmers money and faith in the technology:
Insufficient Aeration: Trying to run intensive biofloc on 4-5 HP per acre. The system will crash. Period.
Irregular Carbon Addition: Adding carbon in large, infrequent doses rather than small, calculated daily amounts. This creates feast-famine cycles for bacteria, causing population crashes and ammonia spikes.
Using Cheap, Unverified Probiotics: The market is flooded with substandard products. Cell counts on labels often bear no relation to viable bacteria in the package. Using dead or contaminated probiotics doesn’t just waste money, it can introduce pathogens.
Ignoring Water Quality Testing: Running a biofloc system without daily ammonia testing and weekly comprehensive water analysis is like driving blindfolded. You need data to make informed decisions.
Overstocking Too Soon: Greed kills. Just because biofloc supports higher densities doesn’t mean you should maximize stocking immediately. Build your experience gradually, starting at moderate densities (100-120 shrimp/m² for first crop) before pushing boundaries.
The Path Forward: Your Biological Shield Awaits
Aquaculture in India stands at a crossroads. Traditional extensive systems can’t meet growing protein demands or compete economically. Intensive systems using water exchange face regulatory pressure and environmental constraints. Biofloc technology, powered by strategic probiotic management, offers a third path, one that’s economically viable, environmentally responsible, and technically achievable for farmers willing to invest in knowledge.
The farms achieving consistent 12-15 tonne per hectare yields aren’t relying on luck. They’re applying biological principles systematically, using tools like Team One Biotech’s scientifically validated probiotic solutions to maintain the microbial ecosystem that protects their investment.
Your pond can be either a fragile ecosystem that collapses under stress, or a robust biological shield that weathers challenges while producing exceptional yields. The choice is yours, but the tools to succeed are already within reach.
Looking to improve your ETP/STP efficiency with the right bioculture? Talk to our experts at Team One Biotech for customised microbial solutions.
The Farmer’s Dilemma: Understanding the Silent Killers in Indian Aquaculture
Rajesh Kumar mortgaged his ancestral land in coastal Andhra Pradesh to construct a 1-hectare shrimp pond. For the first 45 days, everything appeared perfect. Water clarity was good, feeding response was vigorous, and survival rates exceeded 85 percent. Then, without warning, his Litopenaeus vannamei juveniles began dying at an alarming rate. Within 72 hours, he lost 60 percent of his stock. The diagnosis: acute ammonia toxicity combined with White Spot Syndrome Virus outbreak. His investment of 18 lakh rupees vanished in less than a week.
This scenario repeats itself across thousands of aquaculture farms throughout India every season. The silent killers, ammonia spikes, nitrite accumulation, pathogenic bacterial blooms, and deteriorating pond bottom conditions, destroy livelihoods with devastating efficiency. These problems share a common root cause: the breakdown of natural biological processes within the pond ecosystem.
Traditional approaches focus on reactive interventions: emergency water exchanges, chemical treatments, and antibiotic applications. These solutions provide temporary relief but fail to address underlying ecological imbalances. The accumulated organic matter from uneaten feed, fecal waste, and dead plankton creates an oxygen-depleted zone at the pond bottom. This anaerobic environment becomes a breeding ground for pathogenic bacteria while simultaneously releasing toxic compounds into the water column.
The financial implications are severe. Indian farmers typically invest between 15 to 25 lakh rupees per hectare for intensive shrimp farming operations. For fish farmers cultivating Indian Major Carps or high-value species, investments range from 5 to 12 lakh rupees per hectare. When disease outbreaks occur or water quality collapses, these investments evaporate. The economic ripple effects extend beyond individual farmers, impacting entire coastal communities dependent on aquaculture for employment and income.
Understanding the biological mechanisms behind pond failure represents the first step toward prevention. Ammonia, produced through protein metabolism and organic decomposition, becomes increasingly toxic as pH levels rise. In the alkaline conditions common to many Indian coastal areas, even moderate ammonia concentrations prove lethal to aquatic species. Nitrite, the intermediate product in the nitrogen cycle, disrupts oxygen transport in the bloodstream of shrimp and fish, causing “brown blood disease” and mortality.
The challenge intensifies because these problems often cascade. Poor pond bottom conditions release ammonia and hydrogen sulfide, which stress the cultured organisms. Stressed animals exhibit weakened immune responses, making them vulnerable to viral and bacterial pathogens. Disease outbreaks further deteriorate water quality as dead organisms decompose, creating a vicious cycle that accelerates pond collapse.
Indian farmers need solutions that address root causes rather than symptoms. This requires shifting from chemical-dependent reactive management to biology-based preventive strategies. Bioremediation offers this fundamental shift by harnessing beneficial microorganisms to restore and maintain ecological balance within pond systems.
The Indian Context: Regional Challenges and Regulatory Landscape
Regional Challenges Across India’s Aquaculture Belt
Coastal Andhra Pradesh and Telangana
The Krishna-Godavari delta region supports the highest concentration of shrimp farming activity in India. Farmers here face unique challenges related to groundwater salinity fluctuations, particularly during monsoon transitions. The coastal alluvial soils, while generally suitable for aquaculture, often contain high organic content that accelerates oxygen depletion during warm weather. Summer temperatures regularly exceed 35 degrees Celsius, creating thermal stress conditions that compromise immune function in cultured species.
Brackish water sources in this region frequently exhibit salinity variations between 5 and 35 parts per thousand within a single growing season. These fluctuations stress osmoregulatory systems in both shrimp and euryhaline fish species, increasing disease susceptibility.
Odisha Coastal Zone
Odisha’s aquaculture sector contends with extended monsoon periods that introduce massive freshwater inputs into coastal farming areas. This sudden salinity reduction can trigger molting complications in shrimp and create favorable conditions for freshwater bacterial pathogens. The state’s extensive mangrove buffer zones, while ecologically valuable, sometimes limit water exchange capabilities for farms, making biological water quality management particularly critical.
Cyclonic activity remains a persistent risk factor. Post-cyclone water quality management requires rapid intervention to prevent disease outbreaks triggered by stress and contamination.
Gujarat Aquaculture Systems
Gujarat’s arid climate and higher baseline salinity levels create distinct management requirements. Evaporative water loss during summer months can push salinity beyond optimal ranges for L. vannamei, necessitating careful monitoring and freshwater supplementation. The region’s alkaline soil conditions elevate pH levels, which increases ammonia toxicity risk even at relatively low total ammonia nitrogen concentrations.
Gujarat farmers increasingly adopt intensive recirculating systems and biofloc technology, both of which demand sophisticated biological management to prevent system crashes.
Regulatory Framework and Compliance
Coastal Aquaculture Authority (CAA) Guidelines
The CAA, established under the Coastal Aquaculture Authority Act of 2005, mandates specific operational standards for farms within coastal regulation zones. Key requirements include:
Maintenance of minimum dissolved oxygen levels above 4 milligrams per liter
Effluent discharge standards limiting biochemical oxygen demand (BOD) to below 100 milligrams per liter
Chemical oxygen demand (COD) restrictions in discharge water
Prohibition of antibiotic use without proper veterinary prescription
Mandatory registration and periodic compliance reporting
Bioremediation approaches directly support CAA compliance by reducing organic loading and improving effluent quality without chemical interventions.
Marine Products Export Development Authority (MPEDA) Standards
MPEDA promotes best aquaculture practices aligned with international food safety requirements. The authority emphasizes:
Traceability systems from hatchery to harvest
Antibiotic residue monitoring programs
Good aquaculture practices (GAP) certification
Environmental sustainability benchmarks
Farms utilizing biological culture systems demonstrate better compliance with these standards, as probiotic approaches reduce reliance on prohibited substances while improving product quality and food safety profiles.
State-Level Regulations
Individual coastal states implement additional requirements addressing local environmental concerns. These typically include setback distances from high tide lines, mangrove protection zones, and groundwater usage restrictions. Understanding and complying with these multilayered regulatory requirements represents a significant operational challenge for farmers.
Bioremediation Fundamentals: The Scientific Foundation for Sustainable Farming
Bioremediation in aquaculture refers to the use of selected beneficial microorganisms to decompose organic waste, transform toxic metabolites into harmless compounds, and suppress pathogenic organisms. This biological approach mimics and enhances natural processes that maintain water quality in healthy aquatic ecosystems.
The Microbial Community Framework
Healthy pond ecosystems maintain diverse microbial communities that perform critical functions:
Heterotrophic Bacteria
These organisms decompose complex organic compounds, proteins, carbohydrates, and lipids, into simpler molecules. In well-managed systems, heterotrophs rapidly process uneaten feed and fecal matter before these materials accumulate on the pond bottom. Products like T1B Acqua S contain specialized heterotrophic strains selected for their ability to function effectively in the wide salinity and temperature ranges typical of Indian aquaculture conditions.
Nitrifying Bacteria
The nitrogen cycle represents the most critical biological process in aquaculture systems. Nitrifying bacteria exist in two functional groups:
Ammonia-oxidizing bacteria (Nitrosomonas species) convert toxic ammonia to nitrite
Nitrite-oxidizing bacteria (Nitrobacter species) transform nitrite to relatively harmless nitrate
These organisms are autotrophic, meaning they derive energy from chemical oxidation rather than organic matter. They grow slowly and are easily disrupted by environmental fluctuations, antibiotic use, or pH extremes. Maintaining robust nitrifying populations requires consistent conditions and often benefits from supplementation with specialized formulations like T1B Feed Pro.
Photosynthetic Organisms
Beneficial algae and cyanobacteria provide oxygen through photosynthesis while consuming carbon dioxide and nutrients. These organisms help stabilize pH and provide natural food sources for cultured species. However, excessive algal blooms can cause oxygen depletion during night hours or following die-off events, requiring careful management.
Probiotic Bacteria
Specific bacterial strains, primarily Bacillus and Lactobacillus species, colonize the digestive tract of shrimp and fish. These probiotics improve nutrient absorption, enhance immune function, and competitively exclude pathogenic organisms. When incorporated into feed through products like T1B Feed Pro, these beneficial bacteria significantly improve feed conversion ratios and overall animal health.
Mechanisms of Action
Competitive Exclusion
Beneficial microorganisms compete with pathogenic bacteria for nutrients and attachment sites. By establishing dominant populations in water, on pond surfaces, and within animal digestive systems, these beneficial strains limit the proliferation of disease-causing organisms like Vibrio species.
Enzymatic Degradation
Specialized bacterial strains produce enzymes, proteases, lipases, amylases, and cellulases, that break down complex organic materials. This enzymatic activity prevents the accumulation of sludge and reduces the oxygen demand at the pond bottom.
Immune Stimulation
Certain probiotic strains trigger enhanced immune responses in cultured animals. These microorganisms activate innate immune pathways, increasing disease resistance without the use of antibiotics or chemicals.
Water Quality Improvement
Through metabolic processes, beneficial bacteria reduce concentrations of ammonia, nitrite, hydrogen sulfide, and other toxic compounds. This biological filtration provides continuous water quality improvement without the need for frequent water exchanges or chemical treatments.
Pond Bottom Management: Solving the Black Soil Crisis
The pond bottom represents the most overlooked yet most critical component of aquaculture systems. Indian farmers often describe failed ponds as having “black soil”, a accurate observation of the anaerobic, sulfide-rich sediment that develops when organic matter accumulates faster than beneficial bacteria can decompose it.
The Black Soil Problem
Black soil conditions develop through a predictable progression:
Organic matter (feed waste, feces, dead plankton) settles to the pond bottom
Decomposition consumes dissolved oxygen in sediment layers
These bacteria produce hydrogen sulfide (H2S), which turns sediment black and releases toxic gas
Anaerobic decomposition releases ammonia, methane, and organic acids into overlying water
The toxic sediment layer expands, progressively degrading the entire pond environment
This condition proves particularly problematic in intensive farming systems where feed inputs exceed 100 kilograms per hectare daily. Without effective biological management, organic loading overwhelms the pond’s natural capacity for decomposition.
Biological Bottom Management Strategy
Pre-Stocking Preparation
Before introducing shrimp or fish, establish a robust beneficial bacterial community in pond bottom sediments:
Apply T1B Acqua S at 2-3 kilograms per hectare mixed with fine sand or rice bran as a carrier
Broadcast uniformly across the dry pond bottom
Flood the pond gradually over 3-5 days, allowing bacterial colonization
Maintain water level at 60-80 centimeters for 7-10 days before full filling
Monitor for the development of brown, floccular material indicating active bacterial growth
This preparatory phase establishes the microbial foundation necessary for sustained organic matter processing throughout the culture period.
Ongoing Maintenance Applications
During the culture period, maintain beneficial bacterial populations through regular supplementation:
Weekly applications of T1B Acqua S at 500 grams to 1 kilogram per hectare
Increase dosage to 1.5-2 kilograms per hectare during periods of heavy feeding
Apply in late afternoon or evening when oxygen levels remain adequate
Focus applications on feeding areas where organic accumulation is greatest
Monitoring Bottom Conditions
Regular assessment of pond bottom health prevents crisis situations:
Weekly Bottom Quality Checklist:
Visual inspection for color (brown healthy, black problematic)
Observation of benthic organisms (worms, beneficial microcrustaceans indicate healthy conditions)
Crisis Intervention Protocol
When black soil conditions develop despite preventive measures:
Increase aeration intensity, particularly bottom aeration if available
Emergency application of T1B Acqua S at 3-5 kilograms per hectare
Reduce feeding rates by 30-50 percent for 3-5 days
Avoid water exchange if possible, as this removes beneficial bacteria
Monitor ammonia and hydrogen sulfide levels closely
Resume normal operations only after bottom conditions improve
The Economic Impact of Bottom Management
Effective pond bottom management through bioremediation delivers measurable financial benefits:
Reduced partial harvest losses (5-15 percent improvement in survival)
Extended pond lifespan before complete draining and renovation (from 3-4 crops to 6-8 crops)
Lower disease incidence reducing treatment costs
Improved growth rates from better environmental conditions
Reduced water exchange requirements lowering pumping costs
A single hectare of intensive shrimp farming using biological bottom management typically shows 8-12 lakh rupees additional revenue per crop compared to conventionally managed ponds with poor bottom conditions.
Water Quality Management: Mastering the Nitrogen Cycle
Water quality deterioration causes more aquaculture failures in India than all disease outbreaks combined. The nitrogen cycle, the biological transformation of protein waste into less toxic forms, represents the cornerstone of water quality management.
Understanding the Nitrogen Cycle in Aquaculture
The nitrogen cycle in aquaculture systems follows this pathway:
Feed protein consumed by shrimp/fish
Approximately 25-30 percent of protein nitrogen excreted as ammonia through gills and in feces
Ammonia-oxidizing bacteria convert ammonia (NH3/NH4+) to nitrite (NO2-)
Nitrite-oxidizing bacteria convert nitrite to nitrate (NO3-)
Nitrate assimilation by algae or denitrification to nitrogen gas
The critical challenge: Steps 4 and 5 proceed slowly and are easily disrupted. When nitrifying bacteria cannot keep pace with ammonia production, toxic levels accumulate rapidly.
Ammonia Toxicity Management
Ammonia exists in two forms: ionized ammonium (NH4+) and un-ionized ammonia (NH3). Un-ionized ammonia, the toxic form, increases dramatically with rising pH and temperature. Indian coastal waters often exhibit pH values of 8.0-8.5, meaning even moderate total ammonia concentrations prove dangerous.
Target Levels:
Total Ammonia Nitrogen: Below 1.0 milligrams per liter (ideal below 0.5 mg/L)
At pH 8.0 and 28 degrees Celsius: Keep total ammonia below 1.5 mg/L to maintain un-ionized ammonia under 0.05 mg/L
Biological Ammonia Control Strategy:
Application of nitrifying bacterial cultures provides the most sustainable solution:
Initial pond preparation: Apply T1B Acqua S at 2 kilograms per hectare during water filling
Maintenance: Weekly applications of 500 grams per hectare
During heavy feeding periods (Day 60-harvest): Increase to 1 kilogram per hectare twice weekly
Emergency intervention: 3-5 kilograms per hectare when ammonia exceeds 2 mg/L
The bacterial strains in T1B Acqua S include robust Nitrosomonas and Nitrobacter species selected for tolerance to salinity fluctuations and high temperatures typical of Indian aquaculture conditions.
Nitrite Management
Nitrite accumulation typically occurs when ammonia-oxidizing bacteria outpace nitrite-oxidizing bacteria. This imbalance often follows:
Sudden increases in feeding rates
Temperature fluctuations stressing Nitrobacter populations
pH drops below 7.5
Antibiotic treatments that disrupt bacterial communities
Nitrite Toxicity Mechanism:
Nitrite enters the bloodstream and oxidizes hemoglobin to methemoglobin, which cannot transport oxygen. Affected animals show brown gills and blood, reduced growth, and increased disease susceptibility.
Maintain diverse nitrifying populations through consistent T1B Acqua S applications
Avoid sudden changes in feeding rates; increase gradually over 5-7 days
During nitrite spikes, add salt (calcium chloride preferred over sodium chloride) to block nitrite uptake while biological populations recover
Emergency dosing: 2-3 kilograms T1B Acqua S per hectare plus moderate water exchange if levels exceed 1.0 mg/L
Practical Water Quality Monitoring Schedule
Daily Monitoring:
Temperature (6 AM and 2 PM)
Dissolved oxygen (pre-dawn and mid-afternoon)
pH (morning)
Water transparency using Secchi disk
Twice Weekly:
Ammonia nitrogen
Nitrite nitrogen
Alkalinity
Weekly:
Nitrate nitrogen
Phosphate
Hardness
Salinity
This monitoring schedule allows early detection of nitrogen cycle disruptions before crisis levels develop.
Gut Health and Feed Efficiency: The Probiotic Advantage
Feed represents 50-60 percent of operating costs in intensive aquaculture. Small improvements in feed conversion ratio (FCR) translate directly into significant profit increases. Probiotic supplementation through products like T1B Feed Pro offers a biological pathway to improved feed efficiency while simultaneously enhancing disease resistance.
The Digestive Health Connection
Shrimp and fish maintain complex gut microbiomes that influence:
Nutrient digestion and absorption
Immune system development and function
Pathogen resistance
Stress tolerance
Growth rates
Modern intensive culture conditions disrupt natural gut flora through:
Artificial feeds lacking diverse microbial communities
L. vannamei dominates Indian shrimp aquaculture due to faster growth rates, disease tolerance, and market acceptance. Optimizing culture conditions through bioremediation maximizes this species’ genetic potential.
Stocking and Early Phase Management:
Stock post-larvae at 40-60 per square meter for intensive systems
Pre-stock water preparation: Apply T1B Acqua S 7-10 days before stocking at 2 kg/hectare
Post-stocking: Apply T1B Feed Pro in feed from Day 1 at 1.5 grams per kilogram feed
Maintain dissolved oxygen above 5 milligrams per liter during critical early phase
Growth Phase Optimization (Days 30-75):
This period represents maximum growth potential and highest feed consumption:
Increase T1B Acqua S applications to 1 kilogram per hectare twice weekly
Continue T1B Feed Pro at 1.5-2 grams per kilogram feed
Monitor water quality daily; ammonia and nitrite spikes most common during this phase
Maintain feeding tables with gradual increases; avoid sudden jumps above 10 percent per week
Pre-Harvest Conditioning (Days 75-Harvest):
Reduce feeding slightly 7-10 days before harvest to clear gut contents
Maintain bioremediation applications to ensure water quality stability
Final size optimization: Continue T1B Feed Pro until 3 days before harvest
Expected Performance Metrics:
Culture duration: 90-100 days
Final weight: 16-20 grams
Survival: 75-85 percent
FCR: 1.3-1.5
Yield: 6-8 tonnes per hectare per crop
Penaeus monodon (Giant Tiger Prawn)
Tiger shrimp cultivation is increasing due to premium market pricing despite slower growth and higher disease susceptibility compared to L. vannamei.
Critical Success Factors:
Lower stocking density: 20-30 post-larvae per square meter
Intensive biosecurity measures including UV-treated source water
Enhanced bioremediation due to longer culture period (120-140 days)
Stricter water quality parameters; P. monodon less tolerant of ammonia and nitrite
Modified Bioremediation Protocol:
Pre-stocking T1B Acqua S: 3 kilograms per hectare
Weekly maintenance: 1.5 kilograms per hectare throughout culture
T1B Feed Pro: 2 grams per kilogram feed due to extended growth period
Additional applications during molting periods when immune stress is highest
Expected Performance Metrics:
Culture duration: 120-140 days
Final weight: 30-40 grams
Survival: 60-75 percent
FCR: 1.5-1.8
Yield: 4-6 tonnes per hectare per crop
Price premium: 150-200 rupees per kilogram above L. vannamei
Species-Specific Protocols: Fish Farming Systems
Indian Major Carps (Rohu, Catla, Mrigal)
Composite fish farming with Indian Major Carps represents traditional aquaculture adapted to modern intensive methods. Bioremediation enhances productivity while maintaining environmental sustainability.
Polyculture Stocking Ratios:
Catla (surface feeder): 30 percent
Rohu (column feeder): 40 percent
Mrigal (bottom feeder): 20 percent
Common Carp or Grass Carp: 10 percent
Total stocking density: 8,000-12,000 fingerlings per hectare
Bioremediation Protocol for IMC:
Pre-stocking pond preparation: T1B Acqua S at 3 kilograms per hectare
Monthly applications: 2 kilograms per hectare
Feed supplementation: T1B Feed Pro at 1 gram per kilogram supplemental feed
Natural productivity enhancement: Bioremediation supports phytoplankton and zooplankton development
Expected Performance:
Culture duration: 10-12 months
Average final weight: 800-1,200 grams
Survival: 80-90 percent
FCR: 1.5-1.8
Yield: 6-8 tonnes per hectare annually
Sea Bass (Lates calcarifer)
Sea bass commands premium prices (300-400 rupees per kilogram) but requires superior water quality and management.
Critical Requirements:
Salinity: 10-30 parts per thousand (brackish to marine)
Dissolved oxygen: Maintain above 6 milligrams per liter
Temperature: Optimal 26-30 degrees Celsius
Low tolerance for ammonia and nitrite
Intensive Bioremediation Approach:
Pre-stocking: T1B Acqua S 4 kilograms per hectare
Weekly maintenance: 1.5 kilograms per hectare
T1B Feed Pro: 2 grams per kilogram in high-protein pellets (45-50 percent protein)
Increased aeration: Minimum 5 horsepower per hectare
Expected Performance:
Culture duration: 6-8 months
Final weight: 500-800 grams
Survival: 70-85 percent
FCR: 1.4-1.7
Yield: 4-6 tonnes per hectare per crop
Tilapia (Oreochromis niloticus)
Fast-growing and hardy, tilapia responds exceptionally well to bioremediation with dramatic improvements in growth rates.
Monosex Culture Protocol:
Stock all-male fingerlings at 3-5 per square meter
Pre-stocking: T1B Acqua S 2 kilograms per hectare
Bi-weekly applications: 1 kilogram per hectare
T1B Feed Pro: 1.5 grams per kilogram feed
Expected Performance:
Culture duration: 5-6 months
Final weight: 400-600 grams
Survival: 85-95 percent
FCR: 1.2-1.5
Yield: 10-15 tonnes per hectare per crop
Traditional vs. Bioremediation-Based Farming: A Comparative Analysis
Document crop performance: Survival, FCR, yield, health issues
Pond preparation for next crop begins immediately
Troubleshooting Common Challenges
Sudden Ammonia Spike (Above 2 mg/L)
Immediate Actions:
Reduce feeding by 50% immediately
Emergency application of T1B Acqua S: 3-5 kilograms per hectare
Increase aeration to maximum capacity
Monitor every 6 hours until levels decline below 1 mg/L
Partial water exchange (20-30%) only if levels exceed 5 mg/L despite interventions
Prevention:
Never increase feeding more than 10% weekly
Maintain regular T1B Acqua S schedule without gaps
Monitor feeding response; uneaten feed is primary ammonia source
White Spot Syndrome Virus (WSSV) Detection
Recognition:
White spots on carapace and inside shell
Red discoloration
Lethargy and gathering at pond edges
Sudden mortality increase
Response Protocol:
Reduce stress factors: Maintain stable water quality, gentle aeration
Stop feeding or reduce to 25% normal ration
Increase T1B Acqua S to 2 kilograms per hectare three times weekly
Supplement feed with T1B Feed Pro at maximum dosage (2 grams per kilogram)
Avoid water exchange; maintain biosecurity
Harvest early if mortality exceeds 10% within 3 days
Prevention:
Source post-larvae from SPF (specific pathogen free) hatcheries only
Quarantine and PCR testing of stock before introduction
Maintain optimal water quality reducing stress
Regular probiotic use enhances immune resistance
Excessive Algae Bloom (Secchi Disk Below 20 cm)
Risks:
Nighttime oxygen depletion
pH swings (high during day, low at night)
Potential for sudden die-off and water quality crash
Management:
Reduce or stop organic fertilization immediately
Increase nighttime aeration substantially
Apply T1B Acqua S 1.5 kilograms per hectare to enhance heterotrophic bacteria that compete with algae
Partial water exchange (10-15%) if bloom extremely dense
Monitor dissolved oxygen continuously, especially pre-dawn
Prevention:
Balance fertilization; avoid excessive organic or inorganic nutrients
Maintain grazing pressure through appropriate fish/shrimp stocking
Regular monitoring of phytoplankton density
Feed Refusal or Reduced Appetite
Possible Causes:
Water quality deterioration (check ammonia, nitrite, dissolved oxygen)
Disease development (observe for clinical signs)
Molting period (normal for shrimp)
Feed quality issues (check for rancidity, moisture damage)
Diagnostic Steps:
Immediate water quality testing full panel
Visual health assessment of animals
Inspect feed quality
Review recent management changes
Response:
Address underlying cause (improve water quality, treat disease if confirmed)
Continue T1B Feed Pro supplementation to support gut health
Resume feeding gradually when appetite returns
Building a Sustainable Aquaculture Future
Indian aquaculture stands at a crossroads. Traditional chemical-intensive methods deliver short-term results but create long-term environmental degradation, antibiotic resistance, and unstable production. The bioremediation approach, exemplified through biological cultures like T1B Acqua S and T1B Feed Pro, offers a fundamentally different pathway.
This biological management philosophy recognizes that healthy pond ecosystems depend on balanced microbial communities. By nurturing beneficial bacteria through strategic supplementation, farmers harness natural processes that maintain water quality, suppress pathogens, and optimize animal health. The results speak clearly: improved survival rates, enhanced growth, reduced disease, and significantly better profitability.
The economic advantages are substantial. Farmers implementing comprehensive bioremediation programs consistently report 50-100% profit increases compared to conventional methods. These gains stem from multiple sources: Reduced feed costs through better FCR, lower disease losses, decreased chemical expenses, reduced labor for water management, and extended pond productive life.
Beyond individual farm economics, bioremediation supports industry sustainability. Regulatory pressures around effluent quality, antibiotic use, and environmental impact continue intensifying. Farms utilizing biological management demonstrate superior compliance with Coastal Aquaculture Authority and MPEDA standards. This regulatory alignment protects market access, particularly for export-oriented operations facing stringent international food safety requirements.
The technical foundation is sound. Decades of microbial ecology research validate the mechanisms underlying bioremediation. Products like T1B Acqua S and T1B Feed Pro contain scientifically selected bacterial strains proven effective across the diverse environmental conditions characterizing Indian aquaculture. These formulations translate academic understanding into practical tools farmers can apply with confidence.
Implementation requires commitment to systematic management. Success comes from consistent application of biological cultures, regular water quality monitoring, and progressive refinement based on pond-specific observations. The 180-day roadmap outlined in this handbook provides a proven framework, but each farmer must adapt details to their unique circumstances.
The journey from chemical dependence to biological management represents more than a technical shift. It embodies a philosophical transformation: From fighting against natural processes to working in harmony with them. This alignment with ecological principles delivers both immediate economic benefits and long-term environmental sustainability.
Contact Team One Biotech for Bulk Bio-Culture Supply
Looking to improve your ETP/STP efficiency with the right bioculture? Talk to our experts at Team One Biotech for customised microbial solutions.
Revolutionary Grease and Wastewater Management Solution Across Southeast Asia
Across Thailand, Indonesia, Philippines, Vietnam, Malaysia, Singapore, Sri Lanka, Bangladesh, Nepal, Cambodia, Laos and other Asian countries, the demand for effective grease and wastewater treatment solutions is increasing rapidly due to rapid urbanization and industrial growth.
Commercial kitchens, food processing industries, hospitality sectors, and municipal sewage networks face serious challenges related to Fats, Oils and Grease (FOG) accumulation, leading to blocked drainage systems, equipment failure, costly maintenance, and environmental compliance issues.
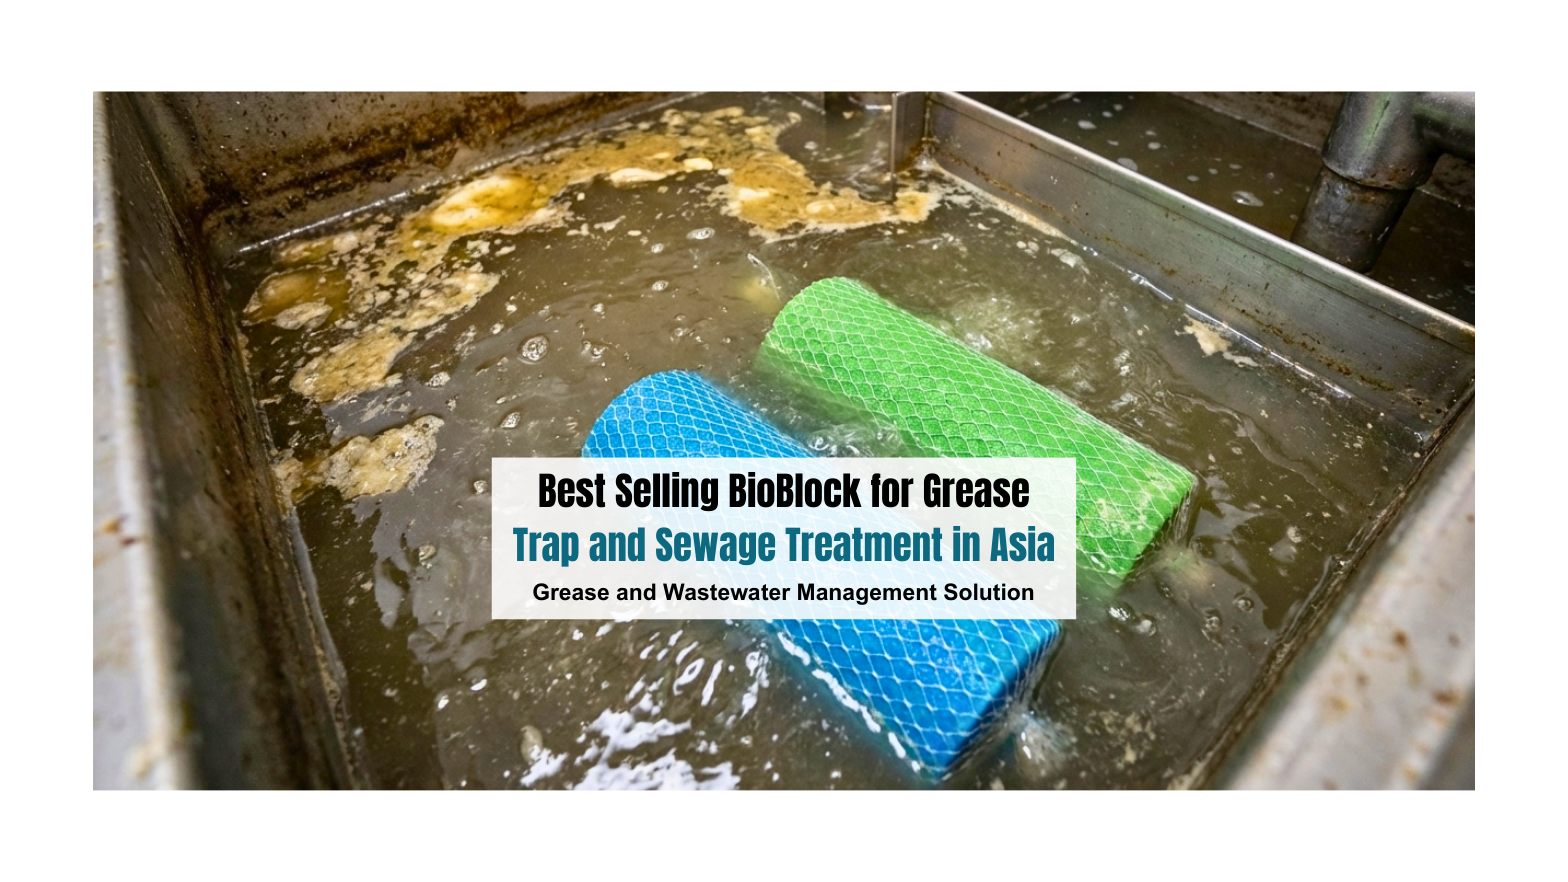
What is T1B BioBlock?
T1B BioBlock is Asia’s leading bioblock solution for grease trap and sewage treatment, manufactured in India using advanced enzyme and microbial biotechnology. It is the only bioblock manufactured in India that combines specialized enzymes and beneficial microbes in a single slow-release solid block.
The product provides controlled biological activity for 25 days, 45 days, and up to 60 days, making it ideal for Asian tropical climates and high organic wastewater conditions found across Southeast Asian countries.
Why T1B BioBlock Outperforms Traditional Grease Treatment Methods
Dual-Action Enzyme and Microbial Technology
T1B BioBlock contains specialized lipase, protease, and amylase enzymes combined with robust microbial strains including Bacillus species. This combination ensures:
Faster breakdown of fats, oils, and grease (FOG)
Continuous biological activity without shock loading
Superior performance in high-temperature tropical environments
Controls grease and solid accumulation in confined spaces
Reduces hydrogen sulfide generation and corrosive odors
Prevents sewer overflows (SSO) caused by FOG blockages
Extends infrastructure service life and reduces rehabilitation costs
Minimizes environmental and public health risks
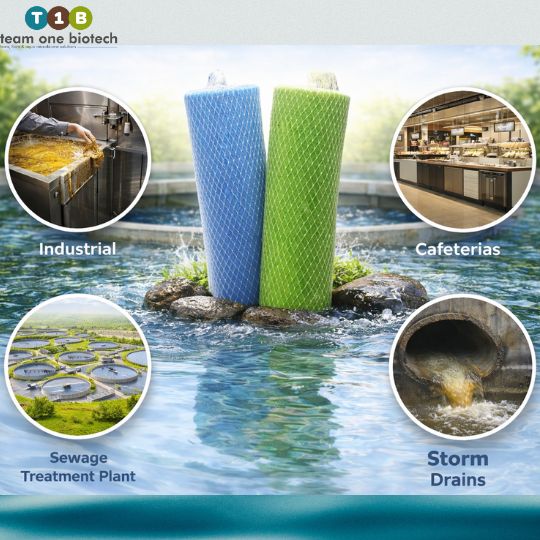
Geographic Reach: Countries Where T1B BioBlock is Successfully Deployed
T1B BioBlock has established market presence across Asia Pacific region including:
Southeast Asia: Thailand, Indonesia, Philippines, Vietnam, Malaysia, Singapore, Cambodia, Laos, Myanmar, Brunei
South Asia: Sri Lanka, Bangladesh, Nepal, Bhutan, Maldives
Middle East: UAE, Saudi Arabia, Oman, Qatar, Kuwait (growing presence)
Active Ingredients:
Lipase enzymes (for fat breakdown)
Protease enzymes (for protein degradation)
Amylase enzymes (for starch conversion)
Beneficial microbial consortium (1 x 10^9 CFU/g minimum)
Environmental Compliance:
100% biodegradable and eco-friendly
Chemical-free formulation
Safe for operators and environment
Non-toxic to aquatic life
Installation and Usage Instructions
Remove protective packaging from BioBlock
Place in grease trap, STP inlet chamber, or wet well where continuous water flow exists
Position on perforated platform or suspend in mesh cage for optimal dissolution
Replace after designated period (25, 45, or 60 days based on variant)
No mixing, dilution or special equipment required
ROI and Cost Benefits for Asian Businesses
Reduced pumping costs: 40-60% decrease in grease trap cleaning frequency
Lower maintenance expenses: Fewer emergency callouts and equipment repairs
Extended equipment life: Protection of costly pumps and treatment infrastructure
Compliance savings: Avoid regulatory fines and operational shutdowns
Labor efficiency: Minimal installation and monitoring requirements
Sustainable solution: Reduces environmental impact and carbon footprint
About the Manufacturer: Team One Biotech
Team One Biotech is a leading Indian manufacturer and exporter of bioremediation solutions with over a decade of expertise in enzyme and microbial biotechnology. The company supplies eco-friendly wastewater treatment products across Asia Pacific region.
T1B BioBlock is the flagship export product supporting sustainable wastewater management in commercial, municipal, and industrial sectors across multiple Asian countries.
Manufacturing Standards:
ISO certified production facility
Quality control at every production stage
Research-backed formulations
Export-ready packaging and documentation
Customer Success Stories Across Asia
Indonesia – Hotel Chain: Reduced grease trap cleaning from weekly to monthly, saving $3,000 annually per location
Thailand – Municipal STP: Improved BOD removal efficiency by 35% within 60 days of BioBlock deployment
Conclusion: Leading the Sustainable Wastewater Revolution in Asia
T1B BioBlock represents the future of grease trap management, sewage treatment, and wastewater infrastructure maintenance across Asia. With proven slow-release technology lasting up to 60 days, dual-action enzyme and microbial formulation, and specific design for Asian wastewater conditions, it is one of the most advanced and trusted bioblock solutions available in the Asian market today.
Whether you manage a commercial kitchen in Bangkok, operate a sewage treatment plant in Jakarta, maintain pumping stations in Manila, or oversee municipal infrastructure in Colombo, T1B BioBlock delivers reliable, cost-effective, and environmentally responsible FOG management.
Join hundreds of businesses and municipalities across Asia that have already made the switch to smarter, more sustainable wastewater treatment.
Looking to improve your ETP/STP efficiency with the right bioculture? Talk to our experts at Team One Biotech for customised microbial solutions.
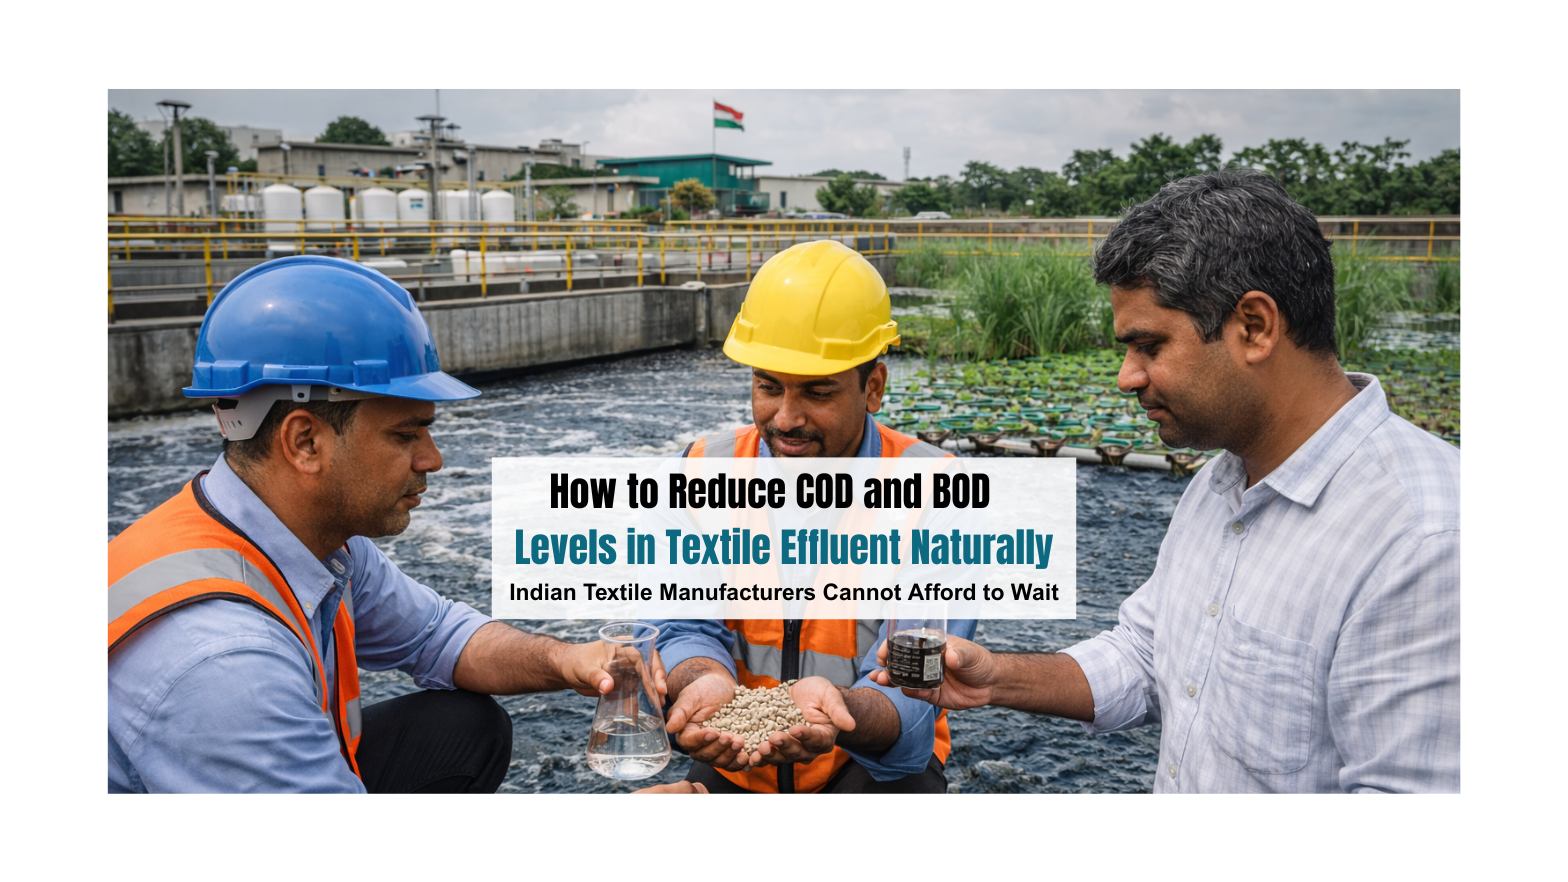
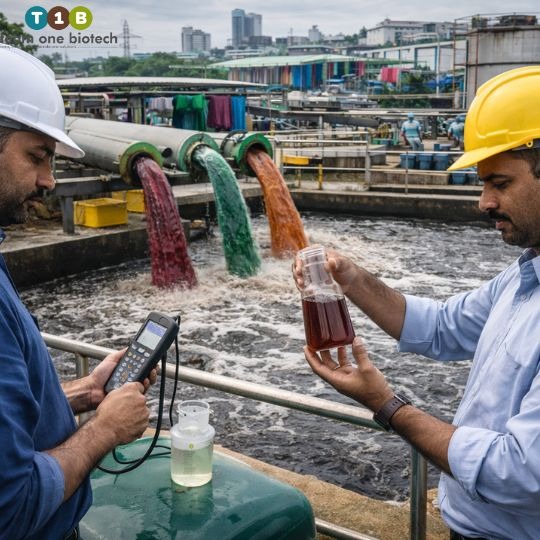
The email from the State Pollution Control Board landed in Rajesh Kumar’s inbox at 9:47 AM on a Tuesday. As the Environmental Manager of a mid-sized pharmaceutical manufacturing unit in Vapi, Gujarat, he’d been expecting it, but that didn’t make it any easier to read. The SPCB’s latest inspection report flagged elevated COD levels in three consecutive samples. A show-cause notice would follow if the next quarterly audit showed similar results.
Rajesh’s dilemma wasn’t unique. Across India’s industrial clusters, from Tirupur’s textile belt to Kanpur’s tanneries, from Maharashtra’s MIDC zones to Rajasthan’s RIICO estates, ETP managers face the same impossible equation: discharge parameters are getting stricter, chemical costs are rising relentlessly, and the margin for error is shrinking to zero.
The conventional response? Increase the dosing of Polyaluminium Chloride (PAC), add more lime for pH adjustment, pump in extra coagulants and flocculants. But this approach creates its own trap. Chemical costs spiral upward, consuming 40-60% of operational ETP budgets, while sludge generation doubles, creating secondary disposal headaches. It’s a costly treadmill that never stops.
There’s a different path, one that replaces brute-force chemistry with biological intelligence. This is the story of how one manufacturing facility broke free from chemical dependency and discovered that nature, when properly harnessed, offers a more effective and economical solution.
Is your chemical spend eating into margins while compliance remains uncertain? Let’s audit your current approach, the first step costs nothing but could save lakhs annually.
The Breaking Point: When Chemical Dosing Stops Working
The pharmaceutical unit in our case study had been operational for twelve years. Their Effluent Treatment Plant was designed for 250 KLD (kiloliters per day) and had served them adequately, until it didn’t.
The problems began accumulating slowly, then suddenly:
Rising Chemical Costs: Between 2022 and 2024, their monthly chemical procurement jumped from Rs. 2.8 lakhs to Rs. 4.3 lakhs, a 54% increase driven by volatile alum and PAC prices.
Inconsistent Performance: Despite higher dosing, COD levels remained stubbornly above 100 mg/L during peak production cycles, well above the CPCB’s target of 50 mg/L for pharmaceutical effluents.
Monsoon Failures: Gujarat’s monsoon brought hydraulic shocks that overwhelmed the system. Diluted effluent meant recalibrating chemical doses daily, an expensive guessing game.
Sludge Crisis: The facility was generating 8-10 tons of chemical sludge monthly. Disposal costs through TSDF (Treatment, Storage, and Disposal Facilities) added another Rs. 80,000 to monthly expenses.
The plant manager’s frustration was palpable: “We’re pouring more chemicals in, but the numbers aren’t improving proportionally. It’s like trying to mop a floor while the tap is still running.”
This is the reality across Indian manufacturing: chemical treatment has inherent limitations. It doesn’t eliminate organic pollutants, it merely coagulates and separates them. The fundamental biological oxygen demand remains, requiring ever-higher doses as effluent complexity increases.
The Biological Alternative: Understanding Bio-Augmentation
The breakthrough came after consultation with Team One Biotech’s technical team. Their assessment was straightforward: the plant’s existing activated sludge process was underperforming because the indigenous bacterial population couldn’t handle the pharmaceutical intermediates in the wastewater stream.
The solution wasn’t to abandon biological treatment, it was to enhance it with specialized microbial cultures specifically selected for pharmaceutical effluent characteristics.
How Biological Cultures Work in ETP Systems:
Bioremediation through bio-augmentation introduces concentrated, specialized bacterial consortia into the treatment system. These cultures are:
Substrate-Specific: Selected strains target specific organic compounds, phenols, aromatics, nitrogenous compounds, that conventional biomass struggles with.
High Cell Density: Delivered at concentrations of 10^9 to 10^11 CFU/gram, they rapidly establish dominance in the treatment tank.
Metabolically Versatile: Capable of breaking down complex molecules into simpler compounds (CO2, H2O, biomass) through enzymatic pathways.
Resilient: Engineered to withstand pH fluctuations, temperature variations, and toxic shock loads common in Indian industrial settings.
The science is elegantly simple: rather than using chemicals to physically separate pollutants, biological cultures metabolize them. COD and BOD reduction happens at the molecular level through oxidation, not through coagulation.
The Implementation: A Three-Phase Transformation
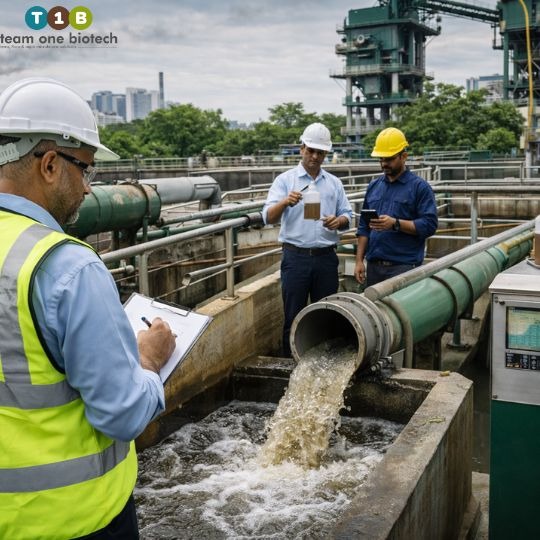
Phase 1: Baseline Assessment and Culture Selection (Weeks 1-2)
Team One Biotech’s field engineers conducted a comprehensive effluent characterization:
COD: 850-1,200 mg/L (inlet)
BOD: 450-600 mg/L (inlet)
pH: 6.2-8.9 (variable)
Temperature: 28-38°C
Presence of recalcitrant compounds from pharmaceutical synthesis
Based on this profile, a customized microbial consortium was formulated, combining:
Bacillus species for general organic degradation
Pseudomonas strains for aromatic compound breakdown
Specialized facultative anaerobes for pre-treatment of high-strength effluent
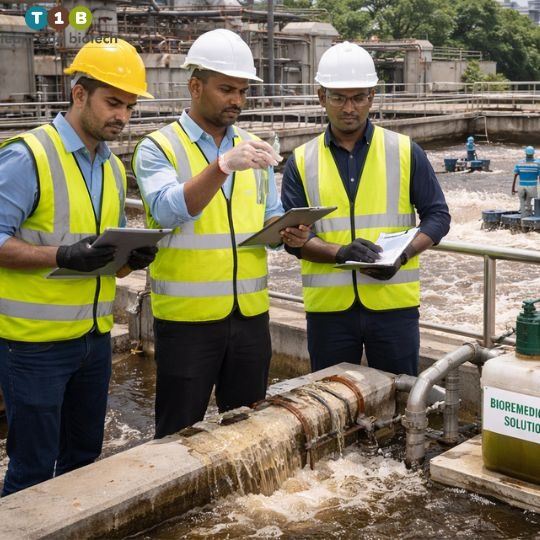
Phase 2: Gradual Introduction and Acclimatization (Weeks 3-6)
Rather than shocking the system, the biological cultures were introduced gradually:
Initial seeding at 50 ppm in the aeration tank
Daily monitoring of MLSS (Mixed Liquor Suspended Solids) and SVI (Sludge Volume Index)
Progressive reduction in chemical dosing, first coagulants, then flocculants
Maintenance dosing of cultures at 10-15 ppm during acclimatization
The transition wasn’t without challenges. During week four, a production batch containing higher-than-normal solvent residues temporarily disrupted the biological balance. Team One Biotech’s technical support responded with a booster dose and adjusted aeration parameters, a reminder that biological systems require active management, not just passive addition.
Phase 3: Stabilization and Optimization (Weeks 7-12)
By the third month, the transformation was measurable:
Effluent Quality: COD consistently below 45 mg/L, BOD under 8 mg/L, both well within CPCB norms.
Chemical Reduction: PAC consumption dropped from 850 kg/month to 280 kg/month. Lime usage decreased by 40%. Overall chemical spend fell from Rs. 4.3 lakhs to Rs. 2.9 lakhs monthly, a 32.5% reduction.
Sludge Management: Monthly sludge generation decreased to 4-5 tons, cutting disposal costs by nearly 50%.
Operational Stability: The system proved more resilient to hydraulic and organic shock loads. Monsoon season, previously a compliance nightmare, passed without incident.
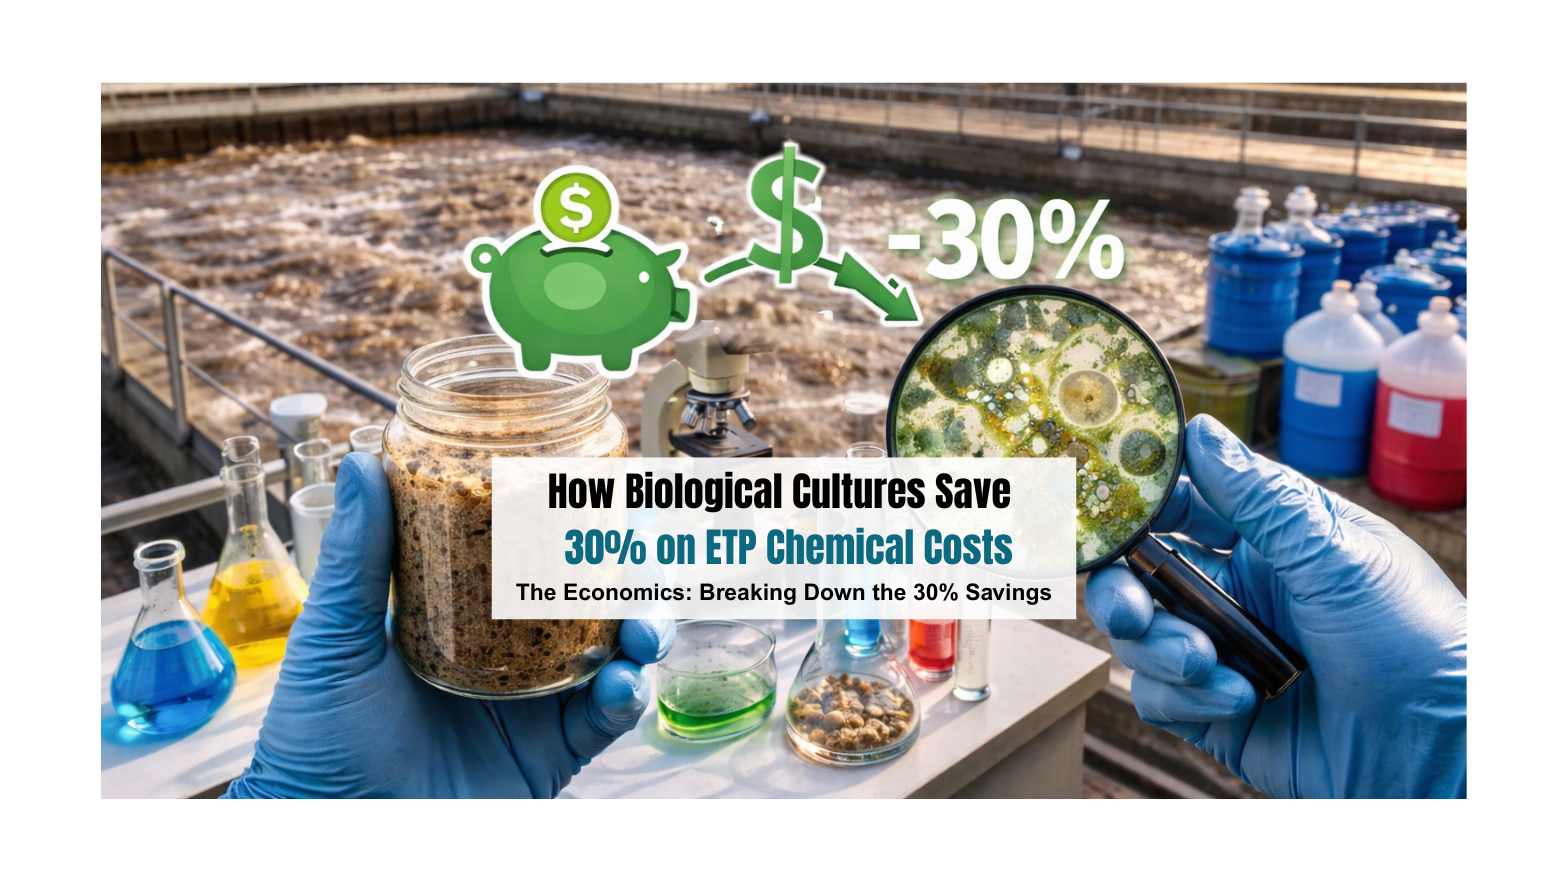
The Economics: Breaking Down the 30% Savings
Let’s examine the financial transformation with precision:
Even accounting for the conservative 30% savings claim, the annual impact is substantial: Rs. 25-30 lakhs saved, with improved compliance certainty and reduced environmental liability.
But the benefits extend beyond direct cost reduction:
Reduced Carbon Footprint: Lower chemical production and transportation emissions align with ESG commitments increasingly required by international buyers.
Improved SPCB Relations: Consistent compliance creates goodwill with regulatory authorities, reducing inspection frequency and penalty risk.
Operational Simplification: Biological systems require less manual intervention than complex chemical dosing schedules.
Navigating Indian Industrial Realities: Why Location Matters
India’s industrial wastewater landscape presents unique challenges that biological solutions are particularly suited to address:
Industrial Cluster Dynamics:
In estates like Gujarat’s GIDC (Gujarat Industrial Development Corporation) or Maharashtra’s MIDC (Maharashtra Industrial Development Corporation), multiple industries share common effluent treatment infrastructure. Effluent characteristics vary wildly, today’s inlet might be textile-heavy, tomorrow’s pharmaceutical-dominant. Biological cultures with broad substrate tolerance handle this variability better than fixed chemical dosing regimes.
Monsoon Hydraulic Shocks:
India’s monsoon season brings 70-80% of annual rainfall in 3-4 months. Sudden dilution can destabilize chemical treatment processes. Robust microbial populations, however, adapt to varying organic loads without complete process failure. The pharmaceutical unit in our case study reported zero compliance failures during the 2024 monsoon, a first in their operational history.
ZLD Compliance Pressures:
States like Tamil Nadu and Karnataka increasingly mandate Zero Liquid Discharge for water-stressed regions. ZLD systems concentrate pollutants, making them harder to treat with chemicals alone. Biological pre-treatment reduces the organic load entering expensive RO (Reverse Osmosis) and evaporator systems, extending membrane life and reducing scaling, a critical advantage in Tirupur’s textile clusters where ZLD is now mandatory.
Temperature Extremes:
Indian summers push effluent temperatures to 38-42°C in unshaded treatment tanks. Many chemical reactions become less efficient at elevated temperatures. Thermotolerant bacterial strains, by contrast, can be selected specifically for high-temperature performance, critical for units in Rajasthan’s RIICO estates or Gujarat’s coastal zones.
Beyond Cost Savings: The Compliance Confidence Factor
Six months after implementation, Rajesh Kumar’s quarterly SPCB inspection results told the story better than any spreadsheet. All parameters were green, not borderline compliant, but comfortably within limits with consistent margin.
“The difference isn’t just financial,” Rajesh explained. “It’s peace of mind. I’m not constantly adjusting chemical doses, not panicking when production increases, not dreading the monsoon. The system is self-regulating within reasonable bounds.”
This confidence has strategic value. With environmental compliance assured, the management has approved a 20% production capacity expansion, growth that would have been impossible under the previous chemical-dependent regime where ETP capacity was already maxed out.
Implementation Considerations: What You Need to Know
Biological treatment isn’t a magic solution that works everywhere without thought. Success requires understanding both the potential and the prerequisites:
When Biological Cultures Work Best:
Organic pollutant-dominated effluent (COD/BOD ratio between 1.5:1 and 3:1)
Adequate retention time in treatment tanks (minimum 18-24 hours)
pH range of 6.5-8.5 (adjustable if needed)
Absence of extreme toxicity (heavy metals, biocides at inhibitory concentrations)
Committed operational staff willing to monitor biological parameters
When to Exercise Caution:
Highly variable effluent with extreme daily fluctuations
Very small treatment systems (below 10 KLD) where economies may not justify transition
Operations with frequent extended shutdowns (biological cultures need continuous feeding)
The pharmaceutical unit’s success was partly due to good baseline conditions: a functional activated sludge system, trained operators, and management support for a 90-day transition period.
The Path Forward: Making the Transition
For ETP managers, plant heads, and environmental consultants evaluating this approach, the decision framework is straightforward:
Step 1: Conduct a Chemical Cost Audit
Calculate your current annual spend on coagulants, flocculants, pH adjusters, and sludge disposal. If this exceeds Rs. 30 lakhs annually, you’re in the optimal range for cost-effective biological intervention.
Step 2: Evaluate Your Effluent Profile
High organic loads (COD above 500 mg/L) with moderate biodegradability respond best. A simple lab test, the BOD/COD ratio, tells you if biological treatment can dominate your process.
Step 3: Assess Infrastructure Readiness
Existing aeration systems, adequate retention time, and basic monitoring capability (dissolved oxygen, pH) are essential. Most Indian ETPs built post-2010 already have these.
Step 4: Partner with Specialists
Biological treatment requires technical support during transition. Team One Biotech’s approach includes initial seeding, performance monitoring, troubleshooting support, and culture optimization, not just product supply.
Step 5: Plan for a 90-Day Transition
Budget three months for full stabilization. Early improvements appear within 3-4 weeks, but robust, shock-resistant performance requires establishing a mature, diverse microbial ecosystem.
Chemistry Versus Biology in the New Compliance Era
The 2026 CPCB discharge norms represent the most stringent environmental standards Indian industry has faced. BOD limits of 10 mg/L, COD under 50 mg/L, and increasingly strict heavy metal thresholds cannot be met through chemical brute force alone, not economically, not sustainably.
Biological treatment isn’t replacing chemicals entirely; it’s optimizing their use. In the pharmaceutical unit’s case, they still use some PAC for final polishing and lime for pH adjustment. But these chemicals now play supporting roles in a biologically-driven process, not the starring role in an expensive, inefficient drama.
The 30% cost savings are real and replicable across industries, textiles in Tirupur, food processing in Punjab, chemicals in Vapi, tanneries in Tamil Nadu. But the deeper value lies in transforming wastewater treatment from a compliance burden into a manageable, predictable process.
Every month Rajesh Kumar now saves Rs. 2+ lakhs in chemical costs. Every quarter he passes SPCB inspections without anxiety. Every year his company avoids the risk of production shutdowns that have shuttered competitors in the same industrial estate.
That’s not just cost reduction. That’s competitive advantage.
Looking to improve your ETP/STP efficiency with the right bioculture? Talk to our experts at Team One Biotech for customised microbial solutions.
The rules have changed, and this time, there’s no grace period.
If you’re managing an industrial facility in India, you’ve likely heard whispers about the stringent 2026 CPCB discharge norms. What you might not realize is that these aren’t just recommendations. They’re mandates backed by the Water (Prevention and Control of Pollution) Act, 1974 and the Environment Protection Act, 1986. Non-compliance doesn’t mean a slap on the wrist anymore. It means closure notices, criminal liability, and reputational damage that can take years to recover from.
From the textile dyeing units of Tirupur to the tanneries of Kanpur and the chemical clusters of Vapi, industries across India are facing a stark reality: comply or close. The health of our rivers, the Ganga, Yamuna, and countless others, depends on it. But more immediately, so does the survival of your business.
This guide breaks down everything you need to know about the 2026 CPCB discharge norms, provides a practical compliance checklist, and shows you how modern bioremediation solutions can help you meet these standards without breaking the bank.
Why the 2026 CPCB Discharge Norms Matter
The Central Pollution Control Board has tightened effluent discharge standards in response to decades of industrial pollution that has degraded India’s water bodies beyond acceptable limits. State Pollution Control Boards (SPCBs) across the country are now equipped with real-time monitoring capabilities and increased enforcement powers.
What does this mean for you? Simply put, the days of intermittent compliance are over. Your Effluent Treatment Plant (ETP) needs to deliver consistent, verifiable results every single day. And those results need to be documented, monitored online, and reported to regulators in real time.
The 2026 norms represent the most comprehensive overhaul of industrial wastewater treatment standards India has ever seen. They affect textile mills, pharmaceutical plants, tanneries, distilleries, chemical manufacturers, and virtually every water-intensive industry across the country.
Key Effluent Quality Parameters You Must Meet
The 2026 standards leave no room for interpretation. Your treated effluent must meet these parameters before discharge into water bodies or municipal sewers:
Primary Discharge Parameters
Biochemical Oxygen Demand (BOD): ≤ 10 mg/L
This is perhaps the most challenging parameter for many industries. BOD measures the amount of oxygen required by microorganisms to break down organic matter in water. The new limit is significantly lower than previous standards and requires advanced biological treatment processes to achieve consistently.
Chemical Oxygen Demand (COD): ≤ 50 mg/L
COD indicates the total amount of oxygen required to oxidize both biodegradable and non-biodegradable organic compounds. Meeting this standard requires effective primary, secondary, and often tertiary treatment stages in your ETP.
Total Suspended Solids (TSS): ≤ 10 mg/L
Suspended solids must be removed to near-drinking water standards. This demands efficient clarification, filtration, and polishing processes.
pH Level: 6.5 to 8.5
Effluent must be neutralized to fall within this narrow range. Extreme pH levels can harm aquatic ecosystems and corrode municipal infrastructure.
Fecal Coliform: ≤ 100 MPN/100 mL
This microbiological parameter is critical, particularly for industries with any domestic sewage component. It requires effective disinfection processes, typically using chlorination, UV treatment, or ozonation.
Ammoniacal Nitrogen (NH₃–N): ≤ 5 mg/L
Ammoniacal nitrogen is a critical nutrient pollutant that can cause oxygen depletion and toxicity in receiving water bodies if not properly controlled. Under the 2026 CPCB norms, achieving this limit requires robust nitrification–denitrification or advanced biological treatment processes. Poor control of ammoniacal nitrogen often indicates inadequate aeration, low microbial activity, or shock loading in the ETP. Consistent monitoring is essential, as elevated NH₃–N levels can lead to non-compliance even when BOD and COD are within limits.
Additional Parameters for Specific Industries
Depending on your sector, you may also need to monitor and control heavy metals (chromium, lead, mercury), total dissolved solids (TDS), oil and grease, phenolic compounds, and other contaminants specific to your manufacturing processes.
Infrastructure and Technology Requirements
Meeting the 2026 norms isn’t just about tweaking your existing ETP. Many facilities will require infrastructure upgrades and process optimization.
Dual Plumbing Systems
Industries generating both sewage and industrial wastewater must now maintain separate collection and treatment systems. You cannot mix these streams until after appropriate treatment. This requirement has significant capital implications for older facilities that were designed with combined systems.
Advanced Treatment Technologies
Traditional primary and secondary treatment may no longer be sufficient. Consider whether your facility needs:
Extended Aeration Systems: For achieving ultra-low BOD levels through prolonged biological treatment.
Membrane Bioreactors (MBR): Combining biological treatment with membrane filtration for superior effluent quality.
Activated Carbon Filtration: For removing persistent organic compounds and color.
Reverse Osmosis (RO): Particularly for industries in Zero Liquid Discharge zones.
Bioremediation Systems: Leveraging specialized microbial consortia to break down complex pollutants more efficiently than conventional methods.
Zero Liquid Discharge (ZLD) Mandates
Certain industries and geographic areas now fall under ZLD requirements, meaning absolutely no liquid effluent can be discharged. All water must be treated and recycled. ZLD requires sophisticated multi-stage treatment including RO, evaporators, and crystallizers. The capital and operational costs are substantial, making efficiency optimization critical.
Online Continuous Effluent Monitoring Systems (OCEMS)
One of the most significant changes in 2026 is the mandatory installation of OCEMS for most medium and large-scale industries.
What OCEMS Measures
Your OCEMS must continuously monitor and transmit data for key parameters including pH, flow rate, TSS, COD, and BOD. This data is sent directly to the SPCB servers in real time, creating a permanent compliance record.
Compliance Implications
There’s no hiding behind monthly sampling anymore. Every deviation, every spike, every malfunction of your ETP is now visible to regulators. This transparency is designed to prevent the “clean up before inspection” practices that plagued enforcement in the past.
Operational Requirements
Your OCEMS must be:
Calibrated regularly by certified agencies
Maintained to prevent downtime
Integrated with your ETP control systems
Equipped with automatic alerts for parameter exceedances
Protected from tampering (regulatory seals and audit trails)
Sector-Specific Compliance Requirements
While the core parameters apply across industries, certain sectors face additional scrutiny and specialized requirements.
Textile and Dyeing Industries
Tirupur, Surat, and other textile hubs face strict color removal requirements. Your effluent must be free of visible dye content, and advanced oxidation processes or biological color removal systems may be necessary. Given the complex chemistry of modern dyes, bioremediation using dye-degrading microbial strains offers a cost-effective alternative to expensive chemical oxidation.
Tanneries
The leather processing industry faces particularly stringent standards for chromium removal. Total chromium must be reduced to trace levels, and hexavalent chromium must be completely eliminated. Chrome recovery systems and specialized bioremediation protocols for chromium reduction can significantly reduce treatment costs while ensuring compliance.
Distilleries
With extremely high BOD and COD in raw effluent, distilleries require robust primary treatment followed by intensive biological processing. Many distilleries are now exploring biomethanation combined with advanced bioremediation to not only meet discharge norms but also generate renewable energy from their waste.
Pharmaceutical Manufacturing
The pharmaceutical sector generates effluent with antibiotics, active pharmaceutical ingredients (APIs), and other recalcitrant compounds. Conventional ETPs often struggle with these molecules. Specialized microbial consortia capable of degrading pharmaceutical compounds represent a breakthrough in making pharmaceutical wastewater treatment both effective and economical.
Chemical Industries
The Vapi and Ankleshwar clusters are under intense regulatory pressure. Chemical effluent varies widely in composition, requiring customized treatment approaches. The key is process-specific treatment trains that address your particular chemical profile rather than generic solutions.
Old vs. New: What’s Changed in 2026
Parameter
Pre-2026 Standards
2026 Standards
Change
BOD
30 mg/L
10 mg/L
66% reduction
COD
250 mg/L
50 mg/L
80% reduction
TSS
100 mg/L
10 mg/L
90% reduction
pH
5.5 to 9.0
6.5 to 8.5
Narrower range
Fecal Coliform
1000 MPN/100 mL
100 MPN/100 mL
90% reduction
OCEMS
Optional
Mandatory
New requirement
ZLD
Limited sectors
Expanded sectors
Wider application
Ammoniacal Nitrogen (NH₃–N)
50 mg/L (or not consistently enforced across sectors)
≤ 5 mg/L
Up to 90% reduction & stricter enforcement
The table tells the story: we’re not talking about minor adjustments. These are fundamental shifts requiring serious process reengineering for most facilities.
How Bioremediation Helps You Stay Compliant
Traditional chemical treatment approaches can meet the 2026 norms, but at what cost? Chemical consumption, sludge generation, energy requirements, and operational complexity all escalate dramatically when pushing for ultra-low discharge parameters.
This is where bioremediation offers a game-changing alternative.
What Is Industrial Bioremediation?
Bioremediation uses carefully selected and cultivated microbial consortia to break down pollutants in industrial wastewater. Unlike generic activated sludge processes, modern bioremediation employs specialized bacterial and fungal strains optimized for specific industrial contaminants.
Advantages for 2026 Compliance
Lower Chemical Costs: Biological treatment replaces or reduces the need for expensive coagulants, flocculants, and oxidizing agents.
Reduced Sludge Generation: Microorganisms convert pollutants into biomass more efficiently than chemical precipitation, resulting in 30-50% less sludge to dispose of.
Energy Efficiency: Advanced bioremediation systems operate at ambient temperatures and pressures, unlike energy-intensive chemical oxidation or thermal processes.
Consistent Performance: Once established, microbial consortia maintain stable treatment performance with less sensitivity to load variations than chemical systems.
Tackles Complex Pollutants: Specialized microbes can degrade compounds that resist conventional treatment, including certain dyes, phenols, and pharmaceutical residues.
Real-World Application
Consider a mid-sized textile unit in Tirupur struggling to meet the new BOD and COD limits. After augmenting their existing ETP with targeted bioremediation cultures, they achieved:
BOD consistently below 8 mg/L (versus 15-20 mg/L previously)
COD reduced from 80 mg/L to 45 mg/L
40% reduction in chemical consumption
35% less sludge production
The capital investment was modest compared to a complete ETP overhaul, and the payback period was under 18 months through operational savings alone.
Your Compliance Checklist
Use this practical checklist to assess your current readiness for the 2026 CPCB discharge norms:
Effluent Quality Assessment
Have you conducted recent comprehensive testing of your final effluent for all 2026 parameters?
Do you consistently meet BOD ≤ 10 mg/L?
Do you consistently meet COD ≤ 50 mg/L?
Do you consistently meet TSS ≤ 10 mg/L?
Is your pH consistently between 6.5 and 8.5?
Does your fecal coliform count stay below 100 MPN/100 mL?
Infrastructure and Systems
Is your ETP capacity adequate for current and projected production volumes?
Have you separated sewage and industrial wastewater streams as required?
Do you have appropriate primary, secondary, and tertiary treatment stages?
Is your ETP operator trained and certified?
Do you have a written standard operating procedure for your ETP?
Is there a preventive maintenance schedule being followed?
Monitoring and Compliance
Have you installed OCEMS as required for your industry category?
Is your OCEMS data being successfully transmitted to the SPCB?
Are you maintaining required records and laboratory test reports?
Do you have a mechanism to respond immediately to parameter exceedances?
Have you obtained or renewed your consent to operate under the new norms?
Sector-Specific Requirements
Have you identified any special parameters applicable to your industry?
Do you meet sector-specific discharge limits for your category?
If required, have you implemented ZLD or are you progressing toward it?
Process Optimization
Have you evaluated whether your current treatment process can consistently meet 2026 norms?
Have you considered upgrading to more efficient biological treatment technologies?
Have you explored bioremediation as a cost-effective compliance solution?
Do you have a contingency plan for treatment system failures?
Documentation and Legal Compliance
Is your consent to establish/operate current and valid?
Have you submitted revised consent applications under 2026 norms?
Are you maintaining all required records as per SPCB requirements?
Have you designated an environmental compliance officer?
Taking Action Before It’s Too Late
If you’ve gone through this checklist and found gaps, you’re not alone. Most industrial facilities in India need to make at least some adjustments to meet the 2026 standards. The question is: will you be proactive or reactive?
The industries that wait for a show-cause notice will face:
Forced shutdowns during critical production periods
Emergency equipment purchases at premium prices
Rushed implementations that may not deliver sustainable results
Legal costs and potential criminal prosecution
Damage to business relationships and brand reputation
The industries that act now will:
Implement solutions systematically with minimal disruption
Benefit from better pricing through planned procurement
Optimize their solutions for both compliance and operational efficiency
Build a reputation as responsible corporate citizens
Avoid regulatory actions entirely
Why Team One Biotech
At Team One Biotech, we understand that compliance isn’t just about meeting numbers on paper. It’s about building treatment systems that work reliably, day after day, without consuming your profits in chemicals and energy.
Our bioremediation solutions are designed specifically for Indian industrial conditions. We’ve worked with textile mills in Tamil Nadu, tanneries in Uttar Pradesh, pharmaceutical plants in Himachal Pradesh, and chemical facilities in Gujarat. We understand your operational constraints, your water chemistry, and the regulatory environment you navigate.
We don’t just sell you a product. We partner with you to:
Assess your current ETP performance against 2026 norms
Identify the most cost-effective pathway to compliance
Implement customized bioremediation solutions
Provide ongoing support and optimization
Help you maintain consistent compliance
The 2026 CPCB discharge norms represent a new era in environmental regulation in India. Industries that embrace this change and invest in sustainable, efficient treatment solutions won’t just survive, they’ll thrive with lower operating costs and enhanced reputation.
Don’t wait for a show-cause notice. Contact Team One Biotech today for a customized bioremediation plan that ensures your facility meets 2026 standards while reducing your treatment costs. Your compliance deadline is approaching. Let’s get started.
Looking to improve your ETP/STP efficiency with the right bioculture? Talk to our experts at Team One Biotech for customised microbial solutions.
It’s 6:47 AM. Your phone rings. The security guard reports that the residents from the neighboring colony are gathered at the plant gate, again. The smell from your ETP/STP has become unbearable overnight. You’ve masked it with deodorizers twice this week, but the stench returns within hours. Worse, you know the State Pollution Control Board inspection is scheduled for next month, and that odor is evidence of something deeper: your treatment system is failing.
If you’re a Plant Manager or EHS Officer at an industrial facility in India, this scenario isn’t hypothetical. It’s a recurring nightmare. The foul odor emanating from your Sewage Treatment Plant isn’t just a public relations problem or a neighbor complaint, it’s a red flag that your effluent quality is deteriorating, your microbial ecosystem is collapsing, and you’re inching closer to a Notice of Violation from the CPCB or SPCB.
But here’s what most people don’t understand: the smell is not the disease. It’s the symptom. Your ETP/STP odor is your plant’s way of screaming that its biological processes have broken down. And the good news? The same biological forces that created the problem can fix it, permanently. Not through perfumes, not through chemical band-aids, but through precision bioremediation using targeted bacterial consortia.
At Team One Biotech, we’ve spent over two decades helping Indian industries restore their ETP/STPs from the microbial level up. In this article, we’ll walk you through the five most common root causes of ETP/STP odor and, more importantly, how specialized bacteria solve each one at the source.
Why Odor is a Compliance Risk, Not Just a Nuisance
Let’s be clear: under India’s revised wastewater discharge standards (notified by the Ministry of Environment, Forest and Climate Change in 2015 and enforced by CPCB/SPCBs), industries must meet strict BOD (Biochemical Oxygen Demand) and TSS (Total Suspended Solids) limits. While odor itself isn’t a direct parameter in the discharge consent, persistent odor is prosecutable evidence of incomplete treatment.
The National Green Tribunal (NGT) has repeatedly ruled against facilities where odor complaints indicate violations of environmental norms. In 2019, the NGT imposed penalties on multiple common effluent treatment plants (CETPs) across Gujarat and Tamil Nadu specifically citing “persistent foul odor” as proof of process failure. When your ETP/STP smells, it signals:
Incomplete anaerobic digestion (leading to H₂S and mercaptans)
All of these translate to elevated BOD/COD levels in your final discharge, a direct violation that can result in plant shutdowns, hefty fines, and criminal liability under the Water (Prevention and Control of Pollution) Act, 1974.
Now let’s diagnose the five usual suspects.
The Core 5 Causes of ETP/STP Odor (and the Bacterial Solutions)
1. Low Dissolved Oxygen: When Your Aeration Tank Turns Septic
The Human Problem
Walk past your aeration tank. If it smells like rotten eggs, you have an anaerobic zone where aerobic bacteria should be thriving. In India’s humid, high-temperature climate (often 35–42°C in summer), oxygen solubility drops, and blowers struggle to maintain the required 2–4 mg/L dissolved oxygen (DO). When DO falls below 1 mg/L, aerobic bacteria die off, and facultative anaerobes take over, producing hydrogen sulfide (H₂S), the signature “rotten egg” smell.
Your effluent’s BOD shoots up because organic matter isn’t being oxidized. Your plant fails compliance, and the stench travels across the fence line.
The Bacterial Solution
Introducing high-efficiency aerobic heterotrophs from genera like Bacillus and Pseudomonas can restore balance even in sub-optimal DO conditions. These strains exhibit:
Lower oxygen saturation requirements: They can metabolize organics at DO levels as low as 0.5–1.0 mg/L.
Rapid biofilm formation: They colonize media surfaces, creating localized aerobic micro-zones even when bulk liquid DO is marginal.
Suppression of sulfate-reducing bacteria (SRB): By outcompeting SRBs for nutrients, they prevent H₂S generation at the source.
When we deploy our Bio-Aero Plus formulation at textile units in Tiruppur or pharmaceutical plants in Hyderabad, we typically see H₂S levels drop by 70–90% within 7–10 days, even before mechanical upgrades to aeration systems.
2. Sludge Overload: The Silent Killer of Microbial Balance
The Human Problem
Your sludge has been accumulating for months. The desludging schedule slipped because of budget constraints or contractor delays. Now, your clarifier is overflowing with thick, black sludge, and the smell is unbearable, like decaying flesh mixed with ammonia.
Excess sludge means excess dead biomass. As it decomposes anaerobically at the tank bottom, it releases volatile fatty acids (VFAs), ammonia, and indoles, all of which are pungent, toxic, and indicative of system overload. Your MLSS (Mixed Liquor Suspended Solids) is skyrocketing beyond 4,000–5,000 mg/L, suffocating your active bacteria.
The Bacterial Solution
Specialized cellulolytic and proteolytic bacteria can digest the accumulated sludge biomass in situ, reducing sludge volume by 30–50% without mechanical desludging. These include:
Cellulolytic strains (Cellulomonas, Actinomycetes): Break down complex polysaccharides in dead cell walls.
Proteolytic strains (Bacillus licheniformis, Proteus): Hydrolyze proteins into peptides and amino acids, which are then mineralized aerobically.
Lipolytic bacteria: Degrade fats, oils, and grease (FOG) that contribute to sludge bulk.
At a dairy processing plant in Anand, Gujarat, we reduced clarifier sludge depth from 1.8 meters to 0.6 meters in 45 days using our Sludge-Digest Pro blend, eliminating the putrid odor and restoring SVI (Sludge Volume Index) to acceptable levels.
3. Hydrogen Sulfide (H₂S): The Rotten Egg Menace
The Human Problem
This is the odor everyone recognizes, sharp, nauseating, and dangerous. H₂S isn’t just unpleasant; at concentrations above 100 ppm, it’s toxic to your operators. At 500 ppm, it can cause respiratory failure.
H₂S forms when sulfate-reducing bacteria (common in tannery, textile, and paper mill effluents) convert sulfates (SO₄²⁻) into sulfides under anaerobic conditions. Indian industrial wastewater often has sulfate concentrations exceeding 500 mg/L, especially in leather clusters (Chennai, Kanpur) and textile hubs (Surat, Ludhiana). When your primary clarifier or equalization tank turns anaerobic, SRBs proliferate.
The Bacterial Solution
The answer lies in sulfide-oxidizing bacteria (SOB) and nitrate-utilizing facultative anaerobes. Here’s how they work:
Thiobacillus species oxidize H₂S into elemental sulfur (S⁰) or sulfate (SO₄²⁻) in the presence of even trace oxygen.
Denitrifying bacteria (Paracoccus denitrificans) use nitrate (NO₃⁻) as an electron acceptor to oxidize sulfides, effectively “breathing nitrate” instead of oxygen.
We’ve deployed this strategy at a tannery CETP in Ranipet, Tamil Nadu, where H₂S levels exceeded 150 ppm. By dosing Team One Biotech’s Sulfi-Control consortium, we reduced H₂S to below 5 ppm within three weeks, simultaneously lowering sulfate in the final effluent from 620 mg/L to 180 mg/L.
4. pH Imbalance: Acid Shocks and Ammonia Spikes
The Human Problem
Your ETP/STP receives shock loads, acidic rinse water from a pickling line (pH 3.2) or alkaline caustic wash (pH 11.5). The pH swings kill your nitrifying bacteria, and suddenly your aeration tank smells like ammonia (pungent, sharp, like cat urine). Ammonia (NH₃) volatilizes at pH above 8.5, and the smell becomes overpowering, especially in open tanks under the Indian sun.
The Bacterial Solution
Buffer-tolerant nitrifiers and pH-adaptive heterotrophs are the key. These include:
Nitrosomonas europea and Nitrobacter winogradskyi: Hardy nitrifiers that can withstand pH fluctuations between 6.5 and 9.0 (versus standard strains that die outside 7.0–8.0).
Alkali-tolerant Bacillus strains: Maintain organic degradation even at pH 9.5–10.
Our pH-Adapt Bio formulation contains encapsulated bacterial spores that activate only when pH stabilizes, preventing washout during shock events. At a chemical manufacturing unit in Vapi, Gujarat, we eliminated ammonia odor within 10 days post-shock, restoring nitrification efficiency from 22% to 87%.
5. Poor Microbial Diversity: Monoculture Collapse
The Human Problem
Your ETP/STP was commissioned years ago. The “return activated sludge” has been recycling the same bacterial population for so long that it’s become a monoculture, vulnerable, slow, and unable to handle variable influent. When a new pollutant enters (say, a surfactant change or a new dye), your bacteria can’t adapt. Organics accumulate, ferment anaerobically, and produce foul-smelling VFAs (valeric acid, butyric acid, think vomit and rancid butter).
The Bacterial Solution
Bioaugmentation with a multi-genus consortium re-establishes ecological diversity. Think of it as forest restoration, you don’t plant one tree species; you plant an ecosystem. Our consortia include:
Generalists (Bacillus subtilis, Pseudomonas putida): Degrade a wide range of organics.
Specialists: Target specific compounds (e.g., Rhodococcus for phenols, Acinetobacter for long-chain hydrocarbons).
Synergists: Produce biosurfactants and enzymes that help other bacteria access substrates.
At a pharmaceutical formulation plant in Baddi, Himachal Pradesh, we introduced our Diversity-Plus blend, increasing bacterial genera count from 6 to 18 within 60 days. Odor complaints dropped to zero, and COD removal efficiency jumped from 68% to 91%.
Why Bacteria Win Over Chemicals
You might be tempted to dump ferric chloride to precipitate sulfides, or dose hydrogen peroxide to oxidize organics. These work, temporarily. But they don’t solve the root cause. Chemicals:
Create more sludge (chemical precipitates add to disposal burden)
Cost more over time (recurring chemical purchases vs. one-time bioaugmentation)
Bacteria, on the other hand, are self-sustaining. Once established, they reproduce, adapt, and maintain treatment performance as long as conditions are suitable. They convert pollutants into CO₂, water, and harmless biomass, no secondary waste, no residuals. And in India’s regulatory environment, where environmental audits now scrutinize “green” technologies, bioremediation demonstrates your commitment to sustainable compliance.
The Path to an Odorless, Compliant Plant
The foul odor from your ETP/STP isn’t a life sentence. It’s a diagnosis, and every diagnosis has a treatment. Whether it’s low dissolved oxygen, sludge overload, H₂S formation, pH shocks, or microbial collapse, targeted bacterial consortia can restore your treatment plant’s ecosystem, eliminate odors at the source, and bring you back into CPCB compliance.
At Team One Biotech, we don’t just sell bacteria, we engineer solutions. We analyze your influent, diagnose your microbial gaps, and deploy precision bio-cultures tailored to Indian industrial conditions. We’ve helped over 300 plants across sectors eliminate odor, reduce BOD/COD, and pass SPCB inspections on the first attempt.
Your neighbors shouldn’t have to smell your business. And you shouldn’t have to lose sleep over inspections.
Ready to Fix Your ETP/STP Odor Problem for Good?
Because clean water isn’t just compliance. It’s our responsibility.
Looking to improve your ETP/STP efficiency with the right bioculture? Talk to our experts at Team One Biotech for customised microbial solutions.
For textile manufacturers across Tirupur, Surat, Ahmedabad, Panipat, and Ludhiana, the pressure has never been greater. The Central Pollution Control Board (CPCB) and National Green Tribunal (NGT) have tightened environmental norms to unprecedented levels, with BOD limits for inland surface water discharge now fixed at 30 mg/L and COD at 250 mg/L. Non-compliance is no longer met with warnings, it results in immediate closure notices, hefty penalties, and permanent damage to brand reputation.
Beyond regulatory consequences lies a deeper responsibility. The Ganga, Yamuna, and countless other rivers that have sustained Indian civilization for millennia are choking under industrial pollution. As textile manufacturers, you are the custodians of both economic growth and environmental legacy. The question is no longer whether to comply, but how to do so sustainably and cost-effectively.
Before addressing solutions, we must understand the problem at a molecular level.
Biological Oxygen Demand (BOD) measures the amount of dissolved oxygen required by aerobic microorganisms to break down organic matter in water. High BOD indicates substantial organic pollution that depletes oxygen levels in water bodies, suffocating aquatic life.
Chemical Oxygen Demand (COD) represents the total quantity of oxygen required to oxidize all organic compounds in water, both biodegradable and non-biodegradable. COD is always higher than BOD and includes synthetic chemicals that biological processes cannot easily break down.
In textile processing, particularly during sizing, desizing, scouring, bleaching, mercerizing, and dyeing, wastewater becomes loaded with:
Starch and sizing agents from yarn preparation
Waxes, pectins, and oils from natural fibers
Complex azo dyes and reactive dyes containing aromatic rings
Surfactants and detergents from washing processes
Heavy metals like chromium, copper, and zinc from certain dye fixatives
Alkalis and acids from pH adjustment stages
These compounds create COD levels that frequently exceed 3,000-5,000 mg/L in raw textile effluent, far beyond CPCB permissible limits. Traditional Effluent Treatment Plants (ETPs) using chemical coagulation and oxidation struggle to consistently achieve compliance, especially with the recalcitrant synthetic dyes that characterize modern textile production.
The Regulatory Landscape: CPCB Wastewater Norms 2026 and Beyond
The regulatory environment in India has evolved dramatically. The CPCB, under direction from the NGT, has implemented stringent standards that reflect international best practices:
For Inland Surface Water Discharge:
BOD: 30 mg/L (previously 100 mg/L in many states)
COD: 250 mg/L
Total Suspended Solids (TSS): 100 mg/L
pH: 5.5-9.0
Color: Must be removable to meet visual acceptance criteria
For Land Disposal:
Even stricter parameters apply, with BOD limits at 100 mg/L
Zero Liquid Discharge (ZLD) Mandates: Many textile clusters, particularly in water-stressed regions, now face ZLD compliance requirements, meaning every drop of wastewater must be treated and recycled.
State Pollution Control Boards (SPCBs) conduct surprise inspections with real-time monitoring equipment. Non-compliance results in:
Immediate production shutdowns
Penalties ranging from Rs. 5 lakhs to Rs. 25 lakhs
Prosecution under the Water (Prevention and Control of Pollution) Act, 1974
Blacklisting from export markets demanding environmental certifications
The harsh reality is that chemical-heavy ETPs are failing to meet these standards consistently. They generate massive sludge volumes, require continuous chemical procurement, and struggle with the color removal essential for visual compliance.
Bioremediation for Industrial Wastewater Treatment
Bioremediation represents a paradigm shift from chemical warfare against pollutants to biological intelligence. Instead of attempting to chemically oxidize every molecule, we harness nature’s own pollution-fighting mechanisms through specialized microorganisms and enzymes.
Bioaugmentation: Engineering Microbial Consortia for Textile Effluent
Bioaugmentation involves introducing highly specialized bacterial and fungal strains specifically selected for their ability to degrade textile pollutants. At Team One Biotech, we have developed microbial consortia that include:
Bacteria:
Pseudomonas species for aromatic compound breakdown
Bacillus species for complex organic matter degradation
Aspergillus and Penicillium species for comprehensive organic matter utilization
These microorganisms work in synergy within your existing ETP infrastructure. Unlike chemical treatments that indiscriminately attack all molecules, bioaugmentation is selective, microbes metabolize pollutants as food sources, converting them into harmless CO2, water, and biomass.
The mechanism is elegant: Azo dyes, which constitute 60-70% of textile dyes, contain nitrogen-nitrogen double bonds (N=N) that are resistant to conventional treatment. Specialized bacterial azoreductase enzymes cleave these bonds under anaerobic conditions, followed by aerobic bacteria that completely mineralize the resulting aromatic amines.
This two-stage process achieves COD reduction of 60-80% and BOD reduction of 85-95%, bringing effluent parameters well within CPCB limits.
Enzymatic Treatment: Precision Catalysis for Synthetic Dye Breakdown
While microbial consortia provide comprehensive treatment, enzymatic bioremediation offers targeted precision. Enzymes are biological catalysts that accelerate specific chemical reactions without being consumed.
Key enzymes for textile effluent treatment include:
Laccase: Oxidizes phenolic compounds and aromatic amines from dye degradation Peroxidases: Break down hydrogen peroxide-resistant dyes Azoreductase: Specifically cleaves azo bonds in synthetic dyes Cellulase and Amylase: Degrade sizing agents and finishing compounds
Enzymatic treatment operates under mild conditions (neutral pH, ambient temperature) and produces minimal secondary pollution. When combined with microbial bioaugmentation, enzymes can reduce treatment time by 40-50%, crucial for industries operating at high production volumes.
Economic Benefits: The Business Case for Natural Wastewater Treatment
Shifting to bioremediation is not merely an environmental compliance strategy, it represents significant operational savings:
Reduced Chemical Costs: Eliminate or drastically reduce consumption of alum, ferric chloride, lime, and expensive oxidizers like hydrogen peroxide. Annual savings typically range from Rs. 15-30 lakhs for medium-sized operations.
Lower Sludge Generation: Chemical coagulation produces 3-5 kg of sludge per cubic meter of wastewater. Biological treatment generates 60-70% less sludge, reducing disposal costs and landfill requirements.
Decreased Energy Consumption: Natural processes require less mechanical aeration. Algal oxygen production can reduce aeration energy by 20-35%.
Compliance Assurance: Consistent parameter achievement eliminates penalty risks and production shutdowns. The cost of a single closure often exceeds the investment in biological treatment systems.
Water Recycling Potential: Biologically treated water is suitable for secondary uses like cooling, gardening, and certain process applications, supporting ZLD compliance and reducing freshwater procurement.
Across India’s textile heartlands, forward-thinking manufacturers are already experiencing the bioremediation advantage:
Tirupur Textile Cluster: Multiple dyeing units have integrated bioaugmentation into Common Effluent Treatment Plants (CETPs), achieving consistent BOD levels below 20 mg/L and enabling water reuse for up to 40% of non-process applications.
Surat Manufacturing Units: Individual ETPs enhanced with enzymatic treatment systems have reduced color levels by 85-90%, meeting the stringent visual discharge standards that chemical treatment struggled to achieve.
Panipat Processors: Textile processors dealing with heavy sizing loads have deployed microbial consortia specifically tailored for starch and PVA degradation, reducing COD by 70% in primary treatment stages alone.
These are not laboratory experiments, they are operational realities demonstrating that natural wastewater treatment for textile effluent is both technically viable and economically superior.
India’s Transition to Green Chemistry in Textile Processing
India stands at a crossroads. We can continue with chemical-intensive treatment that produces hazardous secondary waste and barely meets compliance standards, or we can embrace biological intelligence that works with nature rather than against it.
The transition to bioremediation represents more than regulatory compliance, it is a commitment to sustainable manufacturing, to preserving the waterways that define Indian heritage, and to building textile industries that future generations will be proud of.
At Team One Biotech, we have dedicated over a decade to developing microbial solutions specifically engineered for Indian industrial conditions. Our bioremediation products are not generic imports, they are formulated from strains isolated and optimized for the exact pollutants, temperatures, and pH ranges found in Indian textile effluent.
Ready to Transform Your Wastewater Treatment System?
The question is simple: Can you afford to continue with outdated chemical treatment when natural solutions offer superior results at lower costs?
Your compliance solution is not in a chemical drum, it is in the intelligence of nature, optimized by science, and delivered by Team One Biotech.
Looking to improve your ETP/STP efficiency with the right bioculture? Talk to our experts at Team One Biotech for customised microbial solutions.
When the Tap Runs Dry: India’s Industrial Water Reckoning
Imagine It’s 2026, and the Noyyal River in Tamil Nadu, once the lifeline of Tirupur’s textile industry, has been declared biologically dead for the third consecutive year. The Central Pollution Control Board has shut down 47 dyeing units in a single month. A Plant Manager in Surat receives a notice: achieve zero liquid discharge within 90 days or face permanent closure.
This isn’t a dystopian future. This is the reality unfolding across India’s industrial corridors today.
Every year, Indian industries discharge approximately 13,468 million liters of wastewater daily, with only 60% receiving adequate treatment. The NITI Aayog has warned that 21 major cities, including Delhi, Bengaluru, and Hyderabad, will run out of groundwater by 2030. For industrial leaders, the question is no longer “Can we afford to treat wastewater?” but rather “Can we afford not to?”. In this guide, you will understand Why Bioremediation & Biocultures In Wastewater Treatment and Compliance in India is a must.
This guide exists for the Plant Manager who lies awake worrying about the next SPCB inspection, the CEO balancing profit margins with planetary responsibility, and the Environmental Officer seeking solutions that actually work in Indian conditions. Because wastewater treatment is not merely a compliance checkbox, it is the legacy we leave for our children, the difference between sustainable growth and environmental bankruptcy.
India’s Industrial Wastewater Crisis
The Scale of the Challenge
India’s industrial growth story is also a water consumption story. The textile industry alone consumes 1,600 billion liters annually, with Tirupur’s 600 dyeing units generating 100 million liters of effluent daily. The pharmaceutical clusters in Hyderabad release complex chemical compounds that conventional treatment plants struggle to neutralize. Sugar mills in Uttar Pradesh operate seasonally, creating treatment challenges that demand adaptive solutions.
The problem compounds when we consider the diversity of Indian industries: automotive manufacturing in Chennai, leather tanning in Kanpur, food processing in Punjab, and chemical manufacturing across Gujarat. Each sector produces unique pollutants requiring specialized treatment approaches, yet many facilities still rely on decades-old chemical treatment methods designed for Western industrial conditions.
The Regulatory Landscape: Beyond Compliance to Survival
The regulatory framework governing industrial wastewater in India has undergone seismic shifts. The National Green Tribunal now possesses the authority to impose penalties reaching up to Rs. 25 crore for severe violations. State Pollution Control Boards have become increasingly vigilant, conducting surprise inspections and mandating real-time effluent monitoring systems.
Key regulatory bodies shaping compliance in 2026:
Central Pollution Control Board (CPCB): Sets national discharge standards and monitors state-level implementation
State Pollution Control Boards (SPCBs): Enforce regulations, issue consents, and conduct facility inspections
National Green Tribunal (NGT): Adjudicates environmental disputes with binding authority
Ministry of Environment, Forest and Climate Change: Formulates national policy frameworks
The shift from periodic testing to continuous online monitoring represents a fundamental change. Industries in critically polluted areas, classified as such by CPCB, face zero liquid discharge mandates, requiring complete water recycling with no external discharge.
The 2026 CPCB Compliance Checklist: Your Non-Negotiable Standards
This definitive checklist represents the minimum requirements for industrial effluent discharge in 2026. Non-compliance results in consent withdrawal, production shutdowns, and potential criminal proceedings under the Water (Prevention and Control of Pollution) Act, 1974.
General Discharge Standards (Into Public Sewers/Surface Water)
Critical Parameters:
pH Level: 5.5 to 9.0 (strict enforcement, acidic or alkaline discharge results in immediate notices)
Biochemical Oxygen Demand (BOD): Maximum 30 mg/L for discharge into surface water; 350 mg/L for sewers
Chemical Oxygen Demand (COD): Maximum 250 mg/L for surface water; not exceeding 3 times BOD value
Total Suspended Solids (TSS): Maximum 100 mg/L for surface water; 600 mg/L for sewers
Total Dissolved Solids (TDS): Maximum 2,100 mg/L (critical for textile and chemical industries)
Oil and Grease: Maximum 10 mg/L for surface water; 20 mg/L for sewers
Ammoniacal Nitrogen: Maximum 50 mg/L
Total Kjeldahl Nitrogen: Maximum 100 mg/L
Industry-Specific Standards
Textile Industry (Dyeing and Printing Units):
Color: Maximum 1 unit on ADMI scale after dilution
Chlorides: Maximum 1,000 mg/L
Sulphides: Maximum 2 mg/L
Phenolic compounds: Maximum 1 mg/L
Pharmaceutical Manufacturing:
Antibiotics: Not detectable in discharge
Heavy metals (Combined): Maximum 2 mg/L
Specific limits for copper, zinc, chromium, and nickel
Food Processing and Beverage Industries:
BOD: Maximum 30 mg/L (stringent due to organic load)
Residual chlorine: Maximum 1 mg/L
Leather Tanning:
Total chromium: Maximum 2 mg/L
Sulphides: Maximum 2 mg/L
TDS: Maximum 2,100 mg/L (critical parameter)
Monitoring and Documentation Requirements
Continuous Online Monitoring Systems: Mandatory for industries in red and orange categories
Monthly Testing: All critical parameters must be tested by NABL-accredited laboratories
Record Maintenance: Minimum 5-year retention of all test reports, consent documents, and operational logs
Annual Environmental Statement: Submission to SPCB by May 30th each year
Natural Solutions for COD and BOD Reduction
The Science Behind Bioremediation
Traditional wastewater treatment relies heavily on chemical coagulants like alum, ferric chloride, and lime to precipitate pollutants. While effective at removing suspended solids, these methods create massive volumes of toxic sludge and fail to address dissolved organic compounds that drive COD and BOD levels.
Biological treatment represents a paradigm shift. Specialized microbial cultures, carefully selected strains of bacteria that naturally occur in soil and water, consume organic pollutants as their food source. This isn’t genetic engineering; it’s nature optimized for industrial conditions.
How Specialized Microbial Cultures Break Down Complex Organics
In textile effluents, the challenge is formidable: synthetic dyes contain azo bonds, aromatic rings, and complex hydrocarbon chains that resist conventional breakdown. Here’s how targeted bioremediation works:
Stage One: Enzymatic Attack Specialized bacteria produce extracellular enzymes, azoreductases, laccases, and peroxidases, that cleave the molecular bonds of dye compounds. The azo bond (-N=N-), which gives dyes their color stability, becomes the bacteria’s primary target. These enzymes break complex molecules into simpler intermediate compounds.
Stage Two: Metabolic Conversion The bacterial cultures metabolize these intermediate compounds through their cellular respiration processes. What was once a toxic dye molecule becomes carbon dioxide, water, and new bacterial biomass. This is true mineralization, complete conversion of pollutants into harmless end products.
Stage Three: Consortium Synergy No single bacterial species can handle the diversity of compounds in industrial wastewater. Team One Biotech’s formulations contain carefully balanced consortiums where different species specialize in different compound classes. While Pseudomonas species excel at aromatic compound breakdown, Bacillus strains handle lipids and proteins. Nitrosomonas bacteria convert ammonia to nitrates, addressing nitrogen parameters.
The Technical Advantage: Why Biology Outperforms Chemistry
Parameter-Specific Reduction:
BOD Reduction: Biological cultures achieve 85-95% BOD reduction naturally, compared to 60-70% with chemical treatment alone
COD Reduction: Complex organics that inflate COD readings are systematically degraded, achieving reductions from 1,500 mg/L to under 250 mg/L without coagulants
Color Removal: Enzymatic decolorization removes color at the molecular level rather than merely precipitating it into sludge
The critical difference lies in selectivity. Chemical coagulants precipitate everything indiscriminately, creating massive sludge disposal challenges. Bacteria target specific pollutants, converting them into non-toxic biomass that settles efficiently and can even be composted in some applications.
Solving the Silent Crisis: Odor Control Through Biological Intervention
The Five Root Causes of Foul Odor in STPs
Industrial Sewage Treatment Plants often become neighborhood nuisances due to overwhelming odors. Understanding the source is essential to implementing effective solutions.
Cause One: Hydrogen Sulfide (H₂S) Generation When organic matter decomposes under anaerobic conditions, in septic tanks, collection sumps, or poorly aerated zones, sulfate-reducing bacteria convert sulfates into hydrogen sulfide. This compound produces the characteristic “rotten egg” smell and is toxic at elevated concentrations.
Cause Two: Anaerobic Pockets in Aeration Tanks Insufficient dissolved oxygen creates microenvironments where anaerobic degradation dominates. These pockets generate volatile fatty acids, mercaptans, and indoles, all malodorous compounds that pervade the entire facility.
Cause Three: Septic Influent When wastewater remains in collection systems too long before treatment, it turns septic. The transition from aerobic to anaerobic metabolism releases ammonia, volatile sulfur compounds, and organic acids that create penetrating odors.
Cause Four: Sludge Putrefaction Accumulated sludge in clarifiers or thickeners undergoes anaerobic decay if not removed promptly. Dead bacterial biomass becomes substrate for putrefactive bacteria, generating offensive odors.
Cause Five: Inadequate Mixing and Dead Zones Poor hydraulic design creates stagnant zones where solids accumulate and decompose anaerobically. These dead zones become continuous odor sources regardless of overall system performance.
The Biological Mechanism of Odor Neutralization
Team One Biotech’s odor control formulations don’t mask smells, they eliminate the compounds generating them through three biological pathways.
Pathway One: Direct Sulfur Oxidation Specialized Thiobacillus species oxidize hydrogen sulfide directly to elemental sulfur and sulfate. These chemoautotrophic bacteria derive energy from sulfur compound oxidation, rapidly converting H₂S to odorless forms. The reaction is elegant: H₂S + O₂ → S⁰ + H₂O, followed by further oxidation to sulfate.
Pathway Two: Enhanced Aerobic Metabolism By dramatically increasing the population of efficient aerobic bacteria, biological additives shift the metabolic balance. These bacteria outcompete slower-growing anaerobic species for substrate, preventing the formation of odorous intermediate compounds. The result is rapid, complete oxidation of organics to CO₂ and H₂O rather than partial degradation to smelly intermediates.
Pathway Three: Nitrification Enhancement Ammonia, a major odor component, is systematically converted to nitrate through biological nitrification. Nitrosomonas bacteria oxidize ammonia to nitrite, while Nitrobacter species complete the conversion to nitrate. Both forms are odorless, and the process occurs at neutral pH without chemical addition.
The Biofilm Advantage: In properly managed systems, beneficial bacteria colonize all surfaces, creating active biofilms that continuously process odorous compounds before they volatilize into the air. This represents persistent, 24/7 odor control rather than periodic chemical treatment.
Financial Case Study: The 30% Cost Reduction Reality
Company Profile: Midsize Textile Processing Unit, Surat
Facility Specifications:
Effluent generation: 500 KLD (kiloliters per day)
Primary pollutants: High COD (2,200 mg/L), elevated BOD (650 mg/L), color from reactive dyes
Treatment system: Conventional physico-chemical ETP with biological secondary treatment
The Pre-Intervention Reality
Monthly Chemical Consumption:
Alum (coagulant): 15,000 kg @ Rs. 18/kg = Rs. 270,000
Qualification for green financing at preferential interest rates
Reduced regulatory scrutiny, allowing focus on production rather than compliance management
Improved employee morale and retention in plant operations
The 30% figure represents the conservative estimate focusing solely on chemical and sludge costs. When accounting for penalty avoidance, reduced labor, and operational efficiency, total cost reduction approached 43%.
Conventional Treatment vs. Team One Biotech Bioremediation: A Comparative Analysis
Phase 2: Biological Seeding and Acclimatization (Week 3-6)
Introduction of specialized microbial consortiums must be staged carefully to avoid shocking existing biological systems:
Week 3: Initial seeding at 25% of recommended dosage, monitoring dissolved oxygen and pH stability
Week 4: Increase to 50% dosage, begin reducing chemical coagulant by 20%
Week 5: Full biological dosage achieved, chemical coagulant reduced by 40%
Week 6: System stabilization, monitoring for consistent COD/BOD reduction
Phase 3: Optimization and Chemical Reduction (Week 7-12)
As biological populations establish dominance, chemical dependencies decrease systematically. Daily monitoring guides gradual reductions while maintaining discharge compliance.
Phase 4: Sustained Performance and Continuous Improvement (Month 4+)
Established biological systems require ongoing nutrient balancing and periodic reseeding to maintain populations. Monthly performance reviews ensure sustained compliance and identify opportunities for further optimization.
The Strategic Value of Sustainable Wastewater Management
Water Security as Competitive Advantage
Industries that achieve water recycling rates exceeding 70% position themselves strategically as freshwater scarcity intensifies. Zero liquid discharge facilities command premium market positioning, attracting environmentally conscious customers and investors.
Carbon Credits and Green Financing
Biological treatment systems consume significantly less energy than chemical alternatives, reducing Scope 2 carbon emissions. This qualifies facilities for carbon credit generation under voluntary markets and improves eligibility for green bonds at favorable interest rates.
Workforce and Community Relations
Facilities known for environmental stewardship attract and retain higher-quality talent. Eliminating odors and visible pollution transforms industrial units from neighborhood liabilities to responsible corporate citizens, reducing community opposition to expansion plans.
Future-Proofing Against Regulatory Tightening
CPCB standards will only become more stringent. Systems designed for biological treatment adapt easily to tighter limits through population optimization, while chemical systems require expensive infrastructure additions.
Common Implementation Challenges and Solutions
Challenge: Fluctuating Influent Characteristics
Reality: Industrial production varies seasonally or with order cycles, creating wastewater quality fluctuations that stress biological systems.
Solution: Equalization tanks buffer flow variations, while robust microbial consortiums tolerate wider parameter ranges than conventional activated sludge systems. Strategic bacterial seeding during production ramp-ups maintains population adequacy.
Challenge: Temperature Extremes
Reality: Indian climates range from 5°C winters in North India to 45°C summers in Central regions, affecting bacterial metabolism.
Solution: Team One Biotech’s formulations include psychrotolerant strains active at low temperatures and thermotolerant strains for heat resistance, ensuring year-round performance.
Challenge: Toxic Shock Loads
Reality: Accidental discharges of concentrated chemicals or biocides can devastate biological populations.
Solution: Real-time monitoring systems provide early warning, while emergency reseeding protocols restore functionality within 48-72 hours. Proper segregation of toxic waste streams prevents most shock events.
The Team One Biotech Difference: Science Meets Service
Proprietary Microbial Formulations
Two decades of research into Indian industrial effluents have produced consortiums specifically adapted to textile dyes, pharmaceutical residues, food processing organics, and heavy industrial compounds. These aren’t generic bacterial products but precision-engineered solutions.
Technical Support Infrastructure
Every Team One Biotech client receives:
Dedicated environmental engineer for system optimization
24/7 helpline for operational emergencies
Quarterly performance audits with detailed reporting
Ongoing training for plant operators on biological system management
Proven Track Record
With over 300 installations across India’s industrial heartland, from Surat’s textile clusters to Hyderabad’s pharma corridor, Team One Biotech has demonstrated consistent results in the most challenging conditions.
Your Path Forward: Three Steps to Transformation
Step One: Knowledge
You’ve taken this step by reading this comprehensive guide. You now understand the regulatory landscape, the science of biological treatment, and the financial case for change.
Step Two: Assessment
Engage Team One Biotech’s technical team for a no-obligation facility assessment. Understand your specific challenges, opportunities, and the customized solution pathway.
Step Three: Implementation
Begin the transformation from chemical dependency to biological excellence. Join the growing community of Indian industries proving that profitability and environmental responsibility are not competing goals but complementary strategies.
The Moral Imperative: Water for the Next Generation
Every liter of wastewater your facility treats properly is a liter available for agriculture, for drinking water, for life itself. India’s water crisis is not an abstract environmental concern, it is the defining challenge of our industrial generation.
The Noyyal River can flow again. The communities downstream from your facility can thrive. Your plant can operate profitably while contributing to planetary healing rather than degradation.
Partner with Team One Biotech for a Sustainable Future
The choice is clear: continue down the path of chemical dependency, rising costs, and regulatory uncertainty, or embrace the biological revolution transforming Indian industrial wastewater treatment.
Team One Biotech stands ready to guide your transformation. Our expertise, proven formulations, and unwavering commitment to your success make us the partner you need for this critical journey.
Looking to improve your ETP/STP efficiency with the right bioculture? Talk to our experts at Team One Biotech for customised microbial solutions.