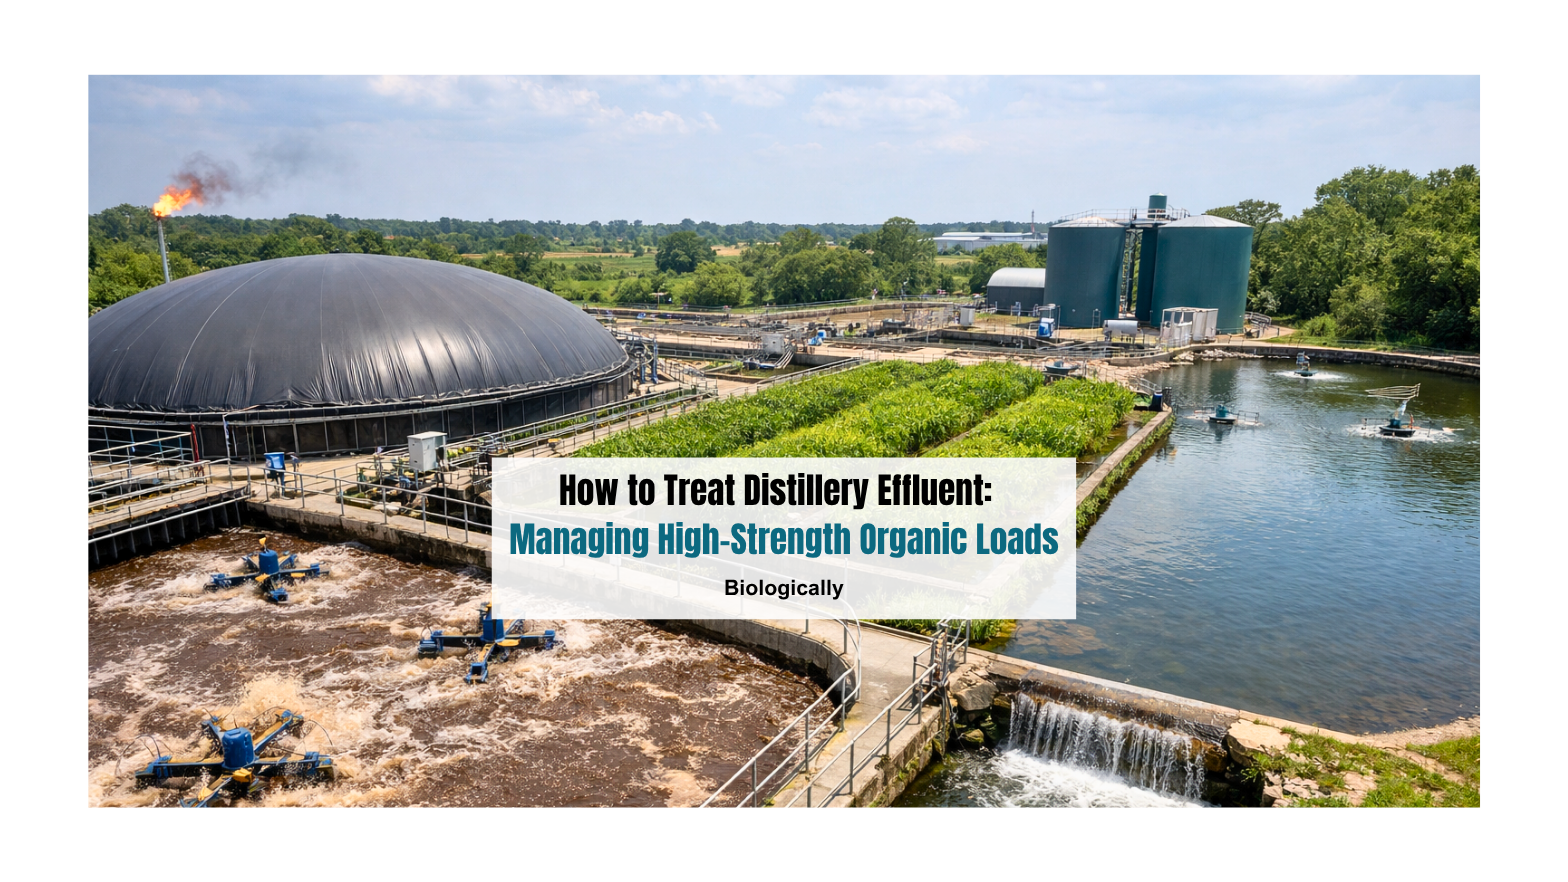
How to Set Up a Biogas Plant from Industrial Effluent: A Step-by-Step Guide
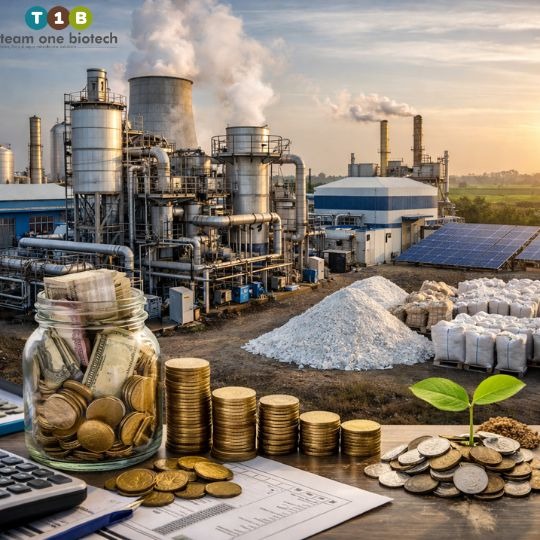
From Liability to Asset: The Waste-to-Wealth Shift Indian Industry Cannot Ignore
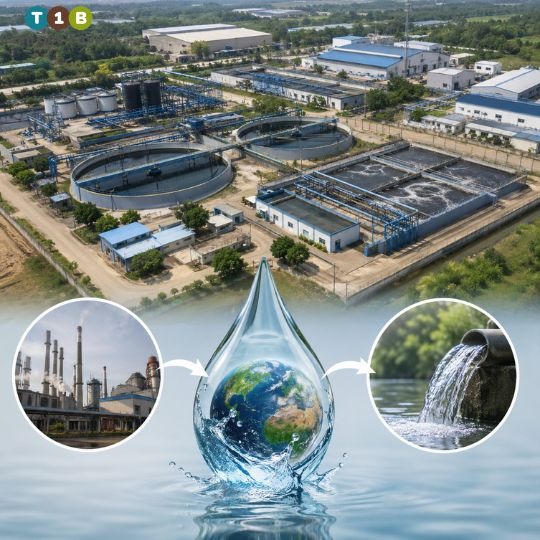
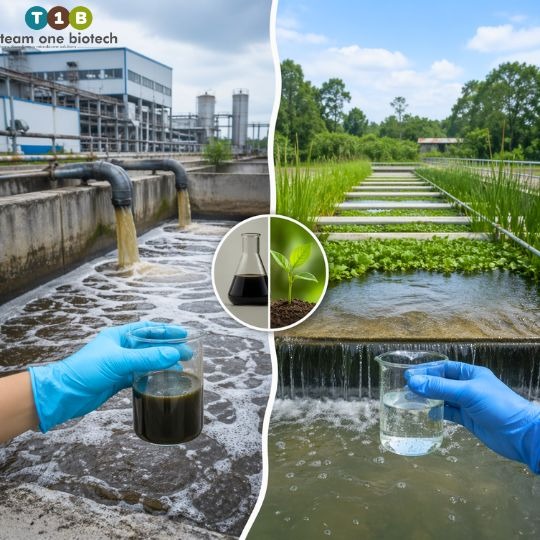
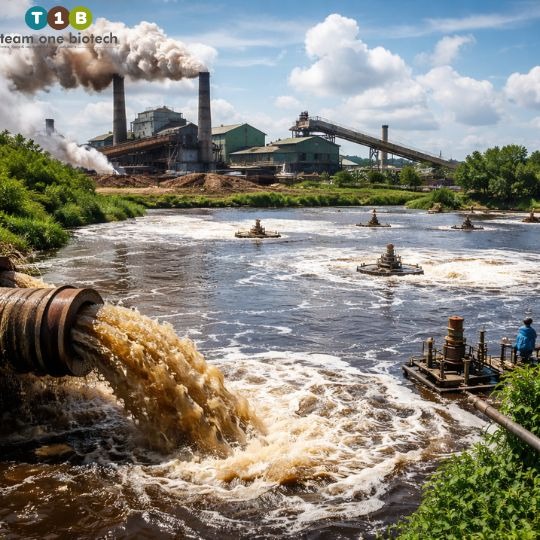
Every day, thousands of industrial units across India pump millions of litres of effluent through their ETPs, spending heavily on energy, chemicals, and compliance documentation, only to watch that treated water drain away as a cost center. Meanwhile, energy bills climb. CPCB norms grow stricter. And the pressure on sustainability managers to demonstrate a credible green strategy intensifies with every quarterly audit.
Here is the reality that most plant operators have not yet fully internalized: that effluent is not just waste. It is a fuel reservoir waiting to be unlocked.
Biogas plant setup from industrial effluent is not a futuristic concept. Across food processing corridors in Punjab, distilleries in Uttar Pradesh, pharmaceutical clusters in Gujarat, and textile hubs in Tamil Nadu, forward-thinking industries are already converting their high-COD wastewater into biomethane, slashing fuel costs, achieving regulatory compliance, and generating carbon credits in the process. The technology exists. The policy framework under India’s National Biogas and Manure Management Programme supports it. What most operators lack is a clear, technically grounded roadmap.
This guide provides exactly that.
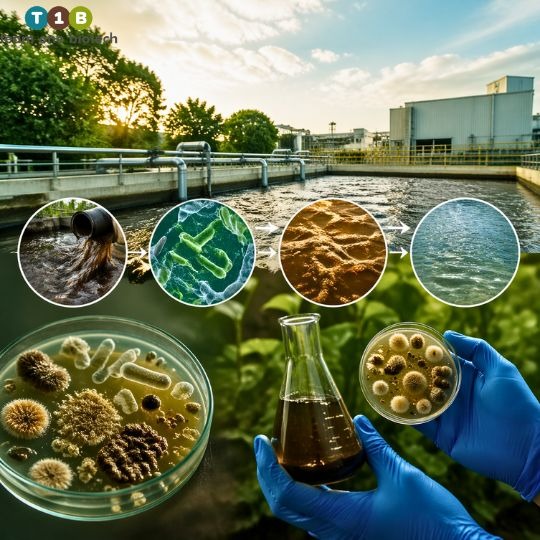
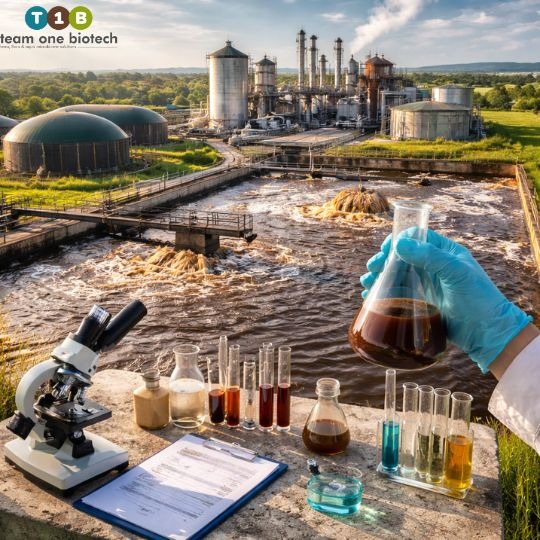
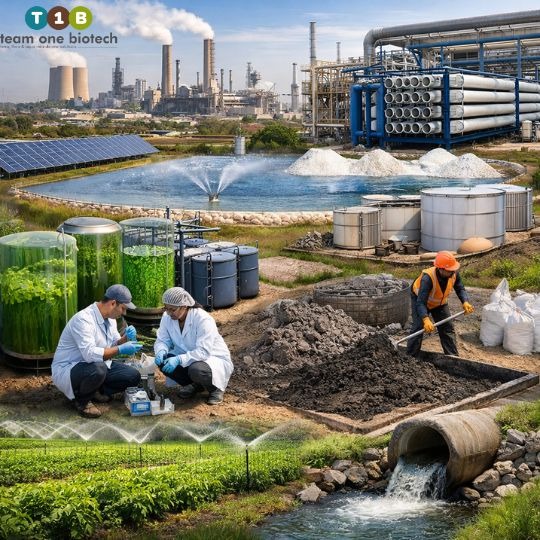
Phase 1: Pre-Feasibility and Effluent Analysis

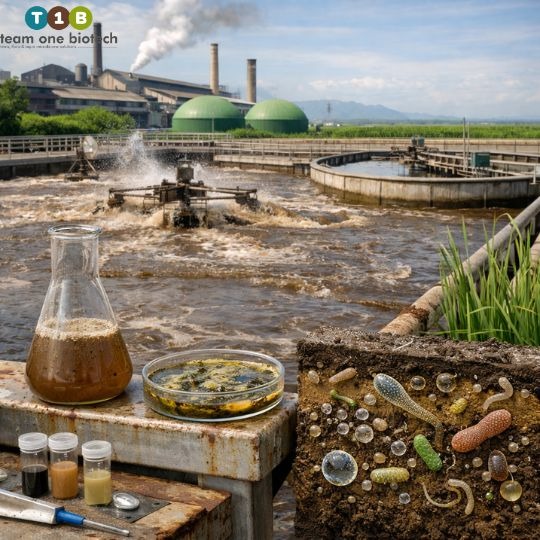
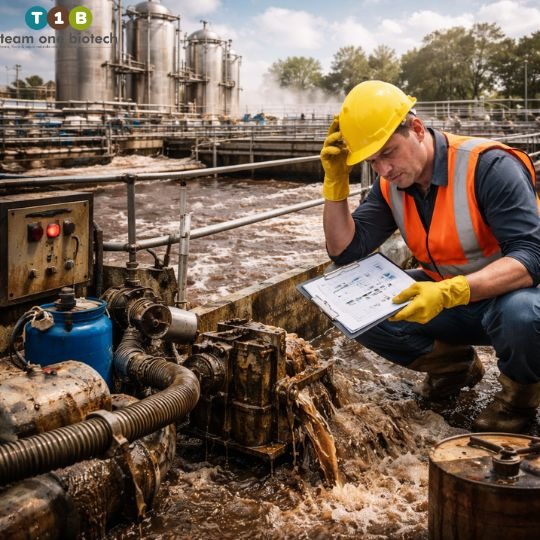
Before a single civil structure goes up or a digester is ordered, the foundation of any successful biogas plant setup lies in rigorous effluent characterization. Skipping this phase is the single most common reason biogas projects underperform or fail entirely.
What to analyze and why it matters:
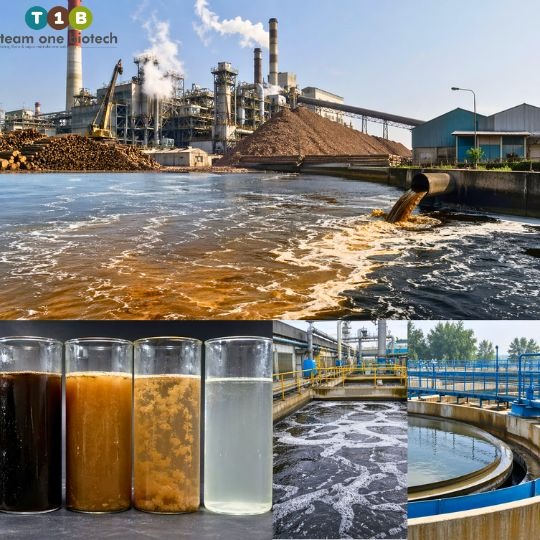
- COD/BOD Ratio: This ratio is your primary indicator of biodegradability. Effluents with a COD/BOD ratio falling in the range of roughly 1.5 to 2.5 are generally considered highly amenable to anaerobic digestion. A ratio significantly above this threshold often indicates the presence of recalcitrant compounds, synthetic dyes, heavy metals, persistent organics, that inhibit methanogenic activity.
- pH Range: Methanogens, the archaea responsible for methane production, operate optimally within a narrow pH window of approximately 6.8 to 7.4. Industrial effluents, particularly from chemical, pharmaceutical, and electroplating industries, frequently arrive outside this range and require pH correction systems upstream of the digester.
- Temperature: This is where Indian climatic conditions play a significant role. Mesophilic digestion, the most common operational mode, functions best between 32 and 42 degrees Celsius. In northern Indian winters, ambient temperatures can suppress bacterial activity considerably, making insulation and pre-heating provisions non-negotiable for year-round performance.
- Nutrient Balance (C:N:P Ratio): A target ratio of approximately 100:5:1 (carbon to nitrogen to phosphorus) supports healthy microbial communities. Effluents from certain agro-industrial sources may be nitrogen-deficient or phosphorus-limited and require nutrient dosing.
- Inhibitory Compounds: Ammonia nitrogen, sulfates (which generate toxic hydrogen sulfide), heavy metals, and certain antibiotics present in pharmaceutical effluents can severely inhibit or destroy the anaerobic consortium. Their concentrations must be assessed before technology selection.
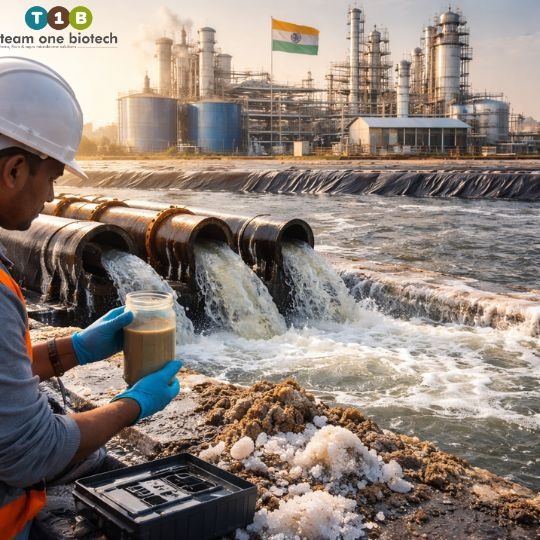
The output of this phase should include: a detailed effluent characterization report, a preliminary biogas yield estimate (typically expressed in cubic meters of biogas per kilogram of COD removed), and a conceptual mass-and-energy balance.
If your ETP is already operational and you want to evaluate its biogas potential, reach out to Team One Biotech for a no-obligation effluent assessment.
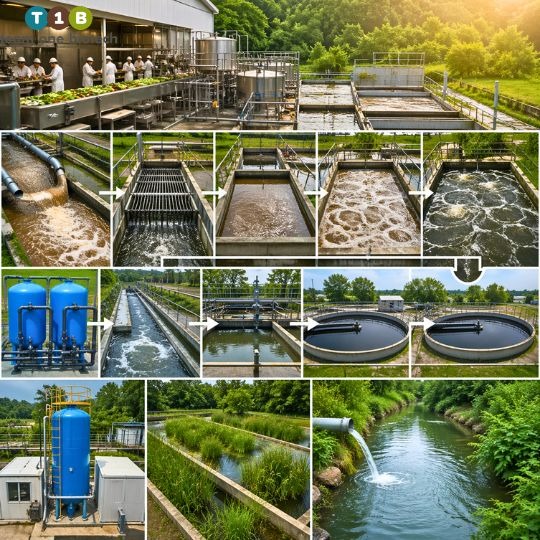
Phase 2: Choosing the Right Digester Technology
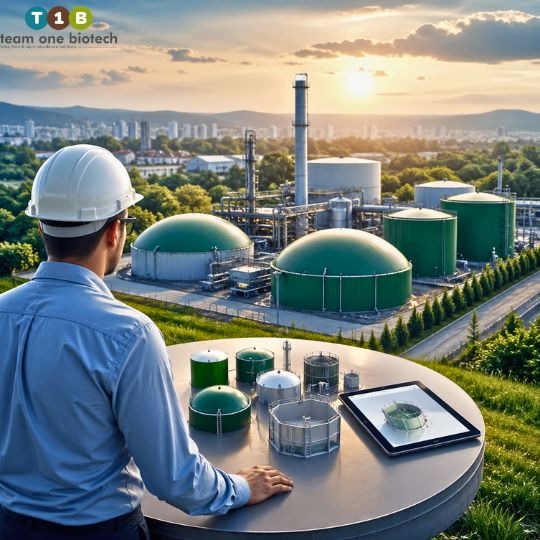
Not all digesters are created equal. The appropriate technology for a pharmaceutical effluent in Hyderabad may be entirely unsuitable for a sugarcane distillery in Maharashtra. Understanding your options is critical.
UASB (Upflow Anaerobic Sludge Blanket) Reactors
UASB technology is among the most widely deployed anaerobic digestion systems in India, and for good reason. It handles high-flow, moderate-to-high COD effluents efficiently, with Hydraulic Retention Times (HRT) typically spanning 4 to 12 hours for suitable feedstocks. It is compact, relatively low-cost to construct, and has a strong track record in sugar, distillery, and food processing sectors. However, it requires stable, granular sludge formation, a process that demands patience during commissioning and the right microbial inoculum.
CSTR (Continuously Stirred Tank Reactor)
The CSTR is better suited for high-solids or viscous effluents that would clog a UASB. Slaughterhouse waste, poultry processing effluent, and certain paper mill streams fall into this category. HRT in a CSTR typically ranges from 15 to 30 days. Mechanical mixing ensures uniform contact between substrate and microorganisms, but energy consumption for mixing is a trade-off to factor into your lifecycle cost analysis.
ABR (Anaerobic Baffled Reactor) and EGSB (Expanded Granular Sludge Bed)
For effluents with fluctuating organic loads, a common challenge in batch-process industries, the ABR offers superior stability. The EGSB, an advanced variant of the UASB with higher upflow velocities, is suited for dilute, low-temperature effluents where UASB performance may be marginal.
Key selection factors include: effluent flow rate, COD concentration and variability, solids content, available land footprint, capital budget, and operational complexity tolerance.
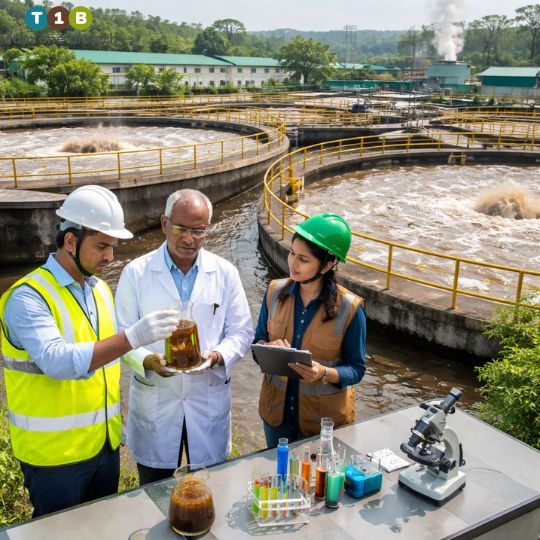
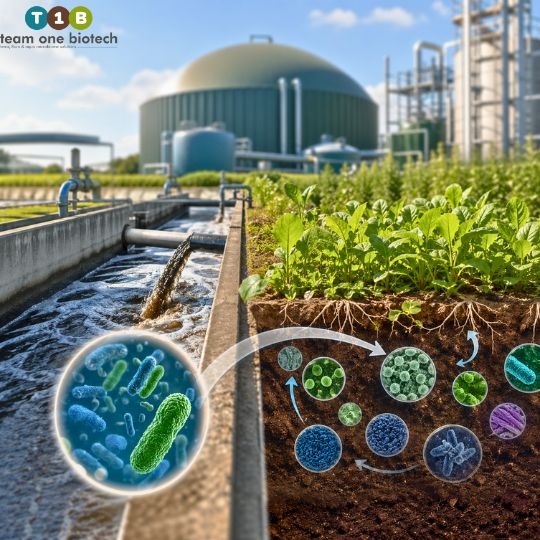
Phase 3: The Role of Specialized Microbes and Bioremediation Integration
This is where the science becomes genuinely fascinating, and where Team One Biotech’s core expertise delivers measurable results.
Anaerobic digestion is not a single biochemical reaction. It is a cascade of four interdependent microbial processes: hydrolysis, acidogenesis, acetogenesis, and methanogenesis. Each stage is governed by distinct microbial communities. When these communities are out of balance, biogas yields drop, VFA (Volatile Fatty Acids) accumulate, pH crashes, and the system can fail dramatically.
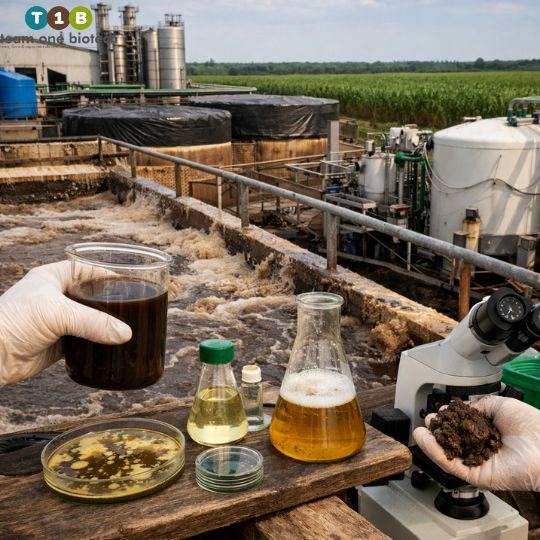
Why indigenous microbial cultures matter in India:
Industrial effluent microbiomes in Indian conditions are shaped by local climate, feedstock composition, and the specific organic chemistry of regional industries. A microbial consortium developed and adapted to, say, coastal humidity and high-sulfate seafood processing effluent will outperform a generically sourced inoculum in that environment. This is not theoretical, field data from bioremediation projects consistently shows that site-specific or regionally adapted cultures can improve methane yields by a significant margin compared to generic inocula.
Bioremediation integration adds a dual benefit. Specialized consortia that include sulfate-reducing bacteria competitors, hydrogenotrophic methanogens, and syntrophic acetogenic bacteria can simultaneously degrade inhibitory compounds, reducing effluent toxicity while enhancing gas production. For industries dealing with complex organic matrices (pharmaceutical, specialty chemical, textile), this integration is not optional; it is the difference between a plant that works and one that does not.
Practical steps in microbial management:
- Source inoculum from well-performing anaerobic digesters treating similar feedstock wherever possible
- Conduct bench-scale or pilot-scale trials before full commissioning to verify community stability
- Monitor key biological indicators including VFA concentrations, alkalinity ratios, and biogas composition during the start-up period, which may span 6 to 16 weeks depending on system size and complexity
- Avoid sudden shock loads that destabilize the methanogenic community, feed rate increases should be gradual and staged
Team One Biotech specializes in developing and supplying application-specific microbial consortia for industrial biogas systems. Connect with our biotechnology team to discuss your specific effluent challenge.
Phase 4: Gas Scrubbing and Energy Conversion

Raw biogas from industrial effluent digesters is not immediately ready for use in a generator or boiler. It is a mixture, typically comprising methane (roughly 55 to 70 percent by volume), carbon dioxide (28 to 43 percent), water vapor, and trace quantities of hydrogen sulfide and siloxanes. Each contaminant must be addressed before energy conversion.
The gas treatment train:
- H2S Removal: Hydrogen sulfide is corrosive to engines and toxic in confined spaces. Iron-based scrubbers, biological desulfurization units, or impregnated activated carbon filters bring H2S concentrations down to acceptable levels for engine operation, generally below 200 parts per million, though equipment specifications vary.
- Moisture Removal: A water trap or condensate removal system prevents moisture from damaging compression equipment and engines. This step is simple but frequently neglected in poorly designed systems.
- CO2 Removal (Biomethane Upgrading): If the target is biomethane for pipeline injection or CNG vehicle use, a pressure swing adsorption (PSA) or membrane separation unit is required to bring methane purity to 95 percent or above. For captive power generation within the plant, this step can often be bypassed.
Energy conversion options:
- Gas Generator Sets (Gensets): The most common route for Indian industrial applications. Biogas-fueled gensets typically have electrical efficiencies in the range of 30 to 38 percent. Waste heat from the engine jacket can be recovered for process heating, pushing overall system efficiency considerably higher.
- Direct Boiler Combustion: A simpler, lower-capex option for industries that need primarily thermal energy. Biogas replaces furnace oil or LPG, with direct cost savings from day one.
- Grid Export: Under applicable MNRE and SERC regulations, surplus power can be exported to the grid. The commercial viability depends on state-specific tariff orders and open access regulations.
Phase 5: Operational Monitoring and Maintenance
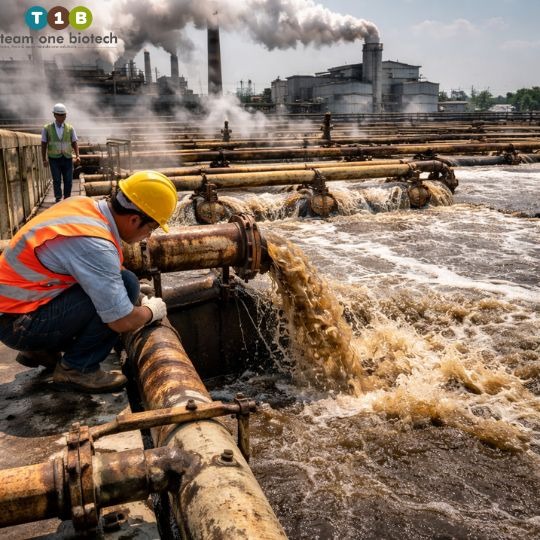
A biogas plant is not a set-and-forget installation. Sustained performance requires structured monitoring protocols and a maintenance culture that understands anaerobic biology, not just mechanical engineering.
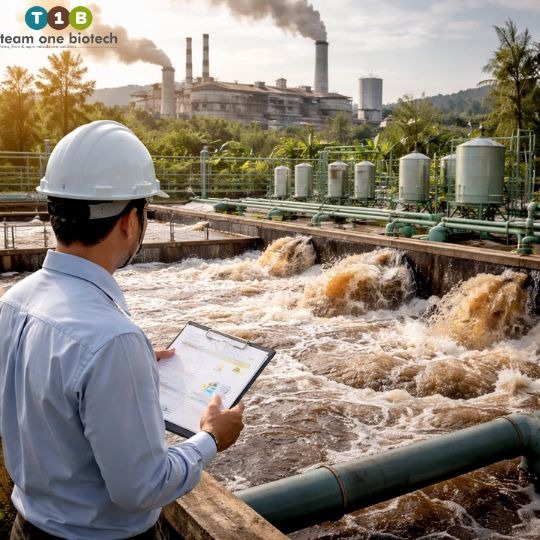
Daily monitoring parameters should include:
- Influent flow rate and COD loading
- Digester temperature and pH (in-line sensors are strongly recommended)
- Biogas production volume and composition (methane percentage, H2S level)
- Effluent quality at digester outlet (COD, TSS)
Weekly and monthly activities:
- VFA and alkalinity analysis to assess system stability
- Sludge inventory management, excess sludge withdrawal and dewatering
- Gas line and pressure relief valve inspection
- Agitator and pump maintenance checks
Seasonal considerations for Indian operations: Summer months in arid zones may require digester cooling provisions, while winter in northern states demands heating. Monsoon season can dilute influent significantly in open-process industries, reducing organic loading and biogas yields, a factor that should be built into annual energy projections from the outset.
Disclaimer: The technical values and ranges provided throughout this article are general benchmarks for informational purposes only. Actual requirements differ significantly in every plant, All figures should be validated through site-specific feasibility studies and professional engineering assessment before project implementation.
Consult the Experts: Your Biogas Journey Starts Here
Setting up a biogas plant from industrial effluent is one of the most strategically sound investments an Indian manufacturing unit can make today. It addresses regulatory compliance, reduces energy costs, generates carbon offsets, and signals genuine environmental leadership to investors and customers alike.
But the difference between a plant that delivers on its promise and one that becomes an expensive underperformer lies in the details, effluent characterization, microbial selection, technology matching, and operational discipline.
Team One Biotech brings together industrial biotechnology, bioremediation science, and real-world ETP expertise to design biogas systems that actually perform. Whether you are at the pre-feasibility stage, troubleshooting an underperforming digester, or evaluating a scale-up, our team provides the scientific rigor and ground-level operational knowledge that generic engineering consultants cannot.
Contact Team One Biotech today. Turn your effluent liability into your most valuable energy asset.
Looking to improve your ETP/STP efficiency with the right bioculture?
Talk to our experts at Team One Biotech for customised microbial solutions.
Contact: +91 8855050575
Email: sales@teamonebiotech.com
Visit: www.teamonebiotech.com
Discover More on YouTube – Watch our latest insights & innovations!-
Connect with Us on LinkedIn – Stay updated with expert content & trends!