Across sectors like textile, pharmaceutical, food & beverage, chemicals, and municipal wastewater, one thing is becoming clear: traditional treatment methods alone can’t keep up with today’s challenges. Rising organic loads, fluctuating influents, sludge handling issues, and strict regulations demand a smarter, more adaptive approach. And that’s exactly where smarter biological solutions- Bioculture for ETP and STP step in.
Whether you manage an industrial ETP or municipal STP, our specialists can guide you with the right bioculture program—simply visit our Contact Us page.
From Understanding Bioculture to Applying It in ETP & STP Operations
Microbial bio cultures aren’t simply “add-ons” to your treatment process—they’re the foundation of a stable, efficient, cost-saving plant. In our earlier article, we explained how bioculture for sewage treatment break down pollutants, enhance system stability, and reduce dependency on chemicals.
Now, let’s take the conversation forward.
How Bioculture for ETP and STP Transform Real-World Treatment Challenges
Here’s how industries can turn microbial theory into practical, measurable results:
Targeting the Right Problems First
Every ETP and STP has a unique challenge.
It could be:
High COD/BOD
Excess foam
Sludge bulking
Poor anaerobic digestion
Unstable aeration tank
Frequent compliance failures
Identifying the root cause helps select the right microbial strains/ bioculture for effluent treatment for a targeted solution—ensuring faster recovery and consistent performance.
2. Choosing the Right Microbial Blend for Your ETP/STP
Different wastewater → different microbial culture for wastewater treatment
For example:
Food processing plants benefit from fast-acting COD reducers
Pharma units require strains resistant to toxicity
Textile plants need microbes that can handle surfactants and dyes
Municipal STPs need stable, long-term biomass builders
This is where choosing the right formulation creates performance you can actually see.
3. Monitoring + Optimization = Long-Term Success
Biology is dynamic. As influent changes, your system needs microbes that adapt. A well-designed bioculture program for ETP and STP ensures:
Consistent effluent quality
Faster recovery after shock loads
Reduction in chemical consumption
Lower sludge handling costs
This is not just microbial activity—it’s operational efficiency.
4.Turning Wastewater Challenges into Sustainability Wins
When microbes do their job right, plants experience:
Lower aeration cost
Better MLSS control
Reduced sludge
Improved process stability
Easier regulatory compliance
These benefits translate directly into long-term sustainability and operational savings.
If this sparked your interest, now is the perfect time to revisit the foundation of all this—the detailed explanation of why bio culture works.
Wastewater treatment is evolving rapidly. Plants that adopt bioculture for ETP and STP today will become the operational leaders of tomorrow. Whether your goal is:
Better compliance
Lower operational costs
Improved sustainability
Enhanced process stability
—microbial solutions are not the future; they are the present.
Modern life depends on thousands of synthetic chemicals — plastics, pesticides, dyes, pharmaceuticals, fuels, and surfactants — that make living convenient but leave behind an uncomfortable legacy: xenobiotic compounds. These are man-made molecules that do not occur naturally and often resist degradation by normal biological pathways. They persist for decades, accumulate in ecosystems, and sometimes transform into even more toxic intermediates.
While conventional chemical and physical treatments can remove or immobilize some pollutants, they are energy-intensive and generate secondary waste. The sustainable alternative comes from nature itself — enzymes, the microscopic catalysts that drive every reaction inside living cells.
What Makes Xenobiotics So Stubborn
Xenobiotic molecules often contain: • Halogenated groups (–Cl, –F, –Br) that make them chemically stable. • Aromatic rings such as benzene that resist oxidation. • Complex branching or polymeric chains that ordinary microbes can’t easily access.
Because of this structural complexity, the natural metabolic machinery of most microbes struggles to recognize these molecules as food. Here’s where specialized microbial enzymes come into play — capable of attacking the unbreakable.
In industrial settings, especially in effluent treatment plants (ETPs), the accumulation of such persistent chemicals creates operational challenges. This is why many industries are now adopting biocultures for ETP systems to introduce pollutant-degrading microbes that can adapt to complex effluent loads.
How Enzymes Break the Unbreakable
Microbial enzymes act as molecular scalpels that cut and modify xenobiotic compounds into less toxic, more biodegradable forms. Key classes include: • Oxygenases and Monooxygenases – Insert oxygen into aromatic rings of hydrocarbons, initiating their breakdown (e.g., Pseudomonas oxygenases degrade benzene and toluene). • Peroxidases – Use hydrogen peroxide to oxidize phenols, dyes, and chlorinated pesticides. • Laccases – Multi-copper oxidases that transform phenolic and non-phenolic xenobiotics using atmospheric oxygen, with no harmful by-products. • Hydrolases and Esterases – Cleave ester and amide bonds in organophosphate pesticides, phthalates, and plastics. • Dehalogenases – Remove halogen atoms, converting recalcitrant chlorinated compounds like PCBs or trichloroethylene into simpler molecules. • Nitroreductases and Dehydrogenases – Detoxify nitroaromatics and explosives such as TNT by reduction and further mineralization.
These enzymatic steps either mineralize the contaminant completely into CO₂ and H₂O or transform it into intermediates that native microbes can assimilate.
When industries use biocultures for ETP, they are essentially introducing microbial communities capable of producing these enzymes naturally inside the aeration tank, equalization tank, or bioreactor. This ensures continuous in-situ enzyme production without requiring costly direct enzyme dosing.
Why Direct Enzyme Application Is Not Recommended
Although enzymes are highly efficient and environmentally friendly catalysts, they should not be administered directly into wastewater systems or soil environments. Free enzymes are unstable in real-world industrial conditions — they degrade quickly, get denatured by temperature, pH, or chemicals in the effluent, and lose activity within hours. They also lack the self-regenerating ability of microbes, meaning continuous dosing becomes impractical and extremely expensive. For sustainable bioremediation, enzymes must be produced in situ by living microbial communities that can multiply, adapt, and secrete fresh enzymes as required.
Why Enzyme-Based Bioremediation Matters
Eco-friendly and specific – Enzymes target particular chemical bonds without producing toxic residues.
Operate under mild conditions – They work at ambient temperature and pH, saving energy.
Applicable to diverse pollutants – From pharmaceuticals and dyes to polyaromatic hydrocarbons and endocrine-disrupting compounds.
Compatible with immobilization and reactors – Laccases, peroxidases, and hydrolases can be immobilized on carriers, enabling continuous treatment of wastewater streams.
Synergy with microbes – Enzyme production in situ through microbial consortia sustains long-term remediation in soils, sediments, and bioreactors.
This is why biocultures for ETP are preferred — because living microbes multiply, adapt to effluent changes, and continuously secrete the required enzymes.
Biocultures for ETP: The Most Effective Way to Deliver Enzymes
In modern effluent treatment plants (ETPs), biocultures — specialized microbial consortia — are the safest and most effective way to introduce enzymes into the system. These microbes naturally produce a broad spectrum of enzymes such as oxygenases, hydrolases, laccases, and dehalogenases based on the pollutants present.
Biocultures:
• Maintain stable microbial populations • Continuously regenerate and secrete fresh enzymes • Break down complex industrial pollutants • Reduce sludge generation • Enhance COD/BOD removal • Improve overall ETP stability and efficiency • Reduce chemical dependency in biological treatment stages
For industries handling pharmaceuticals, chemicals, food processing waste, textiles, and dyes, biocultures for ETP have become an essential part of sustainable operations.
The Bigger Picture
Enzymes remind us that sustainability lies in mimicking nature’s chemistry rather than fighting it. They allow us to convert hazardous xenobiotics into harmless end-products without toxic by-products or energy-intensive treatment steps.
With the rising emphasis on zero-liquid-discharge (ZLD), operational efficiency, and cost control, adopting biocultures for ETP is no longer optional — it is a strategic environmental requirement for industries.
Looking for High-Performance Biocultures for Your ETP?
Team One Biotech provides premium microbial formulations designed for:
COD/BOD reduction
Sludge minimization
Colour & odour removal
Faster biological stabilisation
Enhanced ETP compliance
Our specialized enzyme-rich biocultures for ETP work across industries including pharmaceuticals, chemicals, textiles, food processing, dyes, FMCG, and more.
Industries today are also increasingly adopting biocultures for ETP not only for better pollutant degradation but also for their economic benefits. By improving microbial efficiency, reducing chemical usage, stabilizing biological reactions, and minimizing sludge handling expenses, biocultures significantly reduce overall treatment costs. To understand this in depth, you can explore how biocultures directly contribute to lowering operational and maintenance expenses in industrial wastewater systems here: How Biocultures Save Costs in Industrial Wastewater Treatment.
As one of the leading biotech companies in India and trusted bioremediation companies in India, Team One Biotech continues to deliver solutions that redefine sustainability across wastewater treatment, agriculture, aquaculture, and hygiene management.
Anaerobic systems are one of the most efficient and popular systems in industrial wastewater treatment. Its cost-effective and easy manoeuvring attributes make its presence prominent in Industries such as Distilleries, Ethanol manufacturing, Sugar mills. Breweries and even used in some facultative systems. In the anaerobic systems, Anaerobic granular sludge systems, such as UASB (Upflow Anaerobic Sludge Blanket) and EGSB (Expanded Granular Sludge Bed) reactors, represent one of the most efficient technologies for wastewater treatment.
Here, granules, which are compact, well-structured microbial aggregates, play the most vital part. These granules consist of layered microbial communities, viz., hydrolytic bacteria at the surface, acetogens in the middle, and methanogens at the core. These microbial communities work in synergy to degrade complex organic matter into methane and carbon dioxide.
These microbial communities include anaerobic bacteria, facultative anaerobe groups, and core obligate anaerobes—together forming stable functional granules essential for efficient anaerobic digestion. Understanding how they interact is explained in our EHS-focused guide
However, the anaerobic process is, at the same time, one of the most sensitive processes & its effectiveness lies in maintaining parameters such as pH, flow rate, temperature, and carbon source, which hold a very narrow range. Similarly, one such parameter is the presence of heavy metals, which has grown in industrial and municipal wastewater from plating, mining, tanneries, and electronics industries.
Metals like copper (Cu), nickel (Ni), zinc (Zn), cadmium (Cd), chromium (Cr), and lead (Pb) are frequently labelled “toxic,” but this generalization oversimplifies their nuanced impacts. Beyond simply inhibiting enzymes, these metals disrupt the extracellular polymeric substances (EPS) matrix, destabilise syntrophic microbial interactions, and interfere with sulfide-mediated metal precipitation, ultimately leading to granule disintegration and performance failure.
This blog explores the lesser-explored territory of how heavy metals affect anaerobic granules at a structural and biochemical level and, more importantly, how reactors can recover through biogenic sulfide precipitation, bioaugmentation, and staged feeding strategies.
The need to understand the impact of heavy metals beyond toxicity thresholds that drop methane levels is necessary as this understanding is vital for designing resilient reactors and developing recovery protocols after metal shock loads.
To improve stability under fluctuating industrial loads, many ETP/STP plants now supplement with bioculture for wastewater treatment, which enhances shock resistance, improves organic degradation pathways, and strengthens microbial synergy.
The wastewater treatment systems are usually housed in an anaerobic tank or anaerobic chamber, where microbial structure influences overall anaerobic wastewater treatment outcomes.
This blog explores how heavy metals affect anaerobic granules at a structural and biochemical level and how reactors can recover through biogenic sulfide precipitation, bioaugmentation, and staged feeding strategies.
For operational guidance integrating microbial performance with EHS and compliance: Click here
Structure of Anaerobic Granules
Granules are self-immobilized microbial communities held together by EPS. Their architecture provides:
High biomass retention
Metabolic zoning
Resistance to shock loads
Granule formation is influenced by anaerobic culture methods, where microbial self-aggregation enables long-term anaerobic sludge digestion efficiency.
How Heavy Metals Impact Anaerobic Granules
Disruption of EPS and Structural Stability
The EPS structure consists of negatively charged functional groups (carboxyl, phosphate, hydroxyl) that can bind metal cations, effectively trapping them. Initially, this adsorption reduces metal toxicity, but with time, it has the following effects:
Loosening of granule cohesion: When the balance of tightly and loosely bound EPS changes, granules become porous and fragile.
Cross-linking: Metal ions bridge EPS polymers, changing their viscosity and reducing flexibility.
Oxidative stress: Metal exposure triggers free-radical formation, degrading EPS polymers.
Altered secretion: Metal stress may either stimulate overproduction of EPS (as a defense) or suppress secretion if energy is diverted for stress responses.
Inhibition of Syntropic Pathways
Anaerobic digestion depends on a very vulnerable relationship between methanogenic archaea and syntrophic bacteria. As methanogens are more metal-sensitive than acidogens, the balance tilts — acids accumulate, pH drops, and VFAs such as propionate and butyrate build up, further destabilizing granules. Once the methanogenic core is impaired, granule disintegration accelerates.
Metals like Cu2+ Ni²⁺, and Zn²⁺ interfere with these relationships by:
Inhibiting hydrogenases and formate dehydrogenases, essential for interspecies hydrogen/formate transfer.
Reducing the rate of interspecies electron transfer (IET) and direct interspecies electron transfer (DIET),
Blocking methyl-coenzyme M reductase, the key enzyme for methane formation.
This sensitivity also explains key differences in aerobic vs anaerobic bacteria, where oxygen tolerance and metabolic energy yield differ significantly.
During recovery, following standard anaerobic digestion steps helps prevent acidification and supports gradual metabolic restoration.
Bioaugmentation and Seeding
Introduction of bioculture that consists of EPS-producing bacteria and metal-resistant methanogens helps re-establish microbial networks and regain granule strength.
To buy High-performance microbial strains for industrial ETP/STP: Click here.
Granule Seeding
Seeding stable granules accelerates recovery.
Circulating mature anaerobic sludge from a healthy system supports faster granule restructuring.
Heavy metals do more than inhibit digestion — they structurally dismantle anaerobic granules.
Across industries, maintaining strong microbial granules ensures efficient anaerobic treatment, reduced sludge handling, stable biogas production, and long-term regulatory compliance.
For consultation or plant-level support: Contact Us
Explore More Solutions by Team One Biotech
As one of the leading biotech companies in India and trusted bioremediation companies in India, Team One Biotech continues to deliver solutions that redefine sustainability across wastewater treatment, agriculture, aquaculture, and hygiene management. Contact us here for free consultation.
Bioremediation has long relied on naturally occurring or selectively cultured microorganisms to break down pollutants in soil, water, and effluents. However, today’s contamination challenges are more complex — industries discharge multi-component effluents containing dyes, hydrocarbons, solvents, surfactants, microplastics and emerging contaminants like PFAS and pharmaceuticals. Traditional biological treatments and single-strain microbial approaches often struggle to deliver consistent, predictable and fast remediation under these conditions.
To overcome these limitations, modern environmental biotechnology is undergoing a transformation. The integration of Artificial Intelligence (AI), Genomics, and Nanotechnology is enabling “Smart Bioremediation” — a data-driven and precision-engineered approach that enhances the performance of biocultures, engineered microbial consortia, and wastewater treatment systems.
These three technologies — AI, Genomics, and Nano — are not separate silos. Together, they create a powerful synergy:
Technology
Primary Advantage in Bioremediation
AI / ML / IoT
Predict, monitor, optimize and automate remediation
Genomics / Metagenomics
Identify, engineer and enhance biodegradation pathways
Nanotechnology
Increase bioavailability, speed up catalysis, and support microbial action
With research from 2023–2025 accelerating in all three domains, industries now have tools to achieve faster pollutant breakdown, higher COD/BOD removal, lower toxicity, and stronger microbial resilience, even in harsh Indian effluents. [1] [2]
The Need for Advanced Bioremediation
Industrial ETPs and STPs face challenges such as:
Fluctuating influent loads and shock conditions
Recalcitrant pollutants resistant to biological degradation
High TDS, temperature, or toxic spikes inhibiting microbe growth
Slow response time and trial–error optimization
Dependence on chemicals, high sludge generation, and high OPEX
Modern pollution needs modern biotechnology, not just microbes in isolation. This is where AI/Genomics/Nano-enabled biocultures offer a game-changing advantage.
Role of AI in Smart Bioremediation
AI makes biological treatment predictable and controllable through:
IoT sensors feed live data (DO, TSS, COD estimates), allowing adaptive microbial dosing and early detection of toxic shocks.
c) AI + Engineered Consortia
AI models can also map syntrophic relationships between microbes — improving the design of Engineered Microbial Consortia, which Team One Biotech deploys for textile, refinery, and municipal treatment.
Genomics: Designing Better Biocultures
Genomics and metagenomics enable scientists to:
Identify pollutant-degrading genes and enzymes
Discover native microbial species at contaminated sites
Engineer or enrich strains for specific pollutants
Enhance biosurfactant, biofilm, and enzyme production capacity
Techniques such as CRISPR, pathway engineering and whole-genome sequencing have accelerated discovery of microbes that can break dyes, hydrocarbons, pesticides, and pharma residues. [4]
This enables:
Genomics Capability
Result in Field
Pathway engineering
Faster mineralization, fewer toxic intermediates
Metagenome-driven consortia
Superior stability and shock resistance
Indigenous strain discovery
High performance in Indian environmental conditions
Nanotechnology for Faster Bioremediation
Nanotechnology boosts bioremediation by increasing pollutant accessibility and catalytic speed through:
Nano Tool
Function
Nano-sorbents (iron, carbon, clay nano)
Adsorb dyes, metals, PFAS precursors
Nanozymes
Mimic enzymes, accelerating breakdown
Nano-carriers
Deliver microbes/enzymes more effectively
Conductive nanoparticles
Support DIET and biofilm electron transfer
Studies from 2024–2025 show that nano-assisted systems can cut remediation time by 25–60% depending on pollutant type. [5]
The Tri-Tech Synergy: AI + Genomics + Nano
When combined, these three technologies deliver:
Predictive system + engineered microbe + accelerated breakdown
Repeatable, scalable outcomes
Faster commissioning of ETP/STP bioculture programs
Lower chemical consumption, sludge volume, and OPEX
This is the direction Team One Biotech is building toward, starting with engineered microbial consortia and expanding into data-supported and hybrid nanobioremediation models.
Team One Biotech Approach
Team One Biotech integrates these advancements with its core strengths:
For treatment or project inquiries:
👉 https://www.teamonebiotech.com/contact-us/
Applications for Indian Industry
Textile & dyes (azo, reactive dyes)
Refineries & petrochemical wastewater
Landfill leachate & municipal drains
Metals + organics (electroplating, tannery)
Pharma & emerging contaminants
Regulatory and Compliance Fitment
Aligned with:
CPCB guidelines
Environment (Protection) Act
MoEFCC remediation objectives
ESG & sustainability frameworks
KPIs to Measure Smart Bioremediation
COD/BOD reduction curve
Color/ADMI removal
Toxicity reduction
Biofilm stability
Energy savings
Seasonal resilience
AI-based monitoring trend match
FAQs
Q: Is nano-biotech safe?
When used responsibly with approved materials, yes. Regulatory transparency is essential.
Q: Can AI replace engineers?
No — it supports decision-making and optimization.
Q: Can genomics be used in open environments?
Metagenomic insights are field-friendly; genetically engineered organisms require approvals.
Conclusion
Bioremediation is evolving—from microbe-dependent systems to intelligent, engineered, data-driven ecosystems. With AI optimizing conditions, genomics designing stronger biocultures, and nanotechnology accelerating reactions, industries can finally achieve stable, predictable, and sustainable pollutant removal, even for India’s toughest effluents.
Team One Biotech is committed to advancing this frontier with scientific rigor, compliance alignment, and practical field execution.
How Team One Biotech is transforming wastewater, soil, and effluent treatment with next-generation microbial solutions- Engineered Microbial Consortia (EMC)
Industrial wastewater, landfill leachate, petrochemical discharge, and textile dye effluents often contain complex mixtures of pollutants—hydrocarbons, dyes, metals, ammonia, solvents, and toxic organic compounds. These aren’t easily treated by single-strain microbes or traditional ETP/STP methods alone. As environmental compliance becomes stricter and industries move toward sustainable operations,Engineered Microbial Consortia (EMC) have emerged as one of the most effective solutions for fast, stable, and holistic bioremediation.
Engineered microbial consortia are purpose-designed combinations of bacteria and fungi that work cooperatively to degrade, transform, and neutralize multiple pollutants simultaneously. Research between 2023–2025 has consistently shown that multi-microbe systems outperform single strains in degrading recalcitrant pollutants, especially in real-world conditions with fluctuating loads, mixed contaminants, or high TDS environments.[1], [2]
This is where Team One Biotech brings an edge—by designing, optimizing, and deploying customized consortia and ready-to–use biocultures, specifically formulated for Indian effluents, Indian climate, and CPCB-compliant treatment goals.
Why Engineered microbial Consortia Work Better Than Single Microbes
Engineered consortia succeed because they offer:
Advantage
Why It Matters
Division of Labour
Each strain handles different metabolic steps of pollutant breakdown
Functional Redundancy
Ensures stability even under shock loads, pH swings, or temperature changes
Higher Pollutant Range
Hydrocarbons, dyes, metals, nitrates, phenols, surfactants — treated in parallel
Biofilm Strength
Mixed biofilms + DIET (Direct Interspecies Electron Transfer) boost speed[3]
Reduced Toxic Intermediates
One microbe’s by-products become another’s food source
In simpler words — consortia “share the workload,” making remediation faster, deeper, and more resilient, especially in non-sterile real-world ETP/STP and drain environments.
Recent studies (2024–2025) show consortia reduce COD, color, and toxicity 30–70% faster than single microbes in textile and refinery effluents. [4],[5]
Team One Biotech’s 6-Step Engineered Consortia Workflow
Because consortia reduce chemical load, sludge, and toxicity, they support India’s push toward ESG, ZLD, and sustainable remediation.
KPIs We Deliver and Measure
COD/BOD reduction curve
Color/ADMI removal
Oil & grease elimination
Toxicity reduction (bioassay-based)
Shock-load resilience
Seasonal stability
FAQs
Q: Can these microbes survive high TDS/temperature? Yes—consortia provide redundancy and shock resistance superior to single strains.
Q: Can this replace ETPs? No. It enhances and stabilizes ETP/STP performance and lowers OPEX.
Q: Do regulators accept bioremediation? Yes—CPCB already publishes SOPs for microbial drain treatment.
Conclusion
Engineered Microbial Consortia are the next leap in bioremediation—smarter, faster, and more adaptable than conventional biological treatment. For Indian industries facing compliance pressure, variable influent loads, and sustainability goals, Team One Biotech’s engineered consortia and microbial strain program provide a science-backed, field-tested, CPCB-aligned solution.
Call to Action
If you want a pilot, audit, or strain recommendation, connect with our team:
The global water crisis continues to intensify, driven by pollution and scarcity. This issue not only threatens current industries but also poses long-term environmental risks. To address these challenges, modern wastewater treatment innovations have introduced Zero Liquid Discharge (ZLD) — a comprehensive system that enables industries to recover, reuse, and recycle water with minimal environmental impact.Upgrade your wastewater management with Team One Biotech — delivering advanced biological treatment solutions that make sustainability and cost-efficiency work together contact us now.
What is Zero Liquid Discharge (ZLD)?
Zero Liquid Discharge is an effluent treatment process designed to ensure that no wastewater is released into the environment. It enables complete water recovery while isolating solid residues such as sludge and salts for disposal.
Industries such as textiles, power plants, chemicals, and pharmaceuticals frequently deal with high TDS, high COD and BOD, and ammonical nitrogen reduction challenges. In such cases, ZLD in wastewater treatment ensures efficient resource utilization while maintaining environmental compliance. The ultimate goal is zero discharge and maximum water reuse.Wastewater treatment is an essential step toward achieving Zero Liquid Discharge, ensuring that every drop of effluent is treated, recycled, and reused to minimize environmental impact.
Illustration of the process:
The Cost Factor in ZLD Implementation
While Zero Liquid Discharge systems are highly effective, they also involve significant CAPEX and OPEX. Implementation can increase wastewater treatment costs by up to 300% when dependent solely on physical and chemical processes. Incorporating biological or anaerobic treatment stages can substantially reduce these expenses and improve long-term sustainability.
How Does a ZLD System Work?
A standard ZLD process integrates physical, chemical, and biological stages to achieve complete recovery. The primary stages include:
1. Pre-Treatment
This step removes suspended solids, oils, and greases through chemical dosing, pH correction, and equalization. It ensures that the influent entering the next stages is stable and easier to process.
2. Biological Treatment
This involves microbial degradation of organic matter to lower COD and BOD levels. Commonly applied in textile, pharma, and tannery industries, it helps minimize scaling, fouling, and odour issues.
These systems separate clean water from dissolved salts and pollutants. The permeate is reused within the plant, while the reject moves to the evaporation stage for further concentration and recovery.
4. Evaporation (Multi-Effect Evaporator – MEE)
RO rejects are treated in Multi-Effect Evaporators (MEE) or Mechanical Vapour Recompression (MVR) units. These thermal processes recover clean water through vapor condensation while concentrating the remaining brine.
5. Crystallization
The final step converts concentrated brine into solid form for safe disposal or possible recovery, ensuring complete zero liquid discharge.
Challenges in Sustaining ZLD Operations
Despite its benefits, maintaining Zero Liquid Discharge operations is often difficult due to technical and operational constraints.
High Energy Consumption
Evaporators and crystallizers require large amounts of steam or electricity, accounting for 40–60% of total ZLD OPEX. High COD, TDS, and ammonical nitrogen loads further increase energy consumption.
Scaling and Fouling
Inadequate pre-treatment or high phenol content can lead to scaling and fouling in RO membranes. This reduces permeate recovery, increases cleaning frequency, and shortens membrane life.
Frequent Shutdowns
Industries handling variable effluents—such as textile, dye, and pharmaceutical units—face fluctuations in high COD and BOD loads. This can trigger growth of filamentous bacteria, excess sludge formation, and frequent system shutdowns, increasing operational costs.
Bioremediation offers a sustainable solution for optimizing effluent treatment in ZLD systems. By utilizing specialized microbial strains bioculture, it enhances organic degradation, minimizes sludge generation, and stabilizes biological processes.
Key benefits include:
1. COD and BOD Reduction
Microbes effectively degrade organic compounds, reducing COD/BOD by up to 90%. This lowers aeration energy and chemical usage, while preventing membrane fouling.
2. Sludge Reduction
Bioremediation converts organic waste into carbon dioxide and water, resulting in minimal sludge accumulation and preventing MEE tube blockage. This reduces power and maintenance requirements.
3. Reduced Evaporator Load
Improved settling and clear supernatant reduce the volume sent to evaporators, cutting down energy demand and improving overall ZLD efficiency.
4. Enhanced Operational Stability
By controlling filamentous bacteria and supporting anaerobic treatment, bioremediation strengthens system resilience, stabilizing operations during variable or shock loads.
Compliance and Environmental Benefits
Implementing bioremediation aligns with NGT, CPCB, and PCB guidelines for zero discharge systems. It ensures reduced reliance on chemicals, improved odour control, and better compliance with national environmental regulations. The approach contributes to sustainable development goals by promoting biological wastewater treatment over purely mechanical systems.
Conclusion: Achieving Cost-Effective Zero Liquid Discharge
Zero Liquid Discharge remains critical for sustainable industrial wastewater management, but its high operational costs require strategic optimization. Incorporating bioremediation enhances biological pre-treatment, reduces sludge generation, and improves overall efficiency, making ZLD more affordable and environmentally responsible.
When properly managed, pretreated effluent acts like a well-balanced system—easier to process, more energy-efficient, and more reliable. Integrating bioremediation ensures long-term operational stability and significant cost savings for industries implementing ZLD in wastewater treatment.Achieve compliance, efficiency, and sustainability in every drop. Get in touch with Team One Biotech for expert-driven ZLD solutions.
To achieve sustainable Zero Liquid Discharge with reduced operational costs, contact Team One Biotech for tailored biological solutions.
As one of the leading biotech companies in India and trusted bioremediation companies in India, Team One Biotech continues to deliver solutions that redefine sustainability across wastewater treatment, agriculture, aquaculture, and hygiene management.
This is a detailed article on biocultures for wastewater treatment, covering their importance, working mechanism, applications, and industrial benefits. It explains how microbial consortia improve ETP and STP efficiency, enhance biological degradation of pollutants, and ensure compliance with CPCB and NGT wastewater discharge standards. Contact us if you need industry specific consultation on biocultures utility.
Table of Contents
What are Biocultures for Wastewater Treatment?
Why Do We Need Biocultures?
How Do Biocultures Work?
Types of Biocultures and Formulation
How Biocultures Are Manufactured (End-to-End)
Sector-Wise Applications of Biocultures in Wastewater Treatment
Supporting Conditions for Bioculture Effectiveness
Environmental, Safety & Compliance Considerations
FAQs
Conclusion
Introduction
The current growth of India is exponential in each sector, whether it is defence, semiconductors, industries, or exports, among others. But, there is one more thing where India has an exponential graph, which is pollution, and to be specific, water pollution. Untreated Industrial and sewage wastewater is still one of the biggest menaces that the country is facing, and despite a central body such as the NGT and CPCB in function issuing strict compliance, along with practically every industry having a wastewater treatment plant.
Now the question arises if every industry has a facility to treat wastewater or there are existing STPs to treat sewage, and new ones are being built, then why does this menace of water pollution still exist to such a large scale?
Well, the answer is simple. No hardware can work without proper software. Meaning the infrastructure of an ETP/STP is not enough to treat wastewater. As the maximum work of pollution reduction is done by biological treatment, which uses the same mechanism of nature through which a pile of garbage gets degraded automatically, a dead body is reduced to bones within days, how milk gets transformed into hung curd, or how our food gets digested easily. And the warriors of this mechanism are microbes.
Water pollution is one of the most critical environmental challenges faced by industries today. Despite the presence of advanced Effluent Treatment Plants (ETPs) and Sewage Treatment Plants (STPs), untreated effluents still contribute to high BOD, COD, and TDS levels in water bodies. This is where biocultures for wastewater treatment play a pivotal role.
Biocultures—specialized microbial consortia—are introduced into biological treatment systems to accelerate the biodegradation of organic pollutants, improve sludge reduction, and enhance nitrogen and phosphorus removal. From industrial wastewater management to municipal sewage treatment, biocultures ensure faster recovery from toxic shock loads, stabilize the microbial population, and improve compliance with environmental norms in India.
Now these microbes, when used effectively with proper research and execution, can enhance the pollution-degrading capacity of the wastewater treatment plant 3 times.
What are biocultures for Wastewater Treatment?
Biocultures are combinations of microorganisms that play a crucial role in the biological treatment of wastewater. These microbial consortia work to degrade complex pollutants such as hydrocarbons, phenols, fats, oils, and grease (FOG), ensuring COD and BOD reduction. They are widely used in:
Industrial wastewater treatment (pharmaceutical, textile, chemical, refinery, and food industries)
Municipal STPs for sewage management
Anaerobic digestion systems for biogas generation
This article will focus on the core use of biocultures, the science behind it and how prominent it is.
Why do we need Biocultures?
This is one of the most common questions asked. Let’s first understand why we need external microorganisms when we still have a biological system with a biomass in a wastewater treatment plant. The “workforce” of any waste treatment system is its biomass. In a dynamic state of flux, different microorganisms perish while others proliferate and become more prevalent.
Under extreme circumstances, such as toxic shock, some bacterial populations may be reduced or eliminated, resulting in poor effluent quality. Historically, waste treatment strategies have been slow to recover in such scenarios. In the aeration basin of a typical industrial waste treatment plant, one would expect to find a wide range of bacterial species or strains.
This bacterial diversity is essential because different types of bacteria digest different substances more effectively and efficiently. Regrettably, the vast majority of industrial waste treatment systems never achieve long-term stability. The quantity & the quality of entering wastewater normally vary on a weekly or sometimes even daily basis.
These variances might be caused by batch process production, schedules, chemical spills in the manufacturing plant, ineffective plant equipment, ETP design, process management or human errors. The reality is that biological populations in many treatment facilities never reach optimal numbers or a variety of species. Without bioaugmentation/bioremediation, the indigenous population should be made up of a diverse range of species.
Some of these organisms degrade organic substances more efficiently and effectively than others, generating a settleable biomass. Hence such organisms/microbes are selected and combined into a product called as biocultures, which are then added into the biological systems of a wastewater treatment plant.
Biocultures benefits:
Indigenous microbes often fail under extreme conditions (toxic loads, variable pH, high salinity).
Biocultures provide robust microbial strains that stabilize the biomass.
They ensure faster recovery from shock loads, maintain MLSS:MLVSS ratios, and improve settleability of sludge.
They help achieve compliance with PCB, CPCB, and NGT norms for effluent discharge.
How do Biocultures work?
Ideally, the biomass is divided into three populations: Population A (desired indigenous microbes), Population B (other indigenous microbes), and Population C (selected robust microbes). The bioaugmentation/bioremediation program’s purpose is to add bioculture with selected microbial strains to boost Population A’s development, establish the selected robust microbial strains of Population C and reduce Population B. This helps us achieve both the quality and quantity of the bacterial population in a biological system.
Understanding the mechanism of microbes
The microbes remove or degrade organic pollutants through enzymes, following a particular mechanism that is distinct for every kind of pollutant such as :
Carbon removal:
In wastewater, biodegradable organics are mostly in the form of carbon that contribute to COD/BOD, such as sugars, starches, fats/oils/grease, proteins, alcohols, etc.). Heterotrophic bacteria reduce these organics for energy and cell generation. Here, one portion of carbon is transformed into CO2 + H2O and assimilated by the rest into biomass (MLSS/MLVSS).
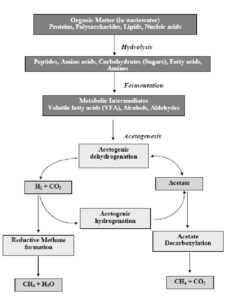
The above flowchart explains the general pathway of carbon removal by microorganisms through both aerobic and anaerobic mechanisms.
Biocultures with a combination of microbes that secrete hydrolytic enzymes, such as lipase, Oxygenases, and dehydrogenases, etc., are used in carbon removal
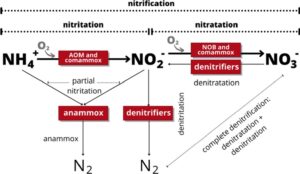
2. Nitrogen Removal: The nitrogen removal pathway consists of two steps:
Nitrification: In this step, ammonia is converted first into nitrite and then into nitrate in the presence of oxygen by nitrifying bacteria.
Denitrification: In this process, the nitrate is converted into nitrogen gas in low quantities or in the absence of oxygen.
The complete process is popularly called the anoxic process. Biocultures with a combination of microbes, such as nitrifying and denitrifying bacteria, are used for nitrogen removal.
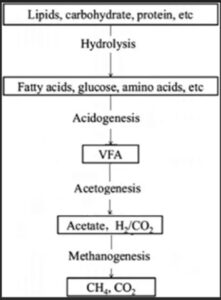
3. Anaerobic Digestion: It is a four-stage biological process.
Hydrolysis: In hydrolysis, specialised microbes release enzymes (lipases, proteases, amylases) that cleave the macromolecules into simpler compounds such as fatty acids, amino acids, and sugars.
Acidogenesis: Acidogenic bacteria convert these compounds into VFA (acids), alcohols, hydrogen, and carbon dioxide
Acetogenesis: The VFAs and alcohols are further converted by syntrophic bacteria into acetic acid, H2 and CO
Methanogenesis: Methanogenic archaea consume acetate, hydrogen, and CO₂ to produce methane-rich biogas. This is the energy-harvesting stage, yielding about 55–70% methane in the gas stream, which can be used in boilers, combined heat and power (CHP), or upgraded to biomethane.
4. Phosphorus removal:
Phosphate Removal Cycle:
Anaerobic zone: In the lack of oxygen, PAOs take up VFA (acetate/Propionate) for energy.
Aerobic Zone: these PAOs with stored energy then take up PO4-P, and then they are removed by wasting the sludge.
So, in this process, the pollutants are not degraded but absorbed by microbes, which are introduced through biocultures.
These biocultures are directly introduced into the biological tanks where they are either kept in suspended growth or with biofilm carriers or media to enhance surface area for reaction.
Slow start-up; sensitive to solvents/sulfides/salts; temperature dependency; potential odors if upset
Success KPIs
Downstream COD/BOD drop, stable DO, good SVI/settling
NOx removal across anoxic, alkalinity recovery, minimal gas bubbles
Rising biogas (CH₄ %), VFA/alkalinity in control, COD removal ↑, foam/odour under control
Biocultures Manufacturing Process
Being a leading manufacturer of biocultures, we can explain the process as below:
Strain sourcing & Safety: Performance-proven strains are selected on the basis of substrate profile and range, growth rate, pH tolerance, temperature, salinity, and surfactants. Mostly, a master working cell bank under controlled storage is maintained with records.
Bench Characterisation: Typically, benchtop reactors are in-shaken along with mapping growth curves and profiling of enzymes. Parameters or set points, such as temperature, pH, and the DO control band, are also considered, which vary with every strain.
Scale-up (production): The strain is then transferred from bench reactors or flasks to larger volume fermenters, which are already sterilised.
Harvest & stabilisation: Harvest is done by centrifugation or microfiltration, followed by stabilisation depending upon the product’s form:
Powders: carriers such as maltodextrin, mineral clay, zeolite + protectants (trehalose, skim solids) are mixed, followed by dry spraying.
Liquids: buffered media is used.
Encapsulated/blocks: entrap
Where Biocultures are Used: Sector-wise applications
1. Food and Beverage (dairy, breweries, soft drinks, bakeries):
Effluent Profile: readily degradable organic COD in high content in the form of lactose, proteins, sugars and FOG
Major issues: Sudden/burst foaming, morning/evening shock loads, ammonia carryover when nitrification lags.
Bioculture Consortia used: Mostly enzyme-rich aerobic consortia that are rich in hydrolytic enzymes ( amylase, proteases, lipase) are used to accelerate hydrolysis. Nitrifiers are used in case of ammonia.
Microbial Mechanism: Faster conversion of colloids to soluble carbons. Healthy floc formation occurs with robust and stable biomass development.
2. Pulp and Paper:
Effluent Profile: High COD effluent with colour, lignin/cellulose fractions and heavy foaming issues.
Pain Points: Lignin is one of the toughest components to degrade; hence, biodegradability is low. Colour is also a prominent factor that is very hard to reduce.
Bioculture consortia used: Consortia with microbes that secrete enzymes such as Laccases, lignin peroxidases, along with other hydrolytic enzymes are used.
Microbial mechanism: the polymers of lignin are cleaved by enzymes, and co-metabolism degrades colour concentration.
3. Textile & Dye
Effluent Profile: Consists of dyestuff, common surfactants, high temperature, reactive and non-reactive dyes components.
Issues: prominence of refractory colour, which is a visible pollution indicator, along with nitrite spikes. High temperature up to 55°C kills normal native microbes.
Bioculture consortia used: Consortia with microbes that secrete enzymes such as reductases, peroxidases, along with other hydrolytic enzymes are used, which should be thermophilic in nature to enhance stability and performance in high temperatures.
Microbial Mechanism: the thermophilic bacteria that are viable in high-temperature easily degrade dyestuffs and color.
4. Pharmaceuticals & APIs:
Effluent Profile: Consists of inhibitory intermediates, solvents, high ORP swings, high Ammonia, and refractory COD.
Issues: high toxicity, long accumulation, shock loads, ammonia spikes and low settling in clarifiers.
Bioculture consortia used: Biocultures with De-Tox tolerate blend, a few bacillus strains and nitrifiers can be used.
Microbial Mechanism: Biofilm formation, along with EPS binding buffers toxicity, while the bacillus and other strains degrade refractory COD. For Ammoniacal nitrogen nitrifiers in the presence of oxygen, perform the function of nitrification, followed by denitrification by denitrifying strains.
5. Chemical manufacturing (Paints, resins, surfactants):
Issues: high toxicity, shock loads, high TDS, low COD/BOD degrading efficiency.
Bioculture consortia used: Biocultures with De-Tox tolerate blend, a few bacillus strains and nitrifiers can be used.
Microbial Mechanism: Biofilm formation, along with EPS binding buffers toxicity, while the bacillus and other strains degrade refractory COD.
6. Petrochemical/refineries:
Effluent Profile: prominence of alkanes, Aromatics, emulsified oil and specifically PHA
Issues: surfactant interactions, emulsion that passes without degradation, inducing odour, high PHA at outlets affecting efficiency, even loss of sludge blanket in the UASB process and low methanogenesis.
Bioculture consortia used: Biocultures with hydrocarbon-degrading as well as lipase-producing strains, anaerobic strains with similar properties for UASBs.
Microbial Mechanism: The enzymes, such as mono/di oxygenases, crack hydrocarbons, lipases split triglycerides and PHAs. The Anaerobic strains form heavy flocs that can settle at the bottom to strengthen the sludge blanket.
Case Studies:
Pharmaceutical(API) company in Gujrat:
Challenges:
The COD, BOD and Ammoniacal Nitrogen were always high above the discharge limits in spite of having a high amount of MLSS & MLVSS in all their aeration tanks. The EHS department of the industry was under pressure to maintain the parameters as per the PCB norms. Some consultants had also suggested having an MBR after the ASP process, which unfortunately was not providing the desired output.
ETP Flow chart:
Primary- Biological and Tertiary systems, with RO & MEE. The activated sludge process (ASP) has 3 aeration tanks in series and one anoxic tank before the aeration tanks.
Flow:
200 m3/day
Inlet COD:
14,000 to 17,000 ppm
Inlet Ammoniacal Nitrogen:
280 to 320 ppm
COD outlet after biological treatment:
9000 to 12000 ppm
Ammoniacal Nitrogen after biological treatment
220 to 270 ppm
Bioculture Selection and Dosing
A blend of microbial strains that were capable of degrading recalcitrant compounds, aromatics, phenols and long-chain carbons was created and incorporated into bioculture, which was dosed in the aeration tanks for 8 weeks.
Results:
Results and discussions:
91 % reduction in COD and 75% reduction in TAN levels after 60 days and today the COD is in the range of 500 to 450 ppm in their biological outlet.
EBPR-Phosphate removal:
A prominent chemical manufacturing unit situated in MP near Ratlam wanted to treat an effluent stream with a high phosphate content of up to 1500-2000 ppm. They wanted to use their old ETP, revive it, commission it, and make it efficient for phosphate treatment.
1st Phase: Scrutiny
OLD ETP details:
The ETP had primary treatment, biological treatment (Anaerobic), and then a tertiary treatment.
Flow (current)
350 KLD
Type of process
UASB
No. of UASBR
1
Capacity of biological tank
950 KL
Parameters of the stream with Phosphate:
Parameters
Avg. Inlet parameters(PPM)
COD
4300
Phosphate Content
1500-1800
TDS
3000
2nd Phase: The Blueprint
After scrutiny, it was concluded to transform the old ETP apparatus into an EBPR unit, i.e., Enhanced Biological Phosphorus removal unit, which involves the introduction of PAOs (polyphosphate-accumulating bacteria) into the biological system along with physico-chemical treatment in primary and tertiary systems, respectively, of the old ETP.
ETP process optimisation:
An efficient EBPR unit requires anaerobic as well as aerobic systems, as in anaerobic, the RbCODs get transferred into VFAs, which are then absorbed by PAOs for efficient phosphate uptake, which is dispersed during the anaerobic process. The PAOs then absorb the phosphate rapidly in the aerobic system. Hence, biomass with phosphate-absorbed PAOs is allowed to settle in the clarifier, and then WAS is removed.
In this scenario, the ETP had a UASB system, but no Aeration system, hence:
We utilised a spare tank of capacity 300 KL located next to USABR, and transformed it into an aeration tank by installing diffusers.
After our recommendation, the industry installed a 50 KL FRP clarifier after the sedimentation system.
Hence, the old ETP now had a facultative EBPR system.
3rd Phase: Technology and Execution
Selecting biocultures:
For UASB:
The perfect solution for an Anaerobic system consists of robust bacteria that can efficiently work in anaerobic conditions, leveraging efficiency in terms of:
COD reduction
Biomass Generation
Methane Generation
F/M ratio optimization
Here, since the goal was phosphate reduction, we amalgamated PAOs as well, which made the product extremely effective to be used in the developed EBPR system.
For Aerobic Tank:
Highly robust and selective strains of bacteria, which, when combined with PAOs.
Results:
After 60 days of implementation:
Parameters
Primary Outlet
UASB Outlet
Clarifier Outlet
COD
3900
1900
800
Phosphate
1300-1500
850-900
180
COD Reduction
10 %
~ 55 %
82 %
Phosphate reduction %
8-10%
~ 65 %
~85-90%
Supporting Conditions for Biocultures in Wastewater Treatment:
Essential Parameters to be maintained:
DO: 1.5 to 3 is essential in an aerobic process to produce the best results from biocultures for wastewater treatment.
pH: Neutral pH is recommended, but the range between 6.5 and 8 is preferable.
Temperature: The ideal range for optimum performance should be 20-35 °C, but some thermophilic strains can thrive up to 55 °C
ORP: For anaerobic, it should be between -100 and -300 mV.
Yes, they can reduce the sludge meaningfully; however, HRT, SRT and wasting are important factors to be tracked as well.
5.Do I need to stop chemicals when using biocultures?
Chemicals for primary treatment, especially for pH control and coagulation-flocculation, are necessary; however, effective biocultures can reduce their quantity to some extent.
6.Can I use them in grease traps/septic at small facilities?
Yes, biocultures with FOG-degrading strains can be used.
7.Any red flags when buying biocultures?
A vendor/manufacturer giving fake guarantees without studying and analysing the problem of your wastewater treatment plant.
Conclusion:
Nature’s best healing mechanism, i.e microbes, is simple yet extremely effective, especially for wastewater treatment. They are very tiny in size but mighty in effect, and when the right combination of such microbes is created, 60% of wastewater treatment problems are solved. Biocultures for wastewater treatment are proven and effective technologies that have been with us forever, but we have realised their potential in the wastewater sector very late, and it is still misunderstood and unexplored.
As one of the leading biotech companies in India and trusted bioremediation companies in India, Team One Biotech continues to deliver solutions that redefine sustainability across wastewater treatment, agriculture, aquaculture, and hygiene management. Contact us here for free consultation.
India generates over 72,000 MLD of sewage daily, but less than half is treated effectively. This untreated wastewater flows into rivers like the Yamuna, Ganga, and Mula-Mutha, causing severe health and ecological damage. Despite multiple government initiatives like the Ganga Action Plan and National Mission for Clean Ganga, a significant sewage burden persists.
India is often termed by the world as the Spiritual capital, and people around the world flock to India to seek penance, embrace the tranquillity of nature and follow the path of GOD. But unfortunately, the past few centuries of dark chapters and post-independence blunders have made India and Indians be looked at as unfriendly to cleanliness, and we even prove it sometimes, because the very rivers that we worship and are sacred in our texts are among the most polluted rivers in the world.
By the 1970s and 80s, untreated sewage had become a national crisis. Outbreaks of cholera in Kolkata, jaundice in Surat (1994), and recurring typhoid cases in Delhi highlighted the urgent need for structured sewage management. It was clear that septic tanks and open drains could no longer cope with urban growth.
Why the Government Was Forced to Act
The first large-scale intervention came with the Ganga Action Plan (1986), which introduced Sewage Treatment Plants (STPs) in Kanpur, Varanasi, and other towns along the river. These were followed by the National River Conservation Plan (1995) and later the National Mission for Clean Ganga (2014).
The government realised that simply building drains wasn’t enough. What was needed were systems that could not only treat sewage but also manage solid waste sustainably. This is where biodigesters became a key component of STPs.
City Case Studies
Delhi ( Okhla STP, 1990s): One of the largest STPs in Asia, Okhla adopted biodigesters to process sewage sludge and generate biogas. However, poor maintenance has kept its output below potential, highlighting the gap between design and operation.
Kanpur (Ganga Action Plan, 1986): As one of the first cities to adopt STPs with biodigesters, Kanpur showed early promise. But decades later, many plants fell into disrepair due to lack of funding and technical oversight, contributing to ongoing Ganga pollution.
Pune (Mula-Mutha River STPs, upgraded in 2018): A positive example, where biodigesters were modernised to produce electricity from biogas, helping reduce operational costs while tackling sewage loads.
Why Many Systems Struggle Today
Despite success stories, 40% of India’s STPs are either non-functional or underperforming (CPCB data). The reasons include:
Poor Maintenance: Microbial cultures die out when not replenished.
Finding Gaps: Municipal budgets often fail to cover operations.
Skill Shortages: A lack of trained operators undermines performance.
Outdated Designs: Many STPs still run on decades-old technology.
Role of Biodigesters in STPs
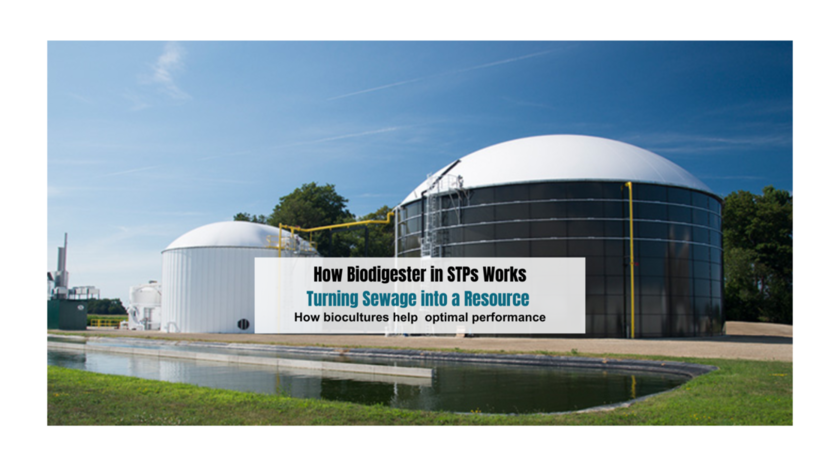
Biodigesters in Sewage Treatment Plants (STPs) are anaerobic chambers that use microbes to break down sludge. They:
Convert organic matter into biogas and nutrient-rich slurry.
Enable energy generation from methane.
Stabilise sludge and make it safe for reuse.
While cities like Delhi, Kanpur, and Pune have adopted biodigesters, around 40% of India’s STPs underperform due to poor microbial management, outdated designs, and lack of skilled operators.
How Biocultures Improve Biodigester Working
Biodigesters thrive only when the microbial population is balanced and active. Without replenishment, microbial colonies collapse, leading to foul odour, incomplete digestion, and reduced biogas yield.
Here’s how biocultures for STPs can solve these challenges:
Odour & Pathogen Control: Maintains hygienic and sustainable operations.
Team One Biotech’s Expertise
As one of the leading biotech companies in India, Team One Biotech provides customised bioculture formulations to optimise biodigester working in STPs, ETPs, and decentralised sewage systems.
Our solutions include:
Anaerobic Biocultures tailored for methane generation.
Sludge-reducing microbial consortia to extend biodigester life.
Start-up cultures for new STPs or after shock loads.
On-site consultation and training for plant operators.
By integrating our biocultures, municipalities and industries can transform underperforming biodigesters into efficient, sustainable, and cost-saving systems.
Conclusion
Biodigesters are the backbone of modern sewage treatment in India, but they need consistent microbial support. Team One Biotech bridges this gap with advanced biocultures for STPs, ensuring reliable biodigester working, reduced sludge, and higher biogas yields.
With the right biotechnological support, India can move towards a circular wastewater economy, cleaner rivers, and healthier cities.
Explore More Solutions by Team One Biotech
Apart from biocultures for wastewater treatment, Team One Biotech also offers innovative and eco-friendly solutions across multiple sectors, including: