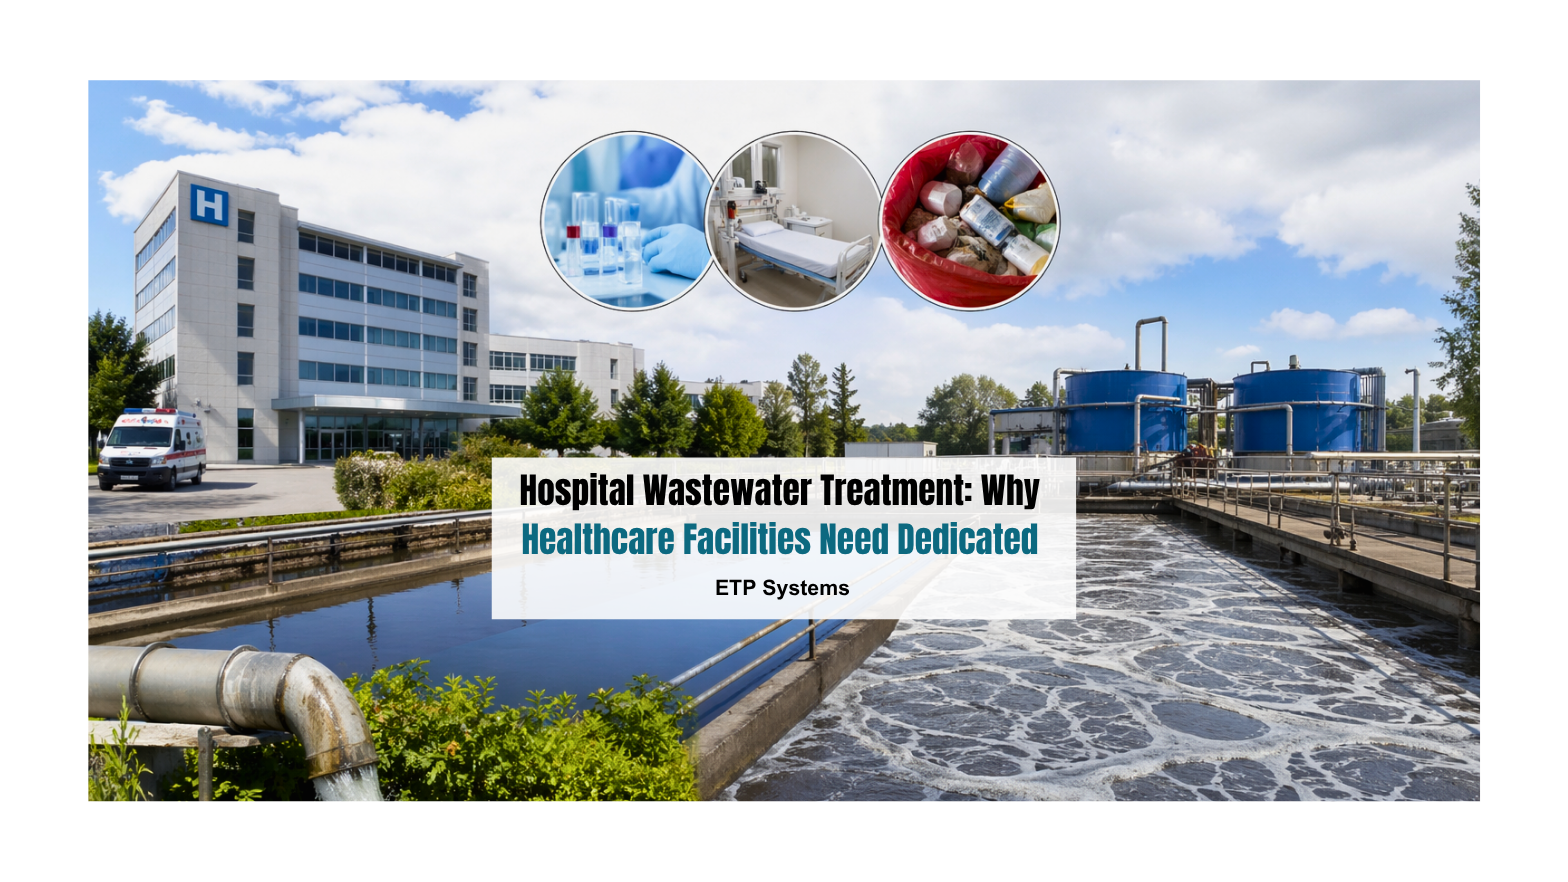
Hospital Wastewater Treatment: Why Healthcare Facilities Need Dedicated ETP Systems
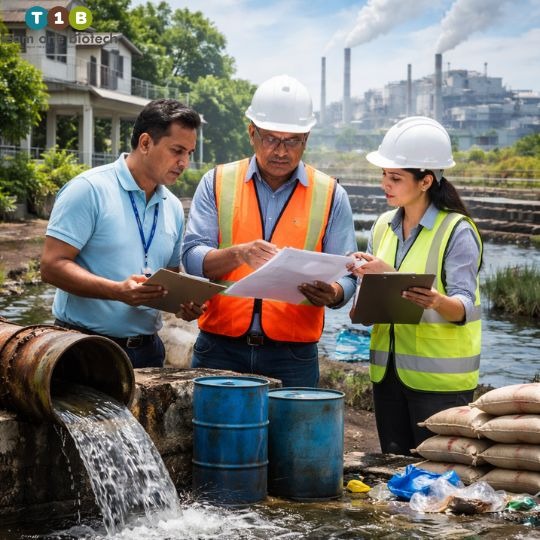
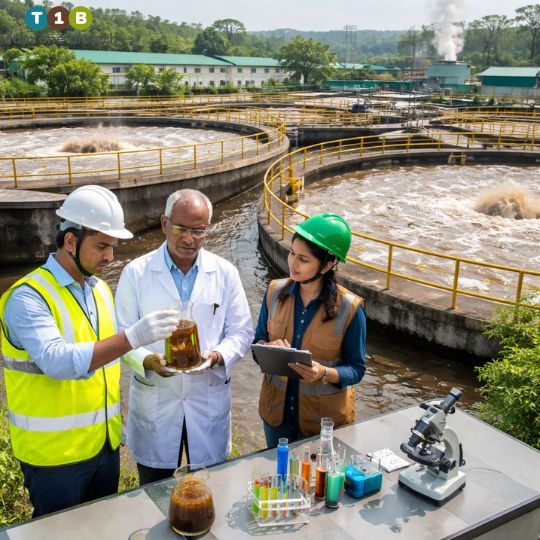
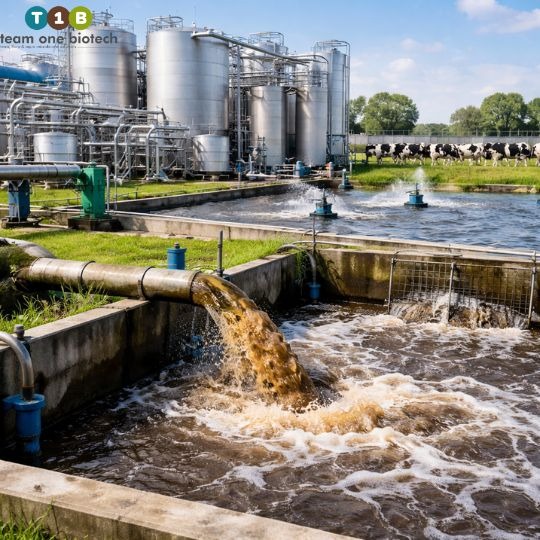
A busy government hospital in Lucknow or a sprawling private medical complex in Hyderabad. Thousands of patients pass through every week. Surgeries happen around the clock. Dialysis units run in shifts. Oncology wards administer chemotherapy. And from every one of these activities, water flows out, carrying with it a chemical and biological burden that most people never think about.
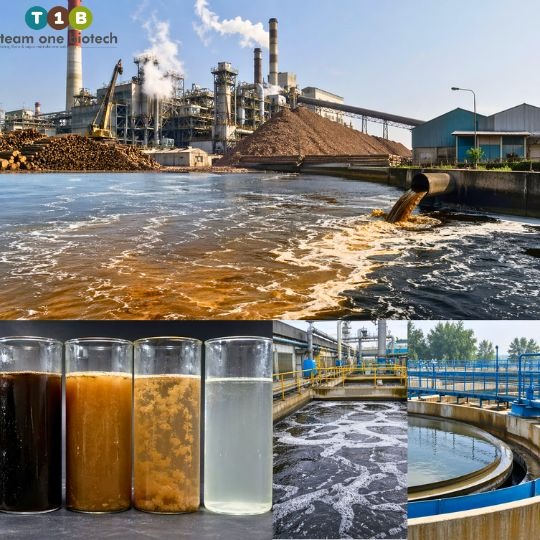
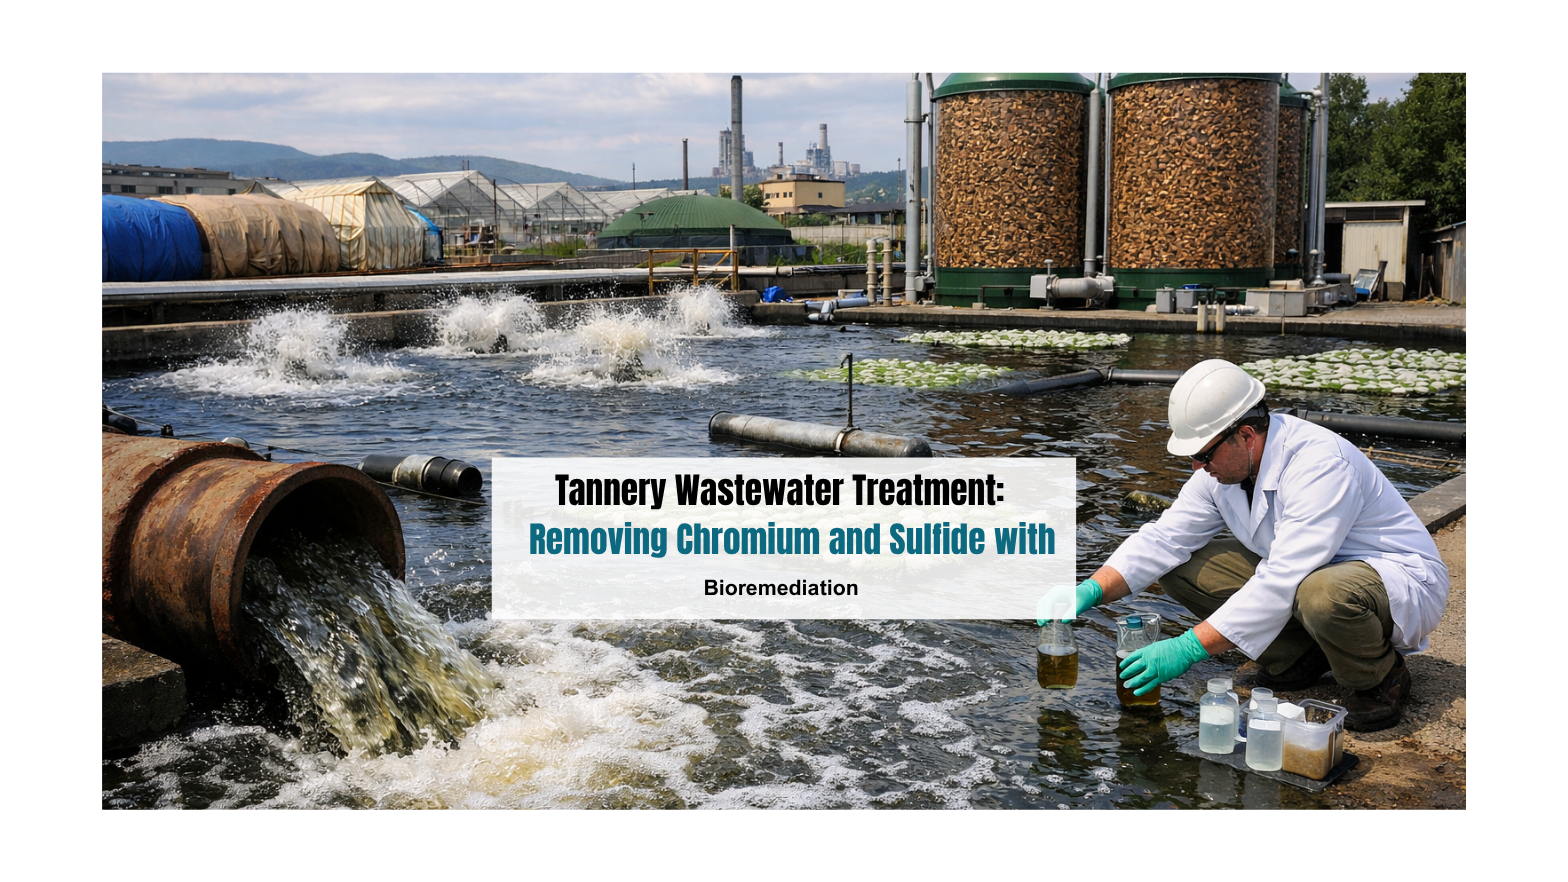
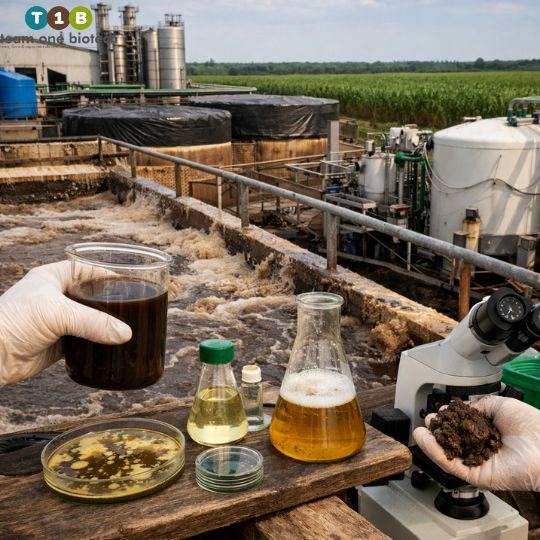
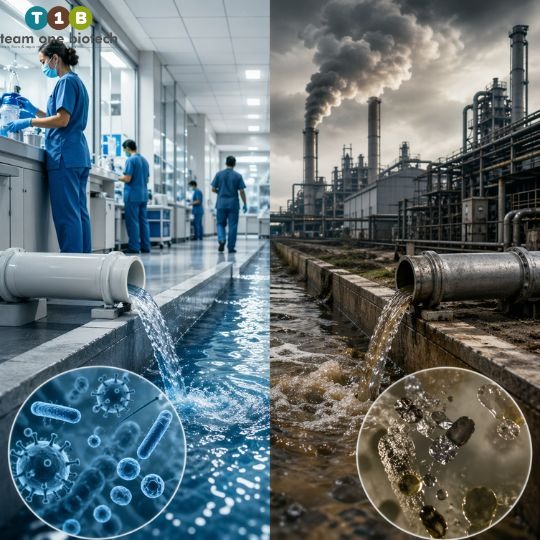
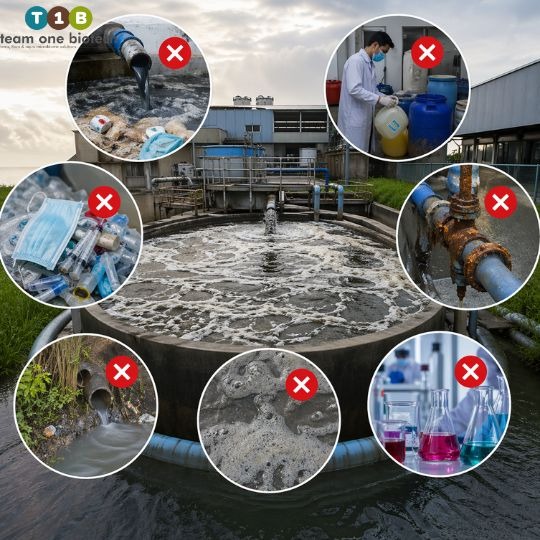
This is not ordinary wastewater. What leaves a hospital through its drainage network is a complex mixture of blood, body fluids, residual pharmaceuticals, heavy metals from imaging chemicals, disinfectants, antibiotic compounds, and, critically, drug-resistant microbial organisms. This “toxic cocktail,” as environmental engineers who work in this space often call it, finds its way into municipal sewage lines, open drains, and, in far too many cases, directly into local water bodies without meaningful treatment.
For communities living near these facilities, especially in India’s densely populated urban corridors, this is not an abstract environmental concern. It is a daily, silent public health crisis.
Why Hospital Wastewater Is Not Like Industrial Wastewater
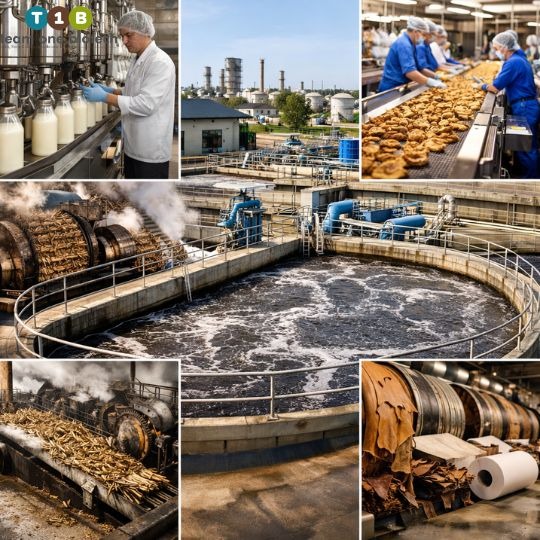
Most EHS managers working in pharma, dairy, food processing, or paper manufacturing already understand effluent treatment. You manage BOD, COD, TSS, pH. You run your ETPs, maintain compliance records, and file reports with your State Pollution Control Board (SPCB). That experience is valuable, but it does not fully prepare you for the unique complexity of healthcare effluent.
Here is what makes Hospital Wastewater Treatment fundamentally different:
- Pharmaceutical Residues: Patients excrete a significant fraction of the drugs they consume. Antibiotics, hormones, cytotoxic agents, and analgesics enter the wastewater stream in concentrations ranging between 0.01–100 micrograms per litre depending on the drug and ward type. Conventional biological treatment units are not designed to break these down.
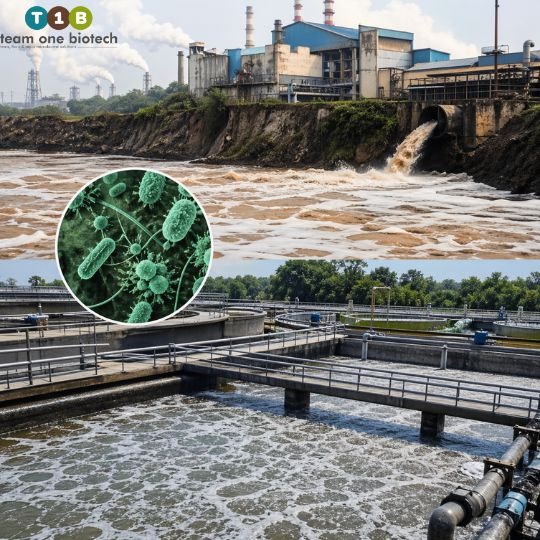
- Antimicrobial Resistance (AMR) Genes: This is the sleeper issue that’s now getting serious attention from the World Health Organization. Hospital wastewater is a known hotspot for AMR gene transfer. When resistant organisms and genetic material pass into water bodies, they seed environmental reservoirs for superbugs. The Yamuna, Ganga, and Musi rivers have all shown alarming AMR profiles in research conducted over the last decade.
- Pathogenic Load: Unlike industrial effluent, hospital wastewater carries active pathogens, bacterial, viral, and fungal. Without proper disinfection stages, these organisms survive into receiving water bodies. The BOD of hospital wastewater typically ranges between 150–350 mg/L, and COD can run anywhere from 250–600 mg/L depending on facility type and case mix.
- Variable Flow and Composition: A textile mill produces a fairly predictable effluent stream. A hospital does not. Morning OPD hours, ICU operations, dialysis sessions, and laundry peaks create wide variation in both volume and pollutant load, sometimes within the same 24-hour period.
This variability is one reason generic ETPs routinely underperform in healthcare settings.
The Regulatory Picture in India: CPCB and NGT Are Watching
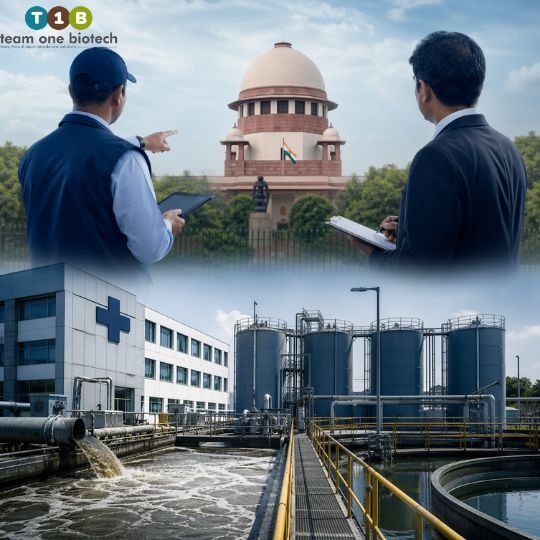
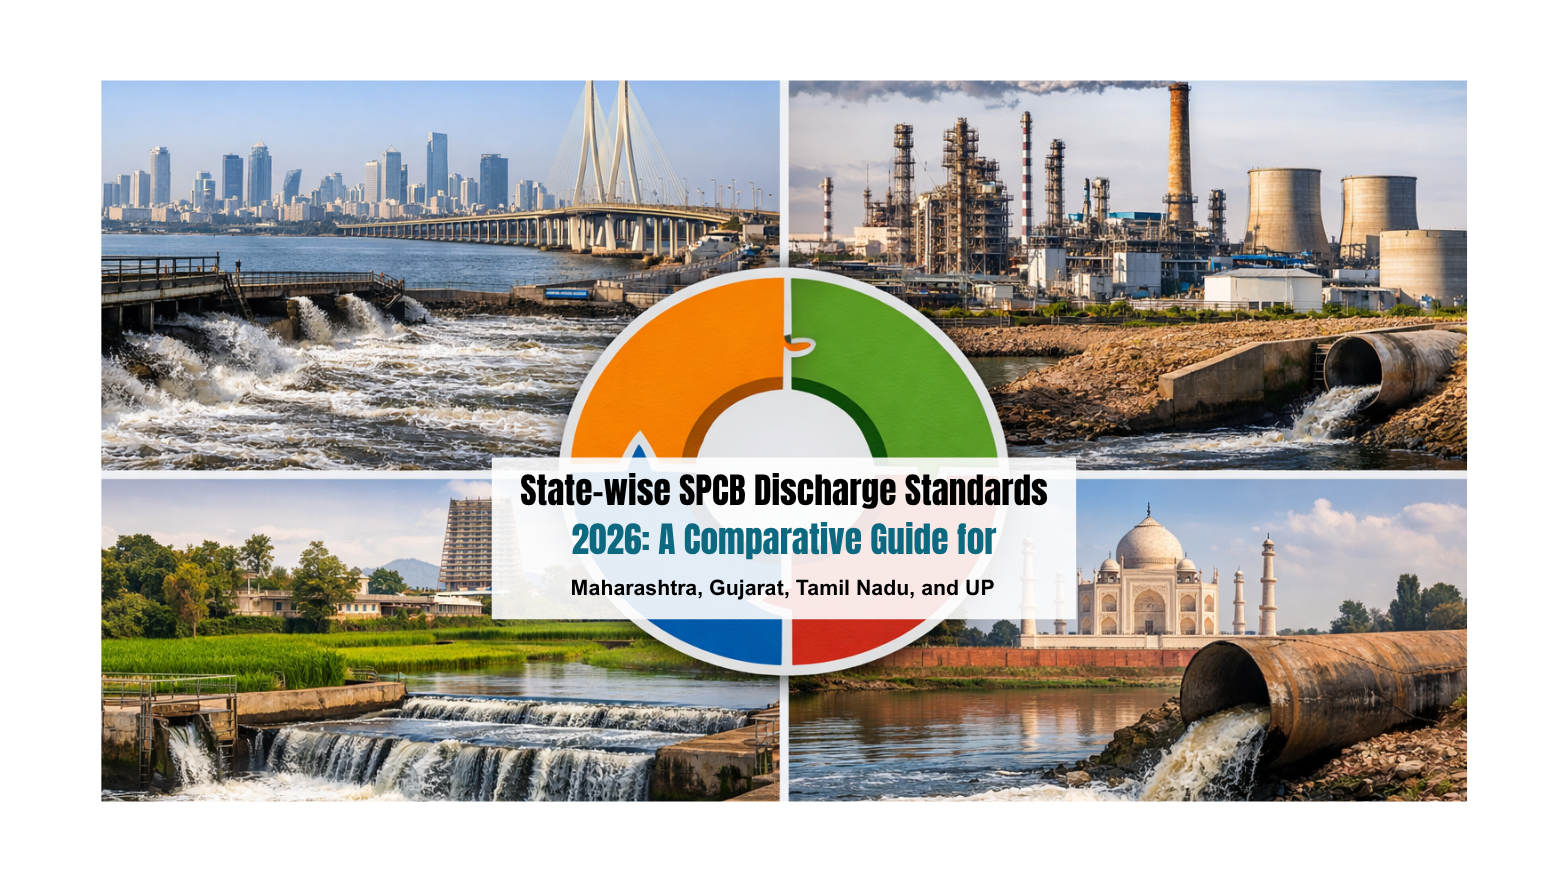
The Central Pollution Control Board (CPCB) has issued specific discharge standards for hospitals under the Environment Protection Act, and the Bio-Medical Waste Management Rules, 2016 (amended 2018) govern liquid waste disposal. Many states have gone further, Maharashtra, Karnataka, Tamil Nadu, and Delhi have SPCB-level directives that impose tighter standards on larger healthcare establishments.
The National Green Tribunal (NGT) has become increasingly assertive. In multiple landmark orders, the NGT has penalized healthcare institutions, including government hospitals, for discharging untreated or inadequately treated effluent into municipal drains and water bodies. Fines have ranged from lakhs to crores, and in some cases, facility operations have been restricted.
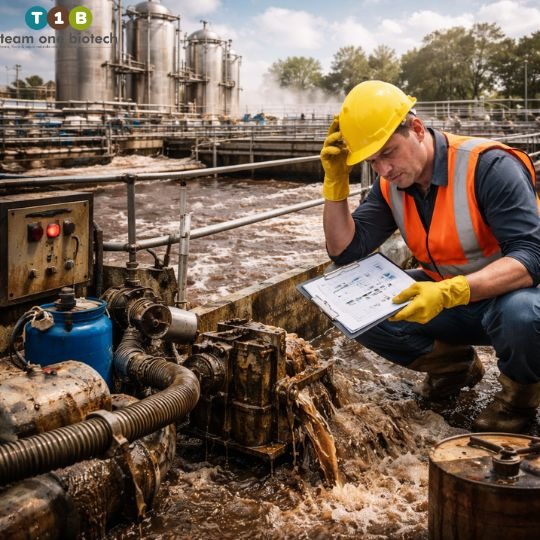
And yet, a 2023 audit by environmental researchers across Tier-1 and Tier-2 Indian cities found that a substantial proportion of hospitals, particularly nursing homes, smaller private facilities, and district hospitals, either lack functional ETPs or operate systems that were designed for domestic sewage rather than clinical-grade effluent. This is a compliance gap waiting to become a liability.
If you are an administrator or EHS manager responsible for a healthcare facility, the question is not whether your facility will face scrutiny. It is whether you will be ready when it does.
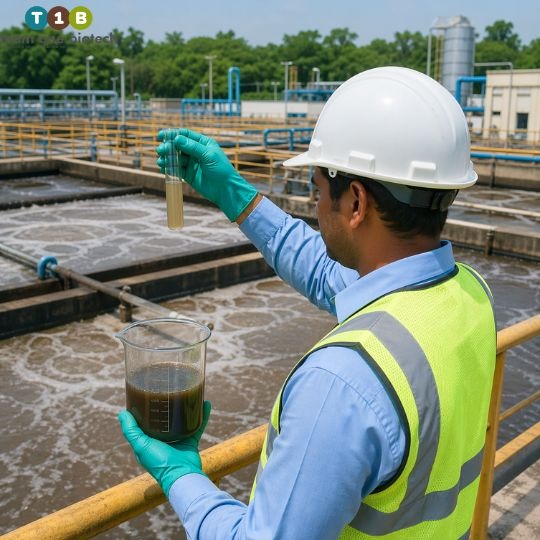
If your current ETP setup was not specifically designed for hospital wastewater, this is the right time to request a professional Wastewater Audit from Team One Biotech. Our team will evaluate your current system, identify gaps in CPCB compliance, and give you a clear action plan, no obligations.
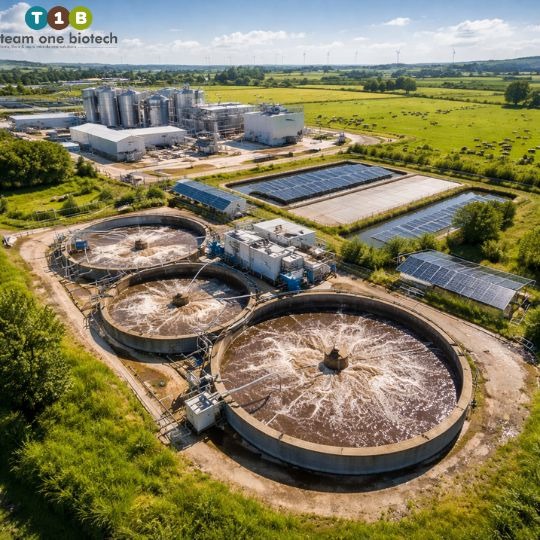
What a Dedicated ETP for Hospitals Actually Looks Like
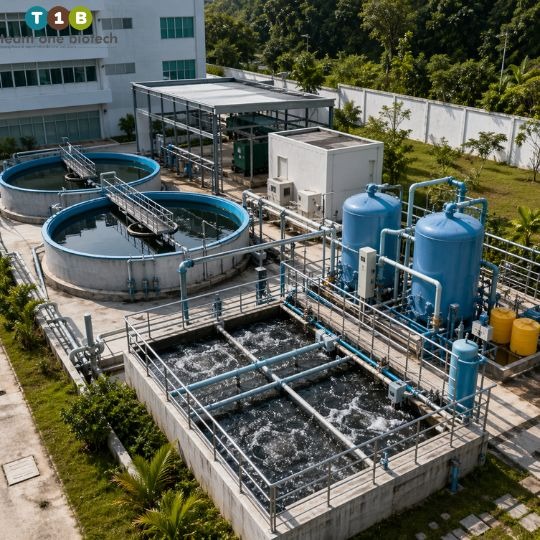
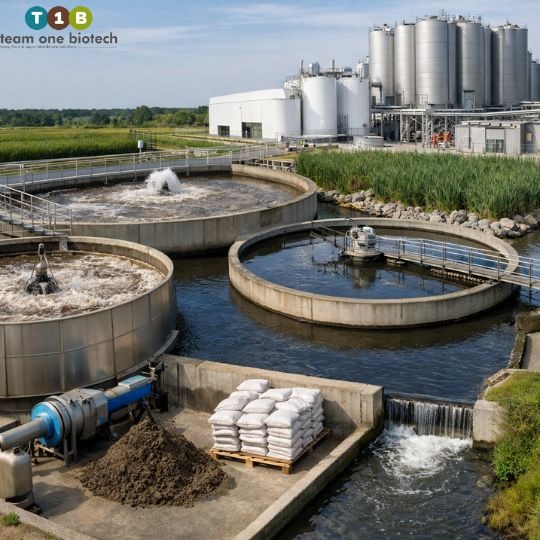
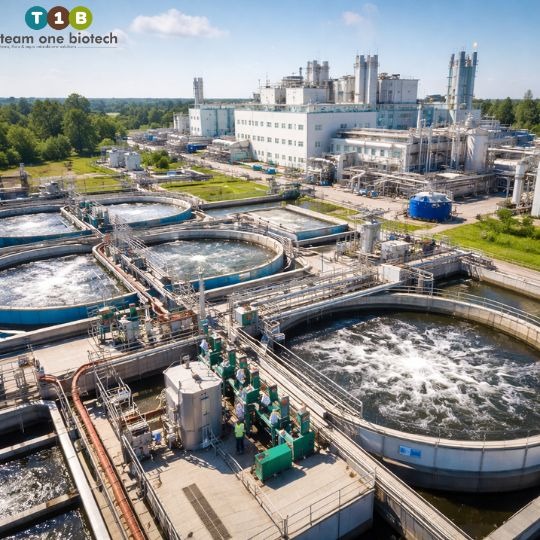
A properly engineered hospital ETP is a multi-stage system that addresses the specific threat vectors of healthcare effluent. Here is a simplified breakdown of what that looks like in practice:
Primary Treatment
Screening, grit removal, and equalization. The equalization tank is particularly important in healthcare applications, it buffers the wide flow variations mentioned earlier and ensures that downstream biological stages receive a consistent load.
Secondary Biological Treatment
This is where the heavy lifting happens. Activated sludge processes, Moving Bed Biofilm Reactors (MBBR), or Sequencing Batch Reactors (SBR) are common choices. BOD and COD reduction at this stage can bring levels down to 30–100 mg/L and 100–250 mg/L respectively, when properly sized and operated.
Tertiary and Advanced Treatment
Given the pharmaceutical and AMR concerns unique to hospitals, tertiary treatment is non-negotiable. This typically includes:
- Coagulation and flocculation for suspended solids
- Activated carbon adsorption for pharmaceutical residue removal
- Chlorination or UV disinfection for pathogen kill
- Ozonation in high-specification systems
Sludge Management
Hospital ETP sludge is classified as hazardous. It requires proper dewatering, containment, and disposal in line with Bio-Medical Waste Rules, a step that many facilities overlook when setting up basic treatment units.
Technical Deep Dive: Why Bioremediation Outperforms Traditional Chemical Dosing
This is where things get genuinely interesting, and where the gap between legacy practice and modern science becomes very clear.
Traditional hospital ETPs lean heavily on chemical treatment: coagulants like alum or ferric chloride, hypochlorite for disinfection, and acid/alkali for pH adjustment. These approaches work in narrow parameters. But they have well-documented limitations in healthcare applications:
- They do not biodegrade pharmaceuticals. Chemical coagulation removes suspended matter. It does not break down dissolved drug molecules, hormones, or AMR genetic material.
- They generate high volumes of chemical sludge, which itself becomes a disposal burden.
- Operating costs are persistent and high. Chemical procurement, handling, and dosing add recurring expenditure running into lakhs per year for medium-to-large facilities.
- System sensitivity to load variation means that during peak hours, chemical dosing systems can underperform, leading to compliance breaches.
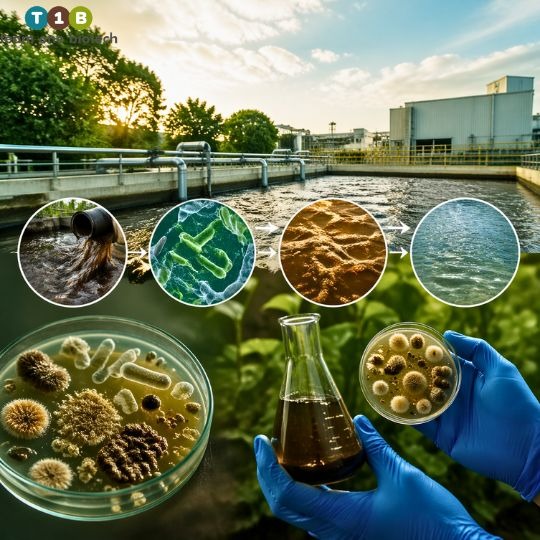
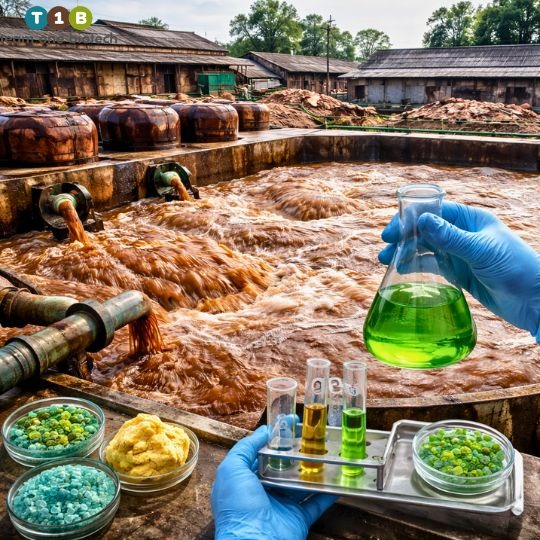
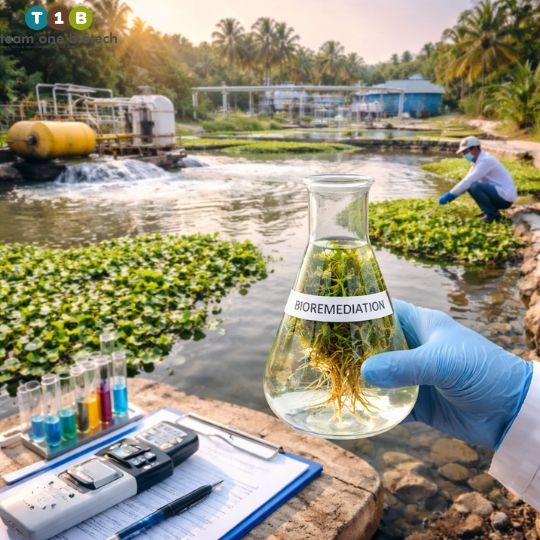
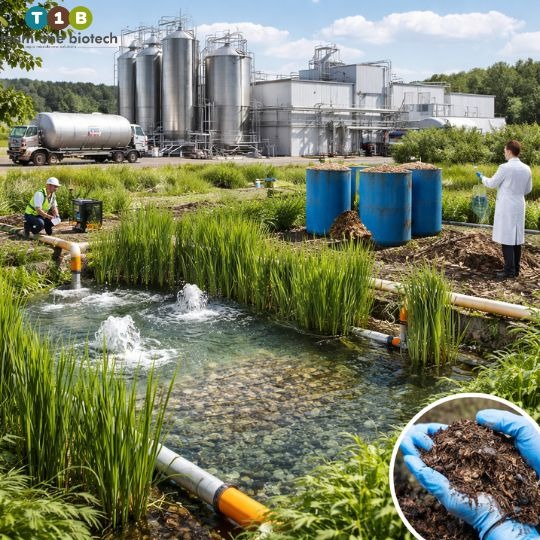
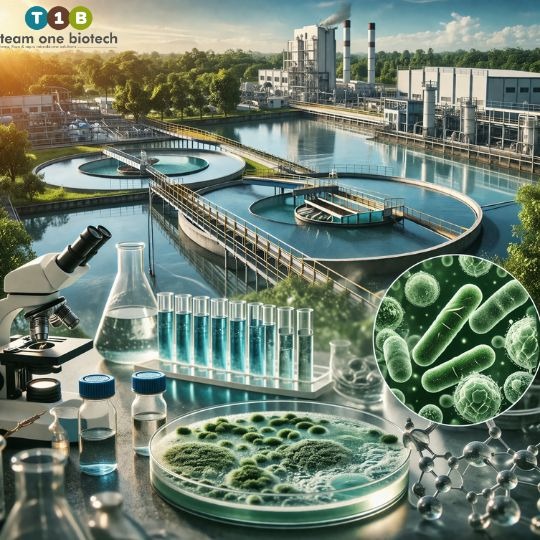
Bioremediation, Team One Biotech’s core area of expertise, takes a fundamentally different approach. Rather than adding synthetic chemicals to suppress or precipitate pollutants, bioremediation introduces specialized microbial consortia that actively metabolize contaminants.
In hospital wastewater applications, this means:
- Pharmaceutical degradation at the molecular level. Carefully selected microbial strains can break down antibiotic residues, hormonal compounds, and certain cytotoxic metabolites, converting them into water, carbon dioxide, and biomass rather than leaving them in altered chemical form.
- AMR risk reduction. Research increasingly supports that robust biological treatment with diverse microbial communities can suppress the proliferation of resistant organisms. A healthy microbial ecosystem outcompetes pathogens and ARB (antibiotic-resistant bacteria) for resources.
- Lower sludge generation. Biological processes typically produce 30–50% less sludge than comparable chemical treatment systems, a significant operational and disposal cost advantage.
- Greater operational stability. Well-established biofilm and suspended growth systems can tolerate load fluctuations better than chemical dosing when properly maintained.
- CPCB-compatible output. With the right system design, bioremediation-based ETPs can consistently achieve treated effluent quality within CPCB General Standards for discharge.
Team One Biotech’s proprietary microbial formulations have been deployed across healthcare, pharmaceutical, and industrial facilities across India. Our approach is site-specific: we do not sell a generic solution because hospital wastewater in Mumbai does not look the same as hospital wastewater in Bhopal.
Want to understand whether a bioremediation-based ETP could replace or supplement your existing system? Talk to our technical team for a Custom Bioremediation Plan tailored to your facility’s effluent profile.
Common Mistakes Healthcare Facilities Make With Their ETPs
A few patterns come up repeatedly when our team evaluates existing hospital wastewater systems:
- Undersizing the equalization tank. This single error leads to more ETP performance failures than almost any other design flaw.
- Treating the ETP as a one-time capital project rather than a living system that requires monitoring, microbial replenishment, and periodic process adjustment.
- Ignoring the pharmacy and laundry streams. These two sources often carry disproportionately high pharmaceutical and surfactant loads and need targeted pre-treatment before they reach the main ETP.
- Relying on third-party lab reports without in-house monitoring. By the time an external lab flags a problem, a compliance breach has already occurred.
- Not planning for the NGT audit cycle. Regulatory bodies are increasingly coordinating surprise inspections, and facilities that rely on compliance-by-paperwork rather than compliance-by-performance are the most exposed.
Liquid Medical Waste Management: The Overlooked Last Mile
Even facilities with reasonably functional ETPs often have a blind spot around liquid medical waste management at the source. Properly segregating and pre-treating high-risk liquid streams, from pathology labs, operation theatres, dialysis units, and isolation wards, before they enter the main drainage network is both a regulatory requirement and a practical necessity.
Without source-level segregation protocols, a single high-load event (say, a dialysis session’s concentrated effluent or a pathology lab’s chemical waste) can overwhelm downstream biological treatment stages. Our recommendation: treat liquid medical waste management as a facility-wide discipline, not just an ETP engineering problem.
The Business Case for Getting This Right
Beyond compliance, there is a straightforward business case. Hospitals that invest in properly designed, professionally maintained dedicated ETP systems typically see:
- Reduced risk of NGT/SPCB penalties, which can range from Rs. 5 lakh to Rs. 5 crore depending on severity and jurisdiction
- Lower long-term operating costs compared to chemical-heavy legacy systems
- Stronger positioning for NABH accreditation and green hospital certifications
- Reputational protection in an era when environmental accountability is increasingly a factor in institutional trust
This is not a regulatory checkbox exercise. It is an investment in the long-term operational resilience of your facility.
Ready to move from compliance risk to compliance confidence? Team One Biotech offers end-to-end support, from initial Wastewater Audit to system design, microbial supply, and ongoing monitoring. Contact our EHS advisory team today and take the first step toward a fully compliant, bioremediation-powered hospital ETP.
Disclaimer: The values mentioned in this article, including BOD, COD, flow rates, cost ranges, and treatment performance benchmarks, are general estimates and industry benchmarks. Actual requirements and performance metrics vary based on individual ETP design, specific facility loads, local regulatory conditions, and operational parameters. Always consult a qualified EHS engineer or licensed ETP designer before making facility-specific decisions.
Looking to improve your ETP/STP efficiency with the right bioculture?
Talk to our experts at Team One Biotech for customised microbial solutions.
Contact: +91 8855050575
Email: sales@teamonebiotech.com
Visit: www.teamonebiotech.com
Discover More on YouTube – Watch our latest insights & innovations!-
Connect with Us on LinkedIn – Stay updated with expert content & trends!